Abstract
Somatostatin signals predominantly through somatostatin receptor (SSTR) subtype 2 to attenuate GH release. However, the independent role of the receptor in regulating GH synthesis is unclear. Because we had previously demonstrated constitutive SSTR2 activity in mouse corticotrophs, we now analyzed GH regulation in rat pituitary somatotroph (GC) tumor cells, which express SSTR2 exclusively and are devoid of endogenous somatostatin ligand. We demonstrate that moderately stable SSTR2 overexpression (GpSSTR2WT cells) was associated with decreased GH promoter activity, GH mRNA, and hormone levels compared with those of control transfectants (GpCon cells). In contrast, levels of GH mRNA and peptide and GH promoter activity were unchanged in GpSSTR2DRY stable transfectants moderately expressing DRY motif mutated SSTR2 (R140A). GpSSTR2DRY did not exhibit an enhanced octreotide response as did GpSSTR2WT cells; however, both SSTR2WT-enhanced yellow fluorescent protein (eYFP) and SSTR2DRY-eYFP internalized on octreotide treatment. Suberoylanilide hydroxamic acid (SAHA), a histone deacetylase inhibitor, increased GH synthesis in wild-type GC cells and primary pituitary cultures. GpSSTR2WT cells induced GH synthesis more strongly on SAHA treatment, evident by both higher GH peptide and mRNA levels compared with the moderate but similar GH increase observed in GpCon and GpSSTR2DRY cells. In vivo SAHA also increased GH release from GpSSTR2WT but not from control xenografts. Endogenous rat GH promoter chromatin immunoprecipitation showed decreased baseline acetylation of the GH promoter with exacerbated acetylation after SAHA treatment in GpSSTR2WT compared with that of either GpSSTR2DRY or control cells, the latter 2 transfectants exhibiting similar GH promoter acetylation levels. In conclusion, modestly increased SSTR2 expression constitutively decreases GH synthesis, an effect partially mediated by GH promoter histone deacetylation.
Somatostatin receptor (SSTR) subtype 2, a Gαi protein–coupling receptor is the dominant mediator of somatostatin ligand GH inhibition at the pituitary gland. Ligand-independent constitutive G protein–coupled receptor (GPCR) activity is a well-established phenomenon known to correlate with receptor expression levels (1–3). We showed previously that constitutive ligand-independent SSTR2 activity in murine AtT20 ACTH-secreting pituitary tumor cells was associated with specific hormonal changes. SSTR2 knockdown increased basal intracellular cAMP and secreted ACTH levels (4), whereas SSTR2 overexpression rendered cells less responsive to CRH (5). Somatostatin (SRIF)–associated SSTR2 activation acutely inhibits GH secretion through adenylate cyclase inhibition and decreased intracytoplasmic calcium influx (6–8). However, whether ligand-independent SSTR2 signaling also directly regulates GH synthesis is as yet unclear (8). Although several studies have indicated that SRIF does not alter basal GH mRNA levels (9, 10), low amounts of adenovirus-driven SSTR2 overexpression were shown to reduce GH mRNA expression in primary human somatotroph tumor cultures (11). However, because of the cellular heterogeneity of human tumor culture, it was not possible to isolate SSTR2 actions. We therefore aimed to assess isolated constitutive SSTR2 activity in GH-secreting cells and study GH synthesis as the end point.
Unraveling selective SSTR2 action on pituitary somatotroph cells is challenging. SRIF and the clinically available SRIF agonists regulate several SSTRs simultaneously. Moreover, both normal and tumoral somatotrophs express more than one SSTR subtype (6–8), each of which may also interact and heterodimerize (12). Therefore, measured treatment outcomes are probably reflective of combined signaling effects of several SSTR subtypes. We therefore aimed to study GH-secreting cells restricted to expressing the SSTR2 subtype alone.
Several signaling pathways regulate GH gene expression. GH-releasing hormone up-regulates GH transcription via activation of the adenylate cyclase–cAMP–protein kinase A pathway (13–15) as does mitogen-activated protein kinase activation in GH3 cells (16) and gsp oncogene-expressing GH4C1 cells (17). Core histone acetylation was shown to regulate the human GH locus control region to facilitate GH promoter transfactor binding and transcription activation (18). Furthermore, dopamine receptor subtype 2, also a Gαi coupling GPCR that inhibits prolactin (PRL) and is also expressed in somatotrophs, induced rapid histone deacetylation of the PRL promoter (19). In light of these observations, we assessed whether constitutive SSTR2 activity regulates recombinant (r) GH promoter deacetylation and subsequent rGH synthesis.
Because credible tools for detection and analysis of constitutive receptor activity including a naturally occurring constitutively active SSTR2 mutant or an inverse SRIF agonist are not available, we used recombinant SSTR2 transfectants as described previously (20). Increased numbers of GPCRs in active conformation enhance the ability to detect constitutive receptor activity (1, 2). In addition, changes in constitutive GPCR activity were demonstrated after mutating the receptor DRY motif (aspartate-arginine-tyrosine) (21, 22) conserved in all 5 SSTRs and residing at transmembrane domain 3 part of the “ionic lock” salt bridge stabilizing GPCRs in an inactive state. Mutation of arginine in the DRY motif was shown to inhibit constitutive activity in some class A GPCRs (21).
We stably expressed wild-type (WT) and DRY mutant (R140A) SSTR2 in GC cells expressing the endogenous SSTR2 and no other SSTR subtypes or SRIF ligand and demonstrate that moderate elevation of WT SSTR2 expression constitutively inhibits GH synthesis. We also show that this effect is associated with GH promoter deacetylation both in vitro and in vivo.
Materials and Methods
Materials
Octreotide (Phoenix Pharmaceuticals, Burlingame, California) was resuspended in sterile water in 1 mM stocks. Suberoylanilide hydroxamic acid (SAHA) (Cayman Chemical, Ann Arbor, Michigan), forskolin, and 3-isobutyl-1-methyxanthine (IBMX) (Sigma-Aldrich, St Louis, Missouri) were suspended in dimethyl sulfoxide (DMSO) in 10 mM stocks. All were stored at −20°C, thawed once, and used immediately.
Plasmids
WT human (h) SSTR2 subcloning into enhanced yellow fluorescent protein (eYFP)-N1 and pIRES-ZsGreen1 vectors (Clontech, Mountain View, California) was described previously (5, 23). These plasmids (hSSTR2WT-eYFP and hSSTR2WT-IRES-ZsGreen) were used as templates for DRY mutagenesis, ie, R140A point mutation (replacing CGA for arginine with GCA for alanine at position 140). The hSSTR2DRY-IRES-ZsGreen mutant was generated using a polymerase cycling assembly with a Phusion Hi-Fidelity PCR Kit (New England BioLabs, Ipswich, Massachusetts). Primers (Invitrogen/Life Technologies, Grand Island, New York) spanning the desired mutated hSSTR2 and adjacent restriction site EcoR1 at the C terminus and BamHI at N terminus were performed in 2 PCR reactions, one with 5′-TTCGAATTCACCATGGACATGGCGGATGA-3′ and 5′-ACAGCCAGGTATGCGTCGATGCTCATGACTGT-3′ and the other with 5′-TGAGCATCGACGCATACCTGGCTGTGGTCCA-3′ and 5′-GGCGGATCCTCAGATACTGGTTTGGAGGTCT-3′. The hSSTR2DRY product was gel purified with a QIAEXII Gel Extraction Kit (QIAGEN, Valencia, California), digested with BamHI and EcoRI restriction enzymes (New England BioLabs), and then subcloned into pIRES2-ZsGreen1 using the a Zero Blunt PCR Cloning Kit (Invitrogen/Life Technologies).
hSSTR2DRY-eYFP was generated using a QuikChange II Site-Directed Mutagenesis Kit (Agilent Technologies, Santa Clara, California) with primers 5′-AGTCATGAGCATCGACGCATACCTGGCTGTGGTC-3′ and 5′-GACCACAGCCAGGTATGCGTCGATGCTCATGACT-3′.
GC cells and primary pituitary cultures
GC cells (GH1, reported passage 37; American Type Culture Collection, Manassas, Virginia) were grown in DMEM (Invitrogen, Carlsbad, California), supplemented with 10% fetal bovine serum (FBS) (Omega Scientifics, Tarzana, California) and 1% penicillin/streptomycin (Invitrogen), in a humidified incubator at 37°C and 6% CO2. Cells were passaged twice in our laboratory before they were stably transfected. WT GC cells were stably transfected as described previously (5) using Effectene (QIAGEN) with pIRES-ZsGreen1 vector containing either WT hSSTR2WT or mutated hSSTR2DRY or empty vector as a control. Polyclonal stable transfectants were selected by geneticin (800 μg/mL; Invitrogen) and fluorescence-activated cell sorted using the ZgGreen tag as a selection marker. We next sorted for stable transfectants with the lowest ZsGreen tag expression, to generate control (GpCon), SSTR2WT (GpSSTR2WT), and SSTRDRY (GpSSTR2DRY) cells expressing the lowest transgene level. Cells were frozen during the second growth cycle, and fresh cells were thawed every 2 to 3 months for continuing experiments.
Twenty pituitary glands were harvested immediately after killing of 2- to 4-month-old C57BL/6J male mice, washed, minced, and enzymatically dissociated in DMEM containing 0.35% collagenase, 0.15% hyaluronidase, and 0.3% BSA (Sigma-Aldrich) at 37°C for 45 min. DMEM with 10% FBS was added to terminate cell dissociation, and cell suspensions were filtered, centrifuged, and resuspended in DMEM supplemented with 10% FBS. After 24 hours, medium was collected for GH measurement and replaced with fresh medium containing 10% FBS, and cells were then treated with 100 nM SAHA or vehicle (5 wells per treatment group) for the subsequent 48 hours. Supernatant was then collected, centrifuged, and frozen at −80°C until further analysis.
Quantitative real-time (qRT) PCR
Cells were plated and grown for 48 hours after which RNA was collected with an RNeasy Mini Kit (QIAGEN). Treatment with DNase 1 (QIAGEN) eliminated genomic DNA. RNA was reverse transcribed into first-strand cDNA using a QuantiTect reverse transcription kit, which includes an additional gDNA elimination step (QIAGEN). TaqMan Gene Expression Assays and TaqMan Universal Master Mix were purchased from Applied Biosystems (Foster City, California). Human (h) and rat (r) TaqMan Gene expression assays used were the following: hSSTR2 Hs00265624_s1 (which recognizes all 3 SSTR2 mRNAs), rSSTR1 Rn02532012_s1, rSSTR2 Rn01464950_g1, rSSTR3 Rn02134439_s1, rSSTR4 Rn00564741_s1, rSSTR5 Rn02535169_s1, GH (rGH) Rn01495894_g1, prolactin (rPRL) Rn00561791_m1, somatostatin (rSRIF) Rn00561967_m1, and cortistatin Rn00503272_m1. Amplicons were detected using the relevant probes tagged with MGB quencher and FAM dye. A TaqMan rat β-actin control gene expression assay with probes tagged with MGB and VIC (Applied Biosystems) was used as a reference. qRT PCR was performed in a 96-well plate in the iCycler iQ Detection System (Bio-Rad, Hercules, California). Test signals were normalized to parallel values obtained for β-actin. A comparative threshold cycle (CT) method was used for quantification of gene expression in either duplicate or triplicate samples. Each figure depicting qRT PCR results is compiled from at least 2 experiments, and each sample was analyzed in duplicate or triplicate.
cAMP assays
A total of 40 000 cells/well in 48-well plates were seeded the evening before the experiment, and 4 to 8 wells per sample point were used. Cells were treated with octreotide as indicated in DMEM containing 0.3% BSA, 1% penicillin/streptomycin, and 1 mM IBMX (Sigma-Aldrich) for 30 minutes in a humidified incubator at 37°C and 6% CO2. Intracellular cAMP was assayed in triplicate using the LANCE cAMP kit (PerkinElmer, Waltham, Massachusetts), according to the manufacturer's instructions and modified for intracellular cAMP (20). Results were extrapolated from a standard curve with a range of 1012 to 106 nM, and results were read by a Victor 3 1420-015 spectrophotometer (PerkinElmer). Each figure depicting cAMP results is compiled from at least 2 experiments, and each sample was analyzed in duplicate or triplicate and further duplicated when analyzed with the LANCE kit.
Hormone assays
RIAs for rat GH were performed with antibodies provided by the National Hormone and Pituitary Program, National Institute of Diabetes and Digestive and Kidney Diseases (A. F. Parlow, Harbor-UCLA Medical Center, Torrance, California). GH (5 μg) iodination with iodine-125 (500 μCi) (PerkinElmer Life and Analytical Sciences, Boston, Massachusetts) mixed with 0.1 mg of Iodogen (Pierce Chemical Co., Rockford, Illinois) was performed using G-75 Sephadex columns (Sigma-Aldrich). Low interspecies cross-reactivity of the GH assay was shown previously (24). Whole blood was left to coagulate at room temperature for 2 hours, and serum was separated and stored at −80 C until analyzed. Murine GH was measured by a rat/mouse GH ELISA (EMD Millipore, Billerica, Massachusetts). In medium collected from primary pituitary cultures, posttreatment murine GH levels were normalized to pretreatment levels. Mouse serum IGF-I levels were measured by ELISA (ALPCO Diagnostics, Salem, New Hampshire). Hormones were all analyzed in quadruplicate or quintuplicate.
Reporter assay
Rat GH promoter −4192/+167 was synthesized by GenScript (http://www.genscript.com/pcr_cloning.html) and subcloned into the promoterless basic pGL4.10[luc2] vector (Promega, Madison Wisconsin) to generate pGL4.10-rGHp-4.0-[luc2]. Promoterless pGL4.10 [luc2] and pGL4.74[hRluc] vectors served as internal controls (Promega). A total of 100 000 cells were plated in triplicate in a 24-well plate 1 day before transient transfection. Cotransfection groups included basic pGL4.10[luc2] vector (800 ng/well) with pGL4.74[hRluc] (5 ng/well) or pGL4.10-4 Kb-rGHp-[luc2] (800 ng/well) with pGL4.74[hRluc] (5 ng/well). Eight hours later, cells were either treated as indicated for 48 hours or not treated, after which whole-cell lysates were collected, and reporter activity was detected according to the dual-luciferase reporter system protocol (Promega). Reactions were measured with an Orion microplate luminometer (Berthold Detection System, Huntsville, Alabama). Each figure depicting luciferase results is compiled from 3 experiments, and each sample was analyzed in triplicate.
Fluorescent immunocytochemistry and confocal microscopy
A total of 2000 GC cells were plated on coverslips in DMEM supplemented with 10% FBS. On the following day, cells were transfected with either hSSTR2WT-eYFP or hSSTR2DRY-eYFP using Effectene. Two days after transfection, cells were treated with 10 or 100 nM octreotide for 1 hour or not treated. Then cells were washed and fixed as described (5) and mounted in ProLong Gold with 4′,6-diamidino-2-phenylindole mounting medium (Invitrogen/Life Technologies). Images were acquired with a TCS SP5-X confocal microscope (Leica Corp, Deerfield, Illinois). eYFP was detected using the 514 nm wavelength of the WLL laser and 4′,6-diamidino-2-phenylindole was detected using the 405 nm UV laser. Cells were imaged with a narrow spectral detection window to exclude autofluorescence, and the pinhole was set to 1.0 Airy unit for maximal resolution. Images depicted represent maximum intensity projections of confocal stacks.
Western blotting
A total of 400 000 cells/well were plated in 6-well plates for 48 hours and treated as indicated. Cells were collected on ice with lysis buffer containing protease inhibitor cocktail (Pierce Biotechnology, Rockford, Illinois) and kept at −80°C. Cellular proteins were separated on Tris-HCl polyacrylamide Mini Protean TGX 4% to 20% gels (Bio-Rad) in the Mini-Protean Tetra cell electrophoresis system (Bio-Rad) and transferred onto polyvinylidene difluoride membranes in the Trans-Blot Turbo Transfer System (Bio-Rad). Membranes were immunoblotted with antibodies against rat proteins including β-actin (dilution 1:20 000; EMD Millipore), rat GH (dilution 1:1000; A. F. Parlow, National Hormone & Peptide Program, Harbor-UCLA Medical Center), Pou1F1 (dilution 1:100, Pit-1, sc-47762; Santa Cruz Biotechnology, Santa Cruz, California). Protein bands were detected using Precision Plus Protein WesternC (Bio-Rad), and blots were scanned using ChemiDoc XRS system (Bio-Rad).
Proliferation studies
A total of 2000 GC cells/well were plated in a 96-well plates 24 hours before experiments. Primary pituitary cells were suspended and plated in 96-well plates alongside wells designated for GH measurements. Numbers of cells were assessed using the WST-1 Cell Proliferation Assay Kit, which marks metabolically viable cells (Clontech) and read at 450 nm absorbance in a Victor 3 1420-015 spectrophotometer (PerkinElmer). Each treatment was analyzed twice in octuplicate.
Chromatin immunoprecipitation (ChIP) analysis
A total of 15 000 000 GpCon, GpSSTR2WT, and GpSSTR2DRY cells, respectively, were plated in serum-supplemented medium in a 15-cm plate 1 day before treatment. Cells were then treated with SAHA or left untreated. As cells reached approximately 80% confluence, protein-DNA cross-linking, enzymatic shearing to 200- to 1000-bp fragments, H3K9-acetyl antibody-protein-DNA complex pull-down, reverse cross-linking, and digestion with proteinase K were performed according to the ChIP-IT Express Enzymatic Magnetic Chromatin Immunoprecipitation and Enzymatic Shearing Kit (Active Motif, Carlsbad, California). Normalized inputs of sheared chromatin DNA were incubated with acetyl histone H3(lys9) (H3K9 acetyl, dilution 1:50) antibody (C5B11; Cell Signaling Technology, Danvers Massachusetts) overnight at 4°C. Negative control IgG and positive control RNA polymerase II antibody were added at 10 μl (2 μg) per ChIP reaction. After final elution, cross-link reversal, and proteinase K digestion, all samples (input, test sample, positive controls, and negative controls for each of the conditions analyzed) were subjected to DNA clean-up using a Chromatin IP DNA Purification (Activ Motif). H3K9 acetylated rGH promoter chromatin fragments were amplified using SYBR Green real-time PCR using the iCycler iQ Detection System. Primer sets were randomly designed (Figure 8A) using Primer Express 2.0 software and chosen based on quality. Standard curves were established with endogenous rGH derived from WT GC cells and primers with efficiency >90% (calculated by the formula [10(−1/slope) − 1]) selected. Primer set efficiency was rGHP4 > rGHp5 > rGHp3 > rGHp2, and rGH promoter localization is depicted in Figure 8A. We used “method 2” recommended by the Actif Motif protocol, which calculates GH promoter acetyl enrichment on H3(Lys9) as a ratio of amplification efficiency of test sample vs the negative control (Activ Motif). Experiments were repeated 4 times; each sample qRT PCR was analyzed in triplicate.
Figure 8.
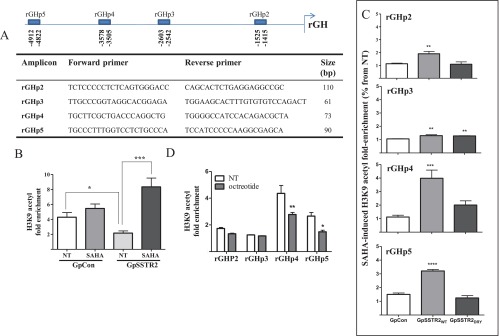
ChIP analysis of endogenous rat GH promoter H3K9 acetylation. A, Rat GH promoter qRT PCR primer location and sequence. B, H3K9 acetylation fold enrichment with respective primer sets in untreated (NT) and SAHA (100 nM)–treated GpCon and GpSSTR2WT cells. Results depicted are derived from four pooled experiments. C, H3K9 acetylation fold enrichment with each respective primer set in untreated and octreotide (100 nM)–treated GpCon and GpSSTR2WT cells. Results are derived from 2 pooled experiments. D, H3K9 acetylation fold enrichment with respective primer sets in untreated (NT) and SAHA (100 nM)–treated GpCon, GpSSTR2WT, and GpSSTR2DRY cells. Cells were treated every 24 hours with SAHA or octreotide (1 μM) for 48 hours and fixed, and H3K9 acetylation enrichment was analyzed using ChIP-IT Express Enzymatic Magnetic Chromatin Immunoprecipitation and Enzymatic Shearing Kits, following the manufacturer's instructions. *, P < .05; **, P < .01; ***, P < .001; ****, P < .0001.
Animal studies
Two-month-old male NOD.CB17-Prkdcscid/J mice (SCID, stock 001303; The Jackson Laboratory, Sacramento, California) were used for sc cell injection in accordance with institutional animal care and use committee approvals. Five mice were hosted in each cage and fed a commercial pelleted diet ad libitum and tap water. SCID mice were sc inoculated with 200 000 GpCon or GpSSTR2WT cells and suspended in 50 μL of PBS and 50 μL of BD Matrigel basement membrane matrix (BD Biosciences, San Jose, California). For the experiments presented in Figure 3C, tumors were allowed to grow for 30 days. For SAHA studies, 2-month-old male SCID mice were inoculated with either GpCon (n = 20) or GpSSTR2WT cells (n = 20). One week after inoculation, as tumors started to emerge, 10 mice from each tumor type group were injected ip twice weekly with 100 mg/kg SAHA. An equivalent DMSO dose was similarly injected into 10 control mice from each tumor type group. SAHA powder was dissolved in DMSO and further diluted in PBS (DMSO concentration 5%). The SAHA dose, frequency, and mode of administration were chosen based on prior reports (25, 26). We used a modest dose (100 mg/kg twice weekly for 2 weeks) to achieve hormone regulation while maintaining cell viability. Mice were followed for 21 days after cell inoculation for tumor growth and adverse events, and weight was measured before inoculation and before killing. No adverse events or weight loss was detected during the experiments, and mice tolerated tumor growth and SAHA treatment well. Mice were killed by CO2 inhalation followed by cervical dislocation, blood was collected for hormone analysis, and tumors were harvested and weighed.
Figure 3.
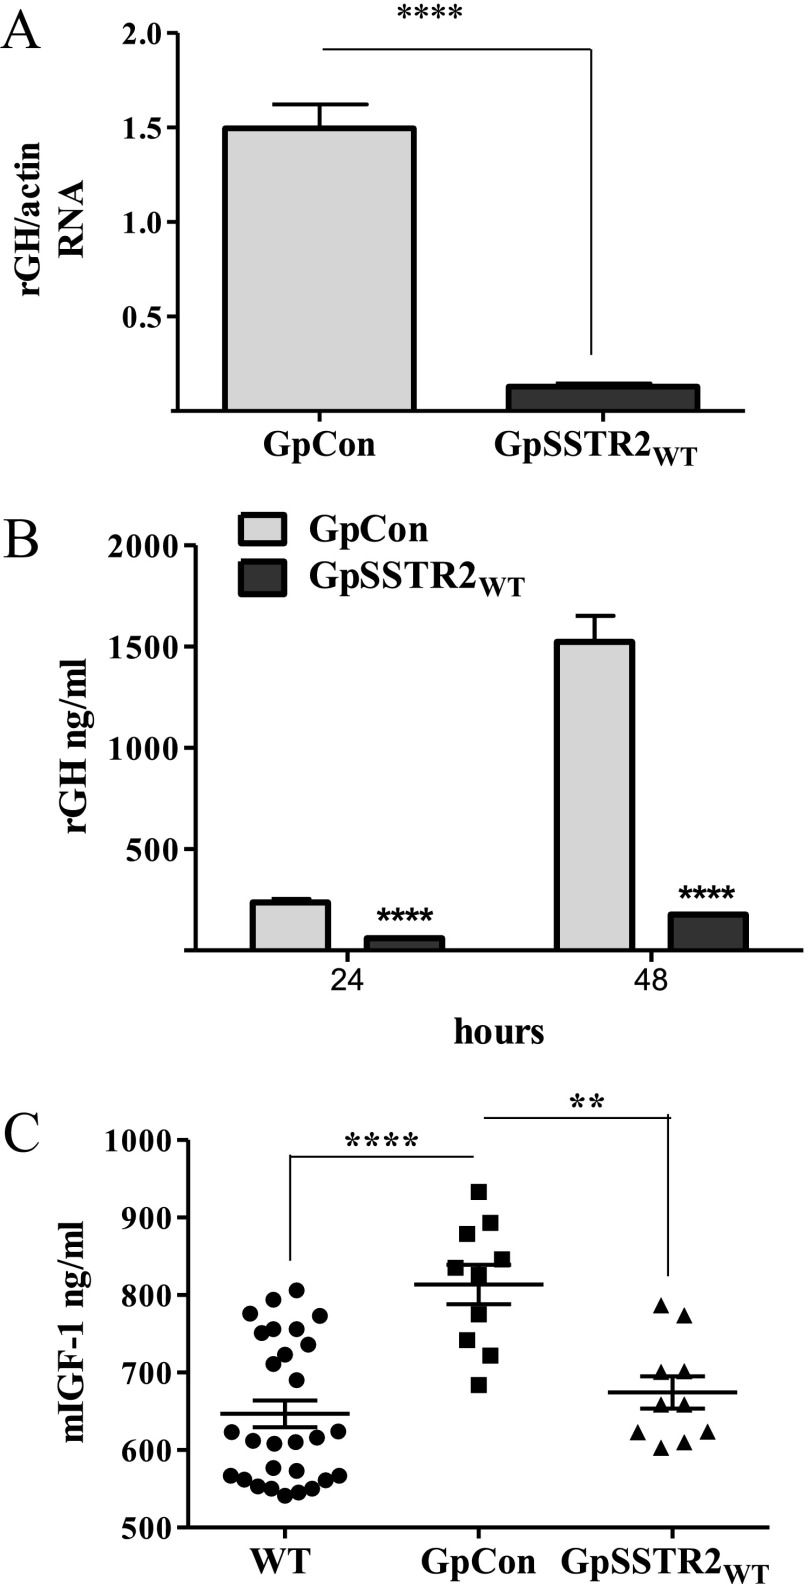
Effects of SSTR2 overexpression on baseline GH expression. A, GH mRNA levels 48 hours after plating. B, GH levels measured in the medium of GpCon and GpSSTR2WT cells at 24 and 48 hours after plating. C, Mouse serum IGF-I (m-IGF-1) levels in SCID mice before (n = 30) and 30 days after inoculation of GpCon tumors (n = 10) or GpSSTR2WT tumors (n = 10). A total of 200 000 cells were suspended in 100 μL of PBS and Matrigel and injected sc. Mice were killed 30 days later, tumors and blood were harvested, and serum mouse IGF-I was measured using an ELISA kit. **, P < .01; ****, P < .0001. NT, not treated.
Statistical analysis
Statistical analysis was performed with GraphPad Prism 4.0 (GraphPad Software Inc., San Diego, California). Analysis included means ± SEM, 1- or 2-way ANOVAs, and Bonferroni posttests where appropriate. Significance is indicated on all figures as follows: *, P < .05; **, P < .01; ***, P < .001; and ****, P < .0001.
Results
Transfectant characterization
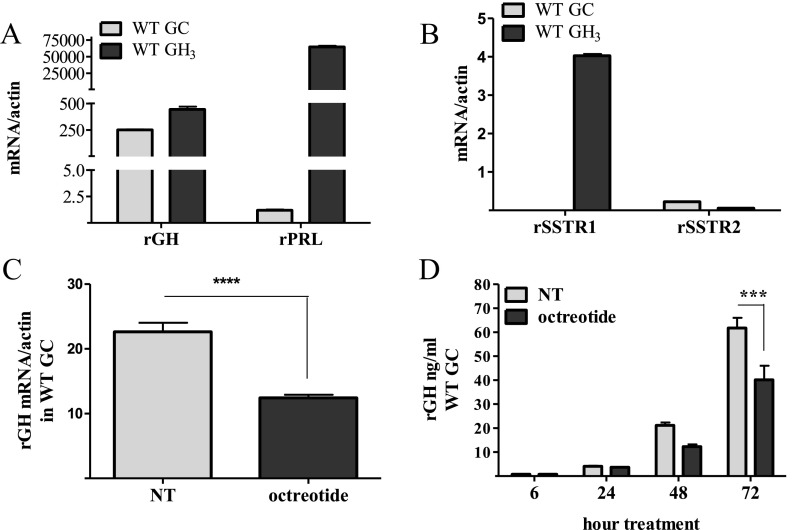
We grew GC and GH3 pituitary GH-secreting cell lines in 10% FBS-supplemented DMEM. GH3 cells expressed abundant PRL and GH mRNA and both rSSTR1 and rSSTR2 subtypes, whereas GC cells expressed mainly GH mRNA and the SSTR2 subtype exclusively (Figure 1, A and B). Neither SSTR3, SSTR4, nor SSTR5 mRNA was detected in either cell type, nor was SRIF or cortistatin detected in GC cells as measured by TaqMan assays (data not shown). Octreotide (100 nM daily) attenuated GH mRNA levels in WT GC cells (Figure 1C), and reduced levels of GH secreted in the cell medium by 30% (Figure 1D).
Figure 1.
Cell characterization. A and B, Comparative characterization of GH, PRL, SSTR1, and SSTR2 gene expression in untreated WT GC and GH3 cells grown in DMEM enriched with 10% FBS. RNA was collected, and TaqMan qRT PCR was performed. C, Rat GH gene expression in WT GC cells treated with octreotide or vehicle (100 nM; daily for 3 consecutive days), after which RNA was collected and analyzed by TaqMan qRT PCR. D, Rat GH peptide levels measured by RIA in WT GC medium with or without octreotide (100 nM). ***, P < .001; ****, P < .0001. NT, not treated.
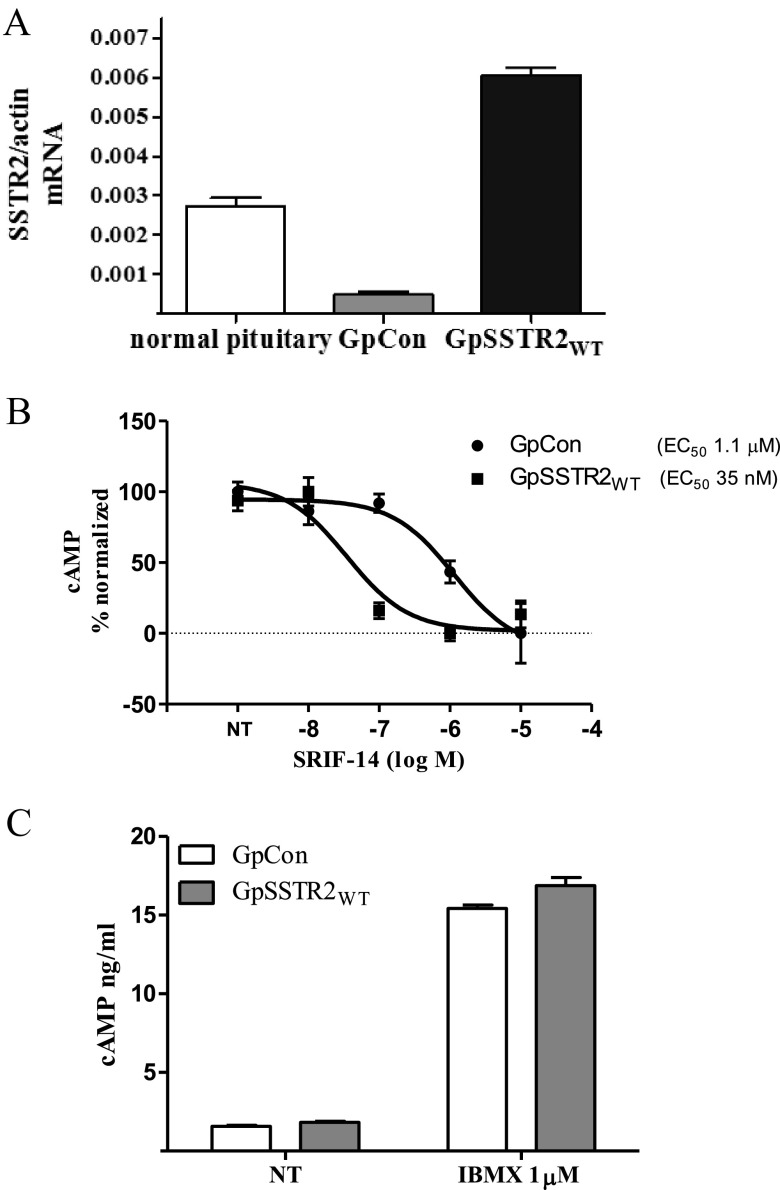
Stable polyclonal GC transfectants were sorted by fluorescence-activated cell sorting for similar low ZsGreen tag intensity. SSTR2WT mRNA in GpSSTR2WT cells was ∼10-fold higher than that in GpCon cells and ∼2-fold higher than that detected in 3 male rat normal pituitary glands (Figure 2A). Increased SSTR2WT expression also enhanced SRIF-14 potency to inhibit forskolin-stimulated intracellular cAMP levels (EC50 shifted from 1.1 μM in GpCon cells to 35 nM in GpSSTR2WT cells, P < .001) (Figure 2B). Baseline intracellular cAMP levels in cells treated with the phosphodiesterase inhibitor IBMX or not treated were similar for GpSSTR2WT and GpCon cells (Figure 2C).
Figure 2.
Characterization of stable GC transfectants for ligand-dependent and -independent SSTR2 function. A, SSTR2 mRNA expression in GpCon and GpSSTR2WT cells and pooled male rat pituitary glands (n = 3). Cells were plated for 48 hours after which RNA collected, and rat pituitary glands were harvested immediately after sacrifice and preserved in RNAlater. Samples were analyzed simultaneously using SSTR2 TaqMan qRT PCR assays. A human SSTR2 TaqMan assay that recognizes both rodent and human SSTR2 was used. B, SRIF inhibition of intracellular cAMP levels in GpCon and GpSSTR2WT cells cotreated with IBMX and forskolin (1 μM) in DMEM supplemented with 0.3% BSA for 30 min. C, Baseline intracellular cAMP in untreated and IBMX (1 mM)–treated in GpCon and GpSSTR2WT cells. Cells were then lysed for intracellular cAMP measurements with the LANCE cAMP assay kit. NT, not treated.
Constitutive SSTR2 activation inhibits GH synthesis
A moderate increase in SSTR2 expression in GpSSTR2WT cells reduced both rGH mRNA (Figure 3A) and hormone (Figure 3B) levels compared with that in GpCon cells. When inoculated into SCID mice, GpSSTR2 cells maintained suppressed tumor-derived rat GH levels. As expected, mouse serum IGF-I levels increased from 647 ± 17 ng/mL (n = 30) before cell inoculation (WT) to 814 ± 26 ng/mL in control GpCon tumor-harboring mice (n = 10). However, circulating IGF-I levels did not rise in 10 mice harboring GpSSTR2WT cell inoculants (674 ± 21 ng/mL) (Figure 3C).
Replacing arginine at position 140 with alanine in the hSSTR2 DRY motif abrogated the SSTR2WT inhibitory effect in GC cells. GH peptide (Figure 4A) and mRNA (Figure 4B) levels and transfected rat GH promoter activity (Figure 4C) were similar to those in GpCon cells and significantly higher than those in GpSSTR2WT cells. SSTR2DRY less potently (Figure 4D) and efficiently (Figure 4E) reduced intracellular cAMP levels in response to octreotide treatment. GpSSTR2DRY cells expressed SSTR2 mRNA 12-fold higher than that in GpCon cells (data not shown). However, the mutant retained the ability to internalize upon octreotide treatment (Figure 4F).
Figure 4.
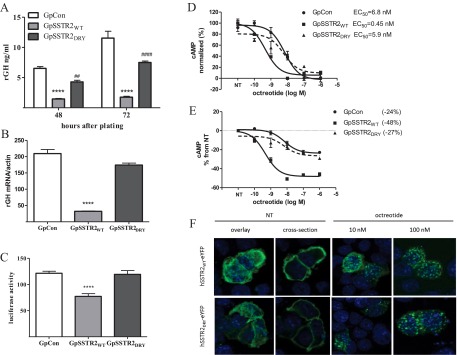
Effect of DRY motif mutation (R140A) on constitutive SSTR2 activity. A, Baseline medium GH levels 48 and 72 hours after plating. ****, P < .0001 compared with GpCon cells; ##, P < .01 and ####, P < .0001 compared with GpSSTR2WT cells. B, Baseline GH mRNA levels measured 48 hours after plating by a TaqMan gene expression assay. C, Luciferase activity measured 48 hours after transient transfection of rat GH promoter (−4192/+167) luciferase. D and E, Dose dependence of intracellular cAMP levels with increasing doses of octreotide in the 3 cell lines: octreotide potency (D) and octreotide efficacy (E). F, SSTR2WT-eYFP and SSTR2DRY-eYFP internalization. Cells were plated on coverslips 24 hours before transient transfection with either plasmid for 48 hours and then were treated with increasing doses of octreotide for 1 hour or not treated (NT). Cells were then washed, fixed, and visualized with a fluorescent confocal microscope. Green, eYFP; blue, DNA. ****, P < .0001 compared with GpCon cells.
SSTR2-associated histone deacetylation regulates GH inhibition
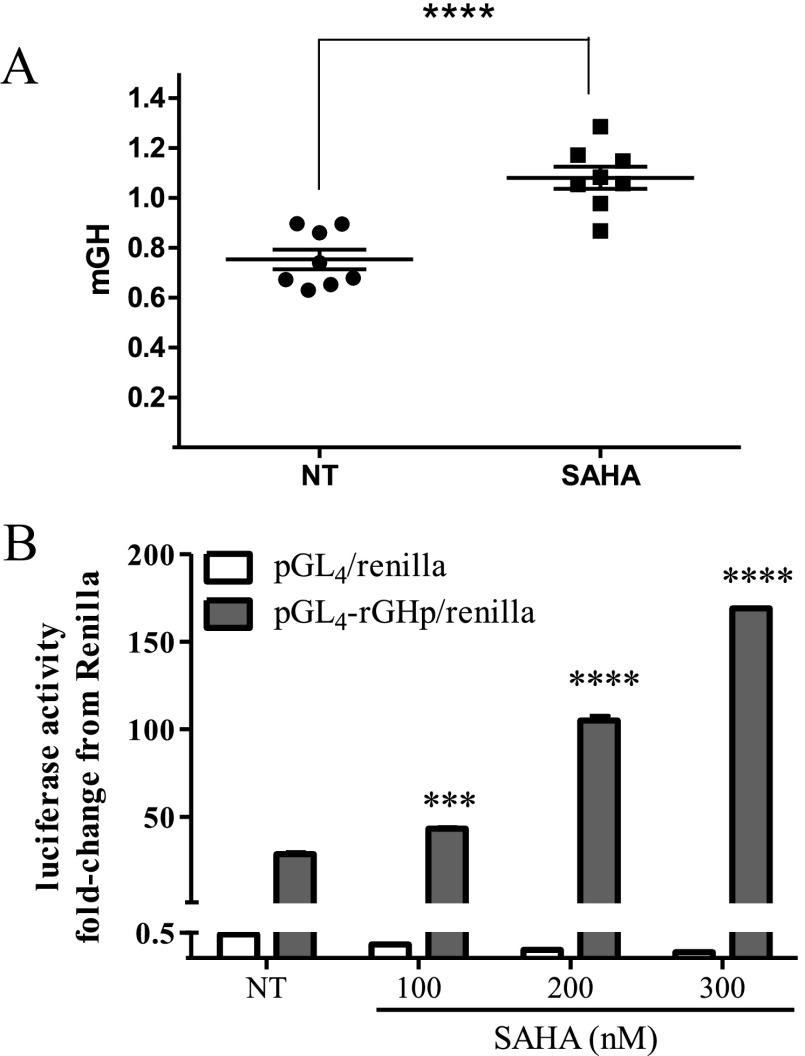
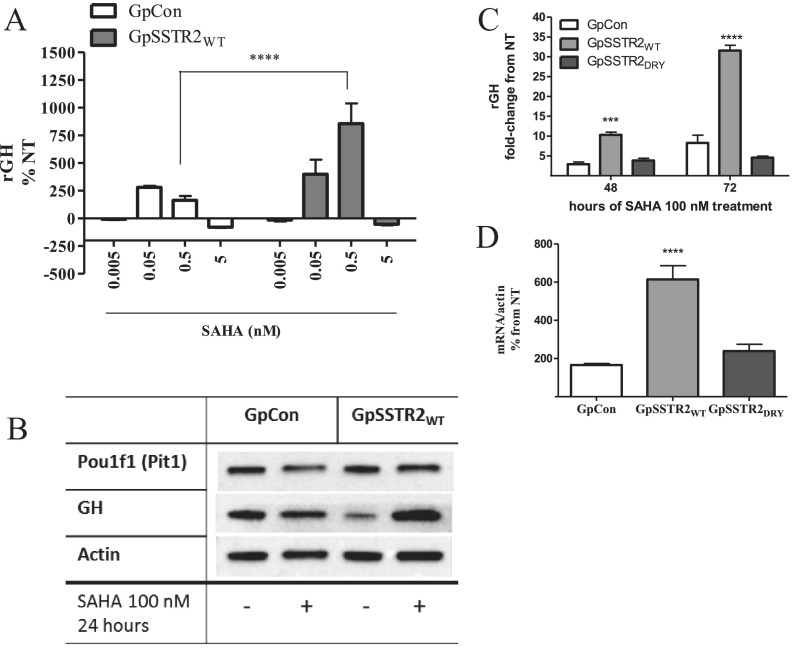
SAHA (100 nM for 48 hours), an inhibitor of histine deacetylase (HDAC) deacetylation, increased GH levels secreted by mouse pituitary somatotrophs in primary cultures (Figure 5A) and also enhanced rGH promoter activity (Figure 5B) in GC WT cells. In the stable transfectants, SAHA treatment increased rGH levels in GpSSTR2WT more than in GpCon cell cultures (Figure 6, A and B) without a concomitant increase in Pou1F1 (Pit-1) levels (Figure 6B). Because optimal and clinically relevant SAHA doses required to elicit an effect were between 50 and 500 nM (19), we chose to use 100 nM SAHA in our experiments. Unlike in GpSSTR2WT cells in which both GH peptide (Figure 6C) and GH mRNA (Figure 6D) levels were significantly increased by SAHA compared with those in GpCon cells, GpSSTR2DRY cells exhibited only modest GH increases (Figure 6, C and D), similar to those in GpCon cells.
Figure 5.
SAHA effects on somatotroph GH synthesis and secretion. A, Medium mouse GH (mGH) in primary mouse pituitary cultures treated with SAHA (100 nM) for 48 hours. B, Rat GH promoter luciferase activity with increasing SAHA concentration treatment for 48 hours in WT GC cells. ***, P < .001; ****, P < .0001 compared with not treated (NT).
Figure 6.
SAHA effects on GH synthesis and secretion in GpCon and GpSSTR2WT cells. A, SAHA (5–500 nM, for 48 hours) effects on GH levels in GpCon and GpSSTR2WT cell medium corrected to WST-1 measurement. B, Western blot analysis for GH and Pou1f1 (Pit-1) compared with actin in GpCon and GpSSTR2WT cells, treated with SAHA (100 nM) for 48 hours and compared with vehicle-treated cells (not treated [NT]). C, GpCon, GpSSTR2WT, and GpSSTR2DRY cells were treated with either SAHA (100 nM) or vehicle for 48 and 72 hours, medium GH levels were measured by RIA, and results are presented as fold change from GH levels in matched vehicle-treated cells (NT). D, Rat GH mRNA levels in GpCon, GpSSTR2WT, and GpSSTR2DRY cells, 48 hours after SAHA (100 nM) or vehicle treatment. Cells were lysed, RNA was extracted, and GH mRNA levels were measured by TaqMan gene expression assays. Results are presented as percentage of change from vehicle-treated cells (NT). ****, P < .0001 compared with GpCon cells.
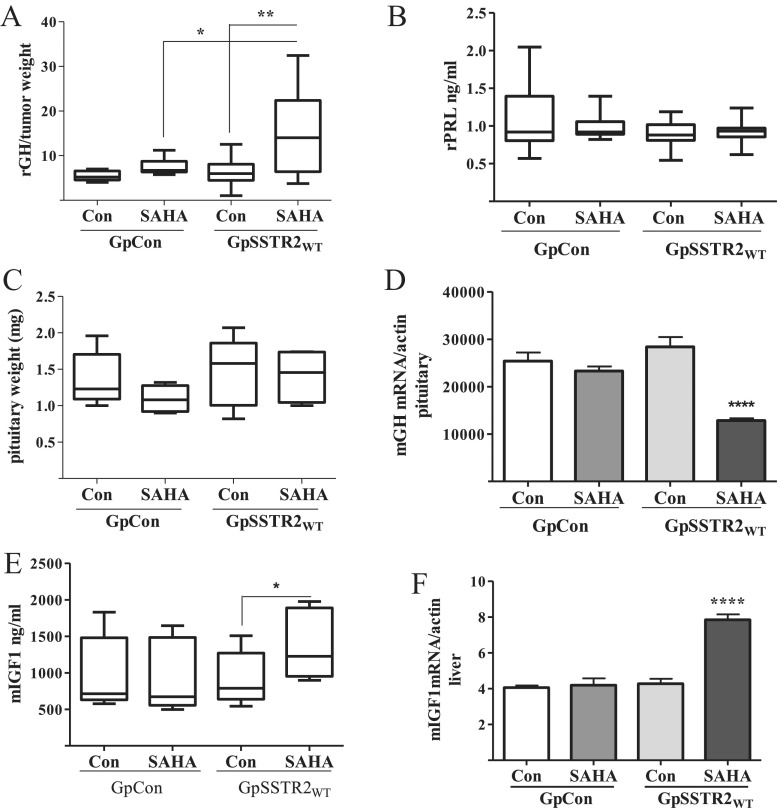
In vivo SAHA also increased GH synthesis in GpSSTR2WT xenografts more than in GpCon tumors. Male SCID mice harboring GpSSTR2WT tumors and treated with SAHA (100 mg/kg) exhibited high tumor-derived serum rGH levels, corrected for tumor weight (Figure 7A), whereas rPRL levels were low and remained unchanged (Figure 7B). Although pituitary gland weight was unchanged (n = 5 per group) (Figure 7C), endogenous pituitary mouse GH gene expression was reduced, probably reflecting GH/IGF-I negative feedback (Figure 7D). Consistent with higher circulating rGH levels, GpSSTR2WT tumor-harboring SCID mice showed increased serum mouse IGF-I levels (Figure 7E) and increased liver mouse IGF-I gene expression (Figure 7F).
Figure 7.
In vivo GpCon and GpSSTR2WT tumor-harboring SCID mouse responses to SAHA. A, Tumor-derived rGH level corrected to tumor weight (nanograms per milliliter per milligram; n = 10 per group). B, Serum rPRL levels (nanograms per milliliter; n = 10 per group). C, Pituitary weight (milligrams; n = 5 pre group). D, Mouse pituitary GH (mGH) mRNA corrected for actin mRNA (n = 5 per group). E, Mouse serum IGF-I (mIGF1) levels (nanograms per milliliter; n = 10 per group). F, Mouse liver IGF-I mRNA corrected for actin mRNA (n = 5 per group). Two-month-old male SCID mice were assigned to 2 groups of 20 mice per group: mice harboring sc GpCon and those with GpSSTR2WT tumors. Seven days after tumor cell inoculation, mice in each group were further divided to 2 subgroups of mice treated either with SAHA (100 mg/kg) or vehicle (Con; DMSO 5%) twice weekly for 2 weeks. Blood, liver, pituitary, and tumor tissue were collected for analysis. Rat GH and PRL levels were measured by RIA, and mouse IGF-I measured by ELISA and qRT PCR by TaqMan assays. *, P < .05; **, P < .01; ****, P < .0001.
Hypoacetylation was observed at H3K9 in GpSSTR2WT cells at baseline compared with that in GpCon cells (P < .05) using primer sets for detection of H3K9 acetyl on the 5-kb 5′-region of rGH promoter (Figure 8, A and B). However, enhanced acetyl enrichment was observed after SAHA (100 nM) treatment in GpSSTR2WT cells compared with that in GpCon cells (3.8 ± 0.8- and 1.3 ± 0.2-fold enrichment vs no treatment, respectively, P < .0001 for GpSSTR2WT cells) (Figure 8B). GH promoter H3K9 acetylation intensity in GpSSTR2DRY cells was similar to that observed for GpCon (Figure 8C). Similarly to cells with increased SSTR2 expression, WT GC cells treated with octreotide (1 μM daily, 72 hours) exhibited decreased rGH promoter H3K9 acetylation compared with that in untreated cells with the rGHp4 and rGHp5 primer sets (Figure 8D).
Discussion
We present evidence that SSTR2 at moderately overexpressed levels, when acting in a ligand-free environment and in isolation from other SSTR subtypes, selectively inhibits rGH synthesis in GH-secreting GC cells. This effect is partly mediated by histone deacetylation at H3K9 at the rGH promoter. These signaling effects derive from constitutive SSTR2 activity independent of SRIF and are prevented by selective arginine (R140A) mutation of the SSTR2 DRY motif. We also present evidence suggesting that octreotide may signal similarly to suppress GH synthesis through SSTR2.
We analyzed SSTR2 effects on GH synthesis by studying GC cells expressing SSTR2 mRNA exclusively and not the other SSTR subtypes as measured by a highly sensitive and specific TaqMan assay. These cells were previously reported to express several SSTRs; however, the earlier studies relied on less specific and less sensitive radiolabeled agonist binding in GC cells grown in a different serum-enriched medium (27–29). The unique combination of a GH-secreting cell expressing SSTR2 exclusively allowed accurate analysis of SSTR2 effects on GH production.
Modest overexpression of SSTR2 was representative of normal rat pituitary SSTR2 levels and therefore was chosen for further analysis. Increased SSTR2 expression in ligand-free GpSSTR2WT independently inhibited GH synthesis as observed by reduced exogenous rGH promoter activity and reduced GH mRNA and protein abundance, indicating that SSTR2, even in the absence of ligand, attenuates baseline GH synthesis. The cell-specific GH level was maintained in vivo because rat tumor–derived GH increased circulating IGF-I levels in GpCon but not in GpSSTR2WT tumor-bearing mice. Although our observations in vivo cannot be interpreted to result from constitutive SSTR2 activity because these mice probably have intact SRIF expression, these results affirm that numbers of SSTR2s determines baseline GH production.
To further establish the role of constitutive SSTR2 activity in regulating GH synthesis, we mutated the receptor at the DRY motif, a site known to participate in GPCR stabilization, by replacing arginine with alanine at position 140, and created GpSSTR2DRY stable GC transfectant cells. This mutation is known to inhibit constitutive activity in some class A GPCRs (21). Indeed, GpSSTR2DRY cells did not elicit significant GH inhibition as was observed in GpSSTR2WT cells and exhibited GH mRNA, peptide, and GH promoter activity similar to those in GpCon cells, further supporting the link between constitutive SSTR2 activity and GH inhibition.
To gain further insights into molecular mechanisms involved in constitutive SSTR2 inhibition of GH synthesis and in light of earlier studies showing that histone acetylation regulates the human GH promoter (30–32), we explored whether constitutive SSTR2 activity may promote rat GH promoter deacetylation and silencing as a mechanism to reduce rGH synthesis. For this purpose, we used SAHA, which selectively inhibits HDACs that catalyze acetyl group removal from lysine side chains of nucleosomal core histone amino-terminal tails (33, 34). SAHA, therefore, enables accumulation of acetylated histones and nonhistone proteins, rendering chromatin transcriptionally active (35, 36).
We show here that SAHA increases rGH promoter activity and GH synthesis, both in WT GC cells and in primary mouse pituitary cell cultures, suggesting that histone acetylation also mediates rodent GH synthesis as has been shown for dopamine receptor subtype 2–related deacetylation of the PRL promoter (19). Notably, we show that the endogenous GH promoter in GpSSTR2WT cells exhibits lower H3K9 acetylation at baseline (supporting reduced transcriptional activity) with exacerbated “rebound” acetylation after SAHA treatment compared with that in both GpCon and GpSSTR2DRY cells (possibly reflecting higher levels of transcriptional activity). Accordingly, GpSSTR2WT cells also exhibited higher levels of GH mRNA and peptide after SAHA treatment than those in either GpCon or GpSSTR2DRY cells. Based on these results, we propose that constitutive SSTR2 activity acts partly to deacetylate the GH promoter, thereby restraining its activity and suppressing GH gene synthesis. HDAC inhibition relieves SSTR2-related increased deacetylation tone on the GH promoter in GpSSTR2WT cells, allowing for rebound GH synthesis.
The deacetylation effect of SSTR2 on the rat GH promoter in GpSSTR2 WT cells also appears to be maintained in vivo, when either GpCon or GpSSTR2 WT cells were inoculated sc, and mice were later treated with SAHA. Confirming our in vitro results, SAHA-treated GpSSTR2 WT tumor-harboring mice had higher circulating rGH levels than vehicle-treated GpSSTR2 WT or GpCon tumors, whether treated with SAHA or not treated. rGH was sufficiently increased to induce mouse liver IGF-I production and, in a negative feedback loop (37), to inhibit endogenous mouse pituitary GH mRNA. Although probably not attributed to constitutive SSTR2 activity because SSTR2 ligands may be present at the inoculation site, these results support the notion that SSTR2 receptor number also determines GH promoter deacetylation in vivo.
Whether long-term treatment of patients harboring GH-secreting adenomas with SSTR2 agonists also deacetylates the GH promoter to reduce GH synthesis is an important clinical question, albeit challenging to study. Because GH-secreting tumors obtained from patients while being successfully treated with SRIF analogs are not commonly available, large amounts of fresh cells are required to perform ChIP analysis, and immunohistochemistry studies for human pituitary HDACs and H3K9 acetylation patterns are not specific to the GH promoter but reflect general genomic events. Long-term exposure to SRIF and clinically available SRIF agonists up-regulates SSTR2 expression in vitro (38) and in vivo (39), probably increasing numbers of SSTR2s and constitutive activity. Therefore, such long-term treatment may result in GH promoter deacetylation and attenuation of GH transcription, similar to the observation reported here for constitutive rat SSTR2 activity. Indeed, ChIP analysis showed the endogenous GC cell rGH promoter H3K9 to be less acetylated after octreotide treatment, supporting the role of the ligand in epigenetic regulation of the rGH promoter.
The pathway by which constitutive SSTR2 activity maintains the rGH promoter in a deacetylated state is as yet elusive and requires further investigation. The SSTR2DRY mutation, which reduced constitutive SSTR2 activity in GC cells, was associated with attenuated adenylate cyclase response to octreotide compared with that of SSTR2WT, suggesting cAMP as a potential mediator. However, intracellular baseline cAMP levels were not altered by SSTR2WT expression levels. Nevertheless, cAMP involvement cannot be excluded, because measurement of the low baseline cAMP changes induced by constitutive receptor activity could be technically challenging. In addition, SAHA is not specific for the GH promoter but rather is associated with activation or deactivation of 2% to 10% of genes (35, 36, 40), some of which may also participate in promoting GH synthesis. Although in our study, Pou1F1 levels were not decreased at baseline nor were they increased after SAHA treatment of GpSSTR2WT cells, analysis of GH promoter chromatin binding for each of the transcription factors involved in GH transcription would probably be required. Overall, our findings that GpSSTR2WT cells exhibit decreased baseline GH peptide, mRNA, and GH promoter activity and decreased baseline GH promoter acetylation with a robust response to acetylation together strongly suggest higher deacetylation tone in cells overexpressing SSTR2, thereby enabling ligand-free SSTR2 suppression of GH synthesis.
These results show that increased constitutive SSTR2 activity in vitro and SSTR2 expression in vivo lead to attenuated GH synthesis in GC cells, at least in part by GH promoter deacetylation. This observation may play an important physiological role in somatotroph regulation of baseline GH production.
Acknowledgments
Disclosure Summary: A.B.-S. and S.M. are recipients of an investigator-initiated preclinical grant from Novartis supported by National Institutes of Health grant CA75979. The other authors have nothing to disclose.
Footnotes
- ChIP
- chromatin immunoprecipitation
- DMSO
- 3-isobutyl-1-methyxanthine
- eYFP
- enhanced yellow fluorescent protein
- GPCR
- G protein–coupled receptor
- h
- human
- HDAC
- histone deacetylase
- IBMX
- 3-isobutyl-1-methyxanthine
- PRL
- prolactin
- r
- recombinant
- qRT
- quantitative real-time
- SAHA
- suberoylanilide hydroxamic acid
- SSTR
- somatostatin receptor
- WT
- wild type.
References
- 1. Smit MJ, Vischer HF, Bakker RA, et al. Pharmacogenomic and structural analysis of constitutive G protein-coupled receptor activity. Annu Rev Pharmacol Toxicol. 2007;47:53–87 [DOI] [PubMed] [Google Scholar]
- 2. Seifert R, Wenzel-Seifert K. Constitutive activity of G-protein-coupled receptors: cause of disease and common property of wild-type receptors. Naunyn Schmiedebergs Arch Pharmacol. 2002;366:381–416 [DOI] [PubMed] [Google Scholar]
- 3. Conn PM, ed. Constitutive Activity in Receptors and Other Proteins, Part A. New York, NY: Academic Press; 2010. Methods in Enzymology, vol 484 [Google Scholar]
- 4. Ben-Shlomo A, Pichurin O, Barshop NJ, et al. Selective regulation of somatostatin receptor subtype signaling: evidence for constitutive receptor activation. Mol Endocrinol. 2007;21:2565–2578 [DOI] [PubMed] [Google Scholar]
- 5. Ben-Shlomo A, Zhou C, Pichurin O, et al. Constitutive somatostatin receptor activity determines tonic pituitary cell response. Mol Endocrinol. 2009;23:337–348 [DOI] [PMC free article] [PubMed] [Google Scholar]
- 6. Patel YC. Somatostatin and its receptor family. Front Neuroendocrinol. 1999;20:157–198 [DOI] [PubMed] [Google Scholar]
- 7. Weckbecker G, Lewis I, Albert R, Schmid HA, Hoyer D, Bruns C. Opportunities in somatostatin research: biological, chemical and therapeutic aspects. Nat Rev Drug Discov. 2003;2:999–1017 [DOI] [PubMed] [Google Scholar]
- 8. Ben-Shlomo A, Melmed S. Pituitary somatostatin receptor signaling. Trends Endocrinol Metab. 2010;21:123–133 [DOI] [PMC free article] [PubMed] [Google Scholar]
- 9. Tuggle CK, Trenkle A. Control of growth hormone synthesis. Domest Anim Endocrinol. 1996;13:1–33 [DOI] [PubMed] [Google Scholar]
- 10. Tanner JW, Davis SK, McArthur NH, French JT, Welsh TH., Jr Modulation of growth hormone (GH) secretion and GH mRNA levels by GH-releasing factor, somatostatin and secretagogues in cultured bovine adenohypophysial cells. J Endocrinol. 1990;125:109–115 [DOI] [PubMed] [Google Scholar]
- 11. Acunzo J, Thirion S, Roche C, et al. Somatostatin receptor sst2 decreases cell viability and hormonal hypersecretion and reverses octreotide resistance of human pituitary adenomas. Cancer Res. 2008;68:10163–10170 [DOI] [PubMed] [Google Scholar]
- 12. Grant M, Kumar U. The role of G-proteins in the dimerisation of human somatostatin receptor types 2 and 5. Regul Pept. 2010;159:3–8 [DOI] [PubMed] [Google Scholar]
- 13. Barinaga M, Bilezikjian LM, Vale WW, Rosenfeld MG, Evans RM. Independent effects of growth hormone releasing factor on growth hormone release and gene transcription. Nature. 1985;314:279–281 [DOI] [PubMed] [Google Scholar]
- 14. Theill LE, Karin M. Transcriptional control of GH expression and anterior pituitary development. Endocr Rev. 1993;14:670–689 [DOI] [PubMed] [Google Scholar]
- 15. Frohman LA, Kineman RD. Growth hormone-releasing hormone and pituitary development, hyperplasia and tumorigenesis. Trends Endocrinol Metab. 2002;13:299–303 [DOI] [PubMed] [Google Scholar]
- 16. Gong FY, Shi YF, Deng JY. The regulatory mechanism by which interleukin-6 stimulates GH-gene expression in rat GH3 cells. J Endocrinol. 2006;190:397–406 [DOI] [PubMed] [Google Scholar]
- 17. Romano D, Magalon K, Pertuit M, et al. Conditional overexpression of the wild-type Gsα as the gsp oncogene initiates chronic extracellularly regulated kinase 1/2 activation and hormone hypersecretion in pituitary cell lines. Endocrinology. 2007;148:2973–2983 [DOI] [PubMed] [Google Scholar]
- 18. Ho Y, Elefant F, Cooke N, Liebhaber S. A defined locus control region determinant links chromatin domain acetylation with long-range gene activation. Mol Cell. 2002;9:291–302 [DOI] [PubMed] [Google Scholar]
- 19. Liu JC, Baker RE, Chow W, Sun CK, Elsholtz HP. Epigenetic mechanisms in the dopamine D2 receptor-dependent inhibition of the prolactin gene. Mol Endocrinol. 2005;19:1904–1917 [DOI] [PubMed] [Google Scholar]
- 20. Ben-Shlomo A, Wawrowsky K, Melmed S. Constitutive activity of somatostatin receptor subtypes. Methods Enzymol. 2010;484:149–164 [DOI] [PubMed] [Google Scholar]
- 21. Rovati GE, Capra V, Neubig RR. The highly conserved DRY motif of class A G protein-coupled receptors: beyond the ground state. Mol Pharmacol. 2007;71:959–964 [DOI] [PubMed] [Google Scholar]
- 22. Panetta R, Greenwood MT, Warszynska A, et al. Molecular cloning, functional characterization, and chromosomal localization of a human somatostatin receptor (somatostatin receptor type 5) with preferential affinity for somatostatin-28. Mol Pharmacol. 1994;45:417–427 [PubMed] [Google Scholar]
- 23. Ben-Shlomo A, Wawrowsky KA, Proekt I, et al. Somatostatin receptor type 5 modulates somatostatin receptor type 2 regulation of adrenocorticotropin secretion. J Biol Chem. 2005;280:24011–24021 [DOI] [PubMed] [Google Scholar]
- 24. Vlotides G, Siegel E, Donangelo I, Gutman S, Ren SG, Melmed S. Rat prolactinoma cell growth regulation by epidermal growth factor receptor ligands. Cancer Res. 2008;68:6377–6386 [DOI] [PMC free article] [PubMed] [Google Scholar]
- 25. Sakajiri S, Kumagai T, Kawamata N, Saitoh T, Said JW, Koeffler HP. Histone deacetylase inhibitors profoundly decrease proliferation of human lymphoid cancer cell lines. Exp Hematol. 2005;33:53–61 [DOI] [PubMed] [Google Scholar]
- 26. Modesitt SC, Parsons SJ. In vitro and in vivo histone deacetylase inhibitor therapy with vorinostat and paclitaxel in ovarian cancer models: does timing matter? Gynecol Oncol. 2010;119:351–357 [DOI] [PubMed] [Google Scholar]
- 27. Mounier F, Bluet-Pajot MT, Viollet C, et al. Effects of chronic octreotide treatment on GH secretory dynamics and tumor growth in rats bearing an ectopic somatotroph (GC) tumor. J Neuroendocrinol. 1995;7:645–651 [DOI] [PubMed] [Google Scholar]
- 28. Cervia D, Petrucci C, Bluet-Pajot MT, Epelbaum J, Bagnoli P. Inhibitory control of growth hormone secretion by somatostatin in rat pituitary GC cells: sst2 but not sst1 receptors are coupled to inhibition of single-cell intracellular free calcium concentrations. Neuroendocrinology. 2002;76:99–110 [DOI] [PubMed] [Google Scholar]
- 29. Cervia D, Zizzari P, Pavan B, et al. Biological activity of somatostatin receptors in GC rat tumour somatotrophs: evidence with sst1-sst5 receptor-selective nonpeptidyl agonists. Neuropharmacology. 2003;44:672–685 [DOI] [PubMed] [Google Scholar]
- 30. Ho Y, Elefant F, Liebhaber SA, Cooke NE. Locus control region transcription plays an active role in long-range gene activation. Mol Cell. 2006;23:365–375 [DOI] [PubMed] [Google Scholar]
- 31. Hunsaker TL, Jefferson HS, Morrison JK, Franklin AJ, Shewchuk BM. POU1F1-mediated activation of hGH-N by deoxyribonuclease I hypersensitive site II of the human growth hormone locus control region. J Mol Biol. 2012;415:29–45 [DOI] [PubMed] [Google Scholar]
- 32. Ho Y, Liebhaber SA, Cooke NE. The role of the hGH locus control region in somatotrope restriction of hGH-N gene expression. Mol Endocrinol. 2011;25:877–884 [DOI] [PMC free article] [PubMed] [Google Scholar]
- 33. Grunstein M. Histone acetylation in chromatin structure and transcription. Nature. 1997;389:349–352 [DOI] [PubMed] [Google Scholar]
- 34. Lafon-Hughes L, Di Tomaso MV, Méndez-Acuña L, Martinez-Lopez W. Chromatin-remodelling mechanisms in cancer. Mutat Res. 2008;658:191–214 [DOI] [PubMed] [Google Scholar]
- 35. Marks PA. Discovery and development of SAHA as an anticancer agent. Oncogene. 2007;26:1351–1356 [DOI] [PubMed] [Google Scholar]
- 36. Hagelkruys A, Sawicka A, Rennmayr M, Seiser C. The biology of HDAC in cancer: the nuclear and epigenetic components. Handb Exp Pharmacol. 2011;206:13–37 [DOI] [PubMed] [Google Scholar]
- 37. Yamashita S, Slanina S, Kado H, Melmed S. Autoregulation of pituitary growth hormone messenger ribonucleic acid levels in rats bearing transplantable mammosomatotrophic pituitary tumors. Endocrinology. 1986;118:915–918 [DOI] [PubMed] [Google Scholar]
- 38. Ben-Shlomo A, Schmid H, Wawrowsky K, et al. Differential ligand-mediated pituitary somatostatin receptor subtype signaling: implications for corticotroph tumor therapy. J Clin Endocrinol Metab. 2009;94:4342–4350 [DOI] [PubMed] [Google Scholar]
- 39. Tannenbaum GS, Turner J, Guo F, Videau C, Epelbaum J, Beaudet A. Homologous upregulation of sst2 somatostatin receptor expression in the rat arcuate nucleus in vivo. Neuroendocrinology. 2001;74:33–42 [DOI] [PubMed] [Google Scholar]
- 40. Kelly WK, Marks PA. Drug insight: histone deacetylase inhibitors—development of the new targeted anticancer agent suberoylanilide hydroxamic acid. Nat Clin Pract Oncol. 2005;2:150–157 [DOI] [PubMed] [Google Scholar]


