

Abstract
The mechanics of bio-artificial tissue constructs result from active and passive contributions of cells and extracellular matrix (ECM). We delineated these for a fibroblast-populated matrix (FPM) consisting of chick embryo fibroblast cells in a type I collagen ECM through mechanical testing, mechanical modeling, and selective biochemical elimination of tissue components. From a series of relaxation tests, we found that contributions to overall tissue mechanics from both cells and ECM increase exponentially with the cell concentration. The force responses in these relaxation tests exhibited a logarithmic decay over the 3600 second test duration. The amplitudes of these responses were nearly linear with the amplitude of the applied stretch. The active component of cellular forces rose dramatically for FPMs containing higher cell concentrations.
Keywords: constitutive modeling, matrix mechanics, cell mechanics
1. Introduction
Bioartificial tissue constructs provide a realistic mechanical and biochemical environment in which to study cellular and extracellular matrix (ECM) mechanics.1,10 The overall mechanics of a tissue construct derives from the mechanics of cells and ECM, and from the details of the structural networks they form. The mechanics and nature of this structural network changes as cells remodel the collagen ECM,19 as cells connect to one another,11,12 and as cells remodel their actin cytoskeletons in response to external stimuli.21,22 The ways that the components of the structural network share stresses supported by a tissue are functions of the mechanical properties of cells and ECM.11,12 These vary with the degree20 and rate13 with which the construct is stretched. We hypothesized that they also vary with the number of cells per unit volume (the “cell concentration”) in a tissue construct after remodeling.
The effects of ECM remodeling and cell concentration on tissue mechanics are physiologically important when studying the wound healing process, in which fibroblasts synthesize and remodel collagen, and simultaneously close the wound boundaries.4,7,17,9 However, the ways that ECM remodeling and increases in cell concentration change the mechanical properties of a wound are not well characterized quantitatively. Through the approaches presented in this paper, we use tissue constructs as models to study this problem.
The goal of this work was to establish a relationship between the cell concentration and the mechanical properties of both cells and ECM in bio-artificial tissue constructs. Since the tissue constructs we studied were, like biological tissues, viscoelastic,6 mechanical properties were derived from the response to a rapid stretch. Tests were interpreted through a logarithmic relaxation model, allowing active and passive contributions of cells and ECM to overall tissue mechanics to be studied as a function of cell concentration.
2. Methods
2.1. Cell and tissue culture
The protocols used to synthesize ring-shaped fibroblast-populated matrix specimens (FPMs) followed those reported by Wakatsuki, et al.20 Briefly, monomeric type I rat tail collagen solubilized in 0.02 M acetic acid (Upstate Biotechnology Inc., Lake Placid, NY) was neutralized at 4°C with 0.1 M NaOH and mixed with concentrated DMEM stock to yield a final collagen content of 1mg/ml. Chicken embryo fibroblasts isolated from 11-day old chicken embryos (Spafas Inc., Preston, CT) were maintained in Dulbecco’s modified Eagle’s medium (DMEM) supplemented with 10% fetal calf serum (FCS), penicillin at 50 units/ml, and streptomycin at 50 μg/ml. The fibroblasts, suspended in 10% FCS DMEM, were mixed with the collagen solution; the cell suspension was poured into annular Teflon wells, and incubated at 37°C with 5% CO2. The collagen polymerized within 20–30 min and fibroblasts were captured within the hydrated collagen gel. The collagen gel formed a ring (3 mm thick, 1 cm inner diameter) between a central and an outer cylinder of the annular well. While in culture the cells compressed this ring, reducing the volume of the FPM.
2.2. Mechanical measurements
After three days of incubation, each FPM was removed from the mold and submerged in 50 ml of Hepes-buffered DMEM (pH 7.4) with 3% bovine serum in a 37°C organ bath (Harvard Apparatus, South Natick, MA) for mechanical testing. A nominally identical specimen was placed in an identical 37°C organ bath containing 50 ml of 0.05% w/v deoxycholate in PBS (pH 7.4) for 40 minutes prior to testing. At this level of exposure, deoxycholate eliminates the cellular contribution from the FPM response, but does not affect of the mechanical properties of the ECM.14
Each FPM or ECM ring was looped over a triangular hook connected to a force transducer (model 52-9545, Harvard Apparatus, South Natick, MA), and over a horizontal bar whose displacement was prescribed by a stepper motor (P/N 1-19-3400 24V DC 1.8° step size, Haward Industry, St. Louis, MO.) The two horizontal bars over which the specimen was looped were initially set to hold specimens at a contour length corresponding to half of the circumference of the central cylinder of the mold. Using the motor specimens were preconditioned with a stretch of 10% over 150 sec and unstretched to their original length at this same rate. Afterwards, specimens rapidly stretched (in about 10 ms) to a total of 22% in four increments (nominal strains of ε=0.02, 0.08, 0.15, and 0.22, where ε is the ratio of the axial displacement of the specimen to its initial length of the specimen). After each increment, isometric tension in the specimens was monitored for 3600 sec. The isometric force-sampling rate was set at 200 Hz for the first 160 sec and then reduced to 5 Hz.
2.3. Measurement of width and thickness
After testing, specimens were laid flat on a Petri dish containing PBS and width was measured from a calibrated digital photograph. Afterwards, specimens were mounted between parallel metal bars of 2 mm diameter in this same Petri dish. These bars were separated until slack was just removed from specimens. The Petri dish was mounted on an optical microscope, and the thickness was measured by comparison to a length scale. The accuracy of the measurements was better than ±1.7%.
2.4. Measurement of cell concentration
We assessed the final cell concentration using a total DNA quantification assay. After their physical dimensions were measured, FPMs were centrifuged in capped tubes containing 2 ml of PBS. Afterwards, the PBS was removed, leaving the gels undisturbed. 1 ml of lysis buffer (0.1% w/v SDS in PBS) was added to each tube and the tubes were sonicated. Then, 30 μl of sample was mixed with 3ml of Hoechst solution (30 nM of Hoechst 33258 per ml of PBS). The fluorescence of these solutions was read at 346 nm excitation max and 460 nm emission max. Cell counts were obtained through comparison to fluorescence of known cell numbers. Cell concentration was obtained by dividing the total number of cells by the overall FPM volume.
2.5. Stiffness of FPM and ECM
Small-strain instantaneous secant moduli8 were calculated from the force responses f(t) to rapid stretching using:
| (1) |
where A is the initial cross-sectional area of a specimen, and ε is the nominal strain in the direction of stretching.
Based on experimental observations, a logarithmic law was used to describe f(t):
| (2a) |
where to is an arbitrary constant. Note that this is equivalent to a response in which the time scales are uniformly repeated, meaning that to does not have a physical meaning as a time constant:
| (2b) |
where:
| (2c) |
and M and N are large integers. The approximation in Eq. 2b (accurate over approximately e−M<t<eN-2) describes the exponentially decaying nature of the relaxation. The physical interpretation of a is the force at t/to=1, and b represents the amplitude of the exponential decay. Only a and b are free parameters: the choice of to is constrained by the definition of a. to was chosen as 1 sec, meaning that a was defined as the force when t = 1 sec.
For a particular cell concentration, the parameters a and b vary almost linearly with strain:
| (3) |
and
| (4) |
where ao, a1, and b1 are constants that must be determined experimentally and O(ε2) is a high order dependency not significant at the strain levels in our tests. ao represents the strain-independent forces, including an active contribution due to cell contraction, which Wakatsuki et al.20 observed to be independent of strain. The passive responses of the FPMs were found by neglecting this coefficient using the instantaneous secant modulus, E:
| (5) |
The short-term secant modulus, Es, was defined for t=0.01 sec and the long-term modulus, El, for t=3600 sec. Thus, Es=(a1−4.6b1)/A and El =(a1+8.2b1)/A. The active stress contribution, σ0, was calculated by:
| (6) |
3. Results
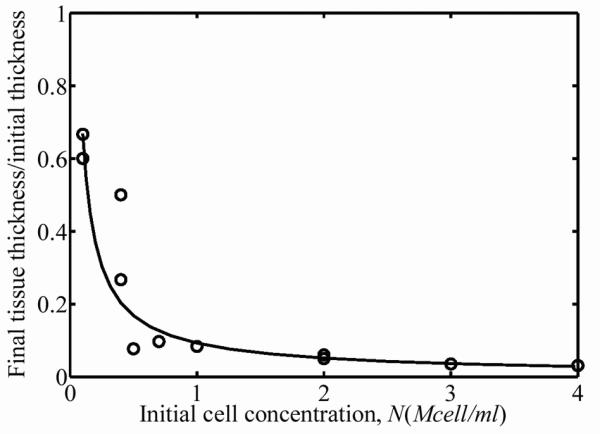
Over the three-day incubation, cells remodeled the ECM, resulting in compression of the FPMs around the central cylinders of the molds. A nonlinear relationship between the starting cell concentration and the cell concentration after three days of culture was found in the 15 FPMs studied. The thickness and width of the FPMs compressed an amount that was related to initial cell concentration (Fig. 1a and 1b). The effect of initial cell concentration on FPM compression was low for initial cell concentrations below 1×10⁵ cells per ml of collagen solution. The final cell concentrations in the FPMs increased more than an order of magnitude when the starting cell concentration was on the order of 4×10⁶ cells per ml of collagen (Fig. 2a). The dashed line in Fig. 2a corresponds to the “percolation threshold”, which is the cell concentration needed for formation of a steric network of randomly oriented cells in the final morphology of the FPM.11,12 Cells were spindle-shaped at all cell concentrations with an average cell length of l=100±15μm and an average cell diameter of 10±1μm; these gross dimensions did not change measurably with cell volume fraction. Although the final cell concentration increased monotonically with increasing initial cell concentration, the total number of living cells in the population actually dropped during incubation for initial cell concentrations above 1 million cells per ml of collagen solution (Fig. 2b.) The dashed line in Fig. 2b represents no change in the cell number after incubation; values above this line indicate an increase in the number of cells, while values below this indicate a decreasing number of cells.
Figure 1.
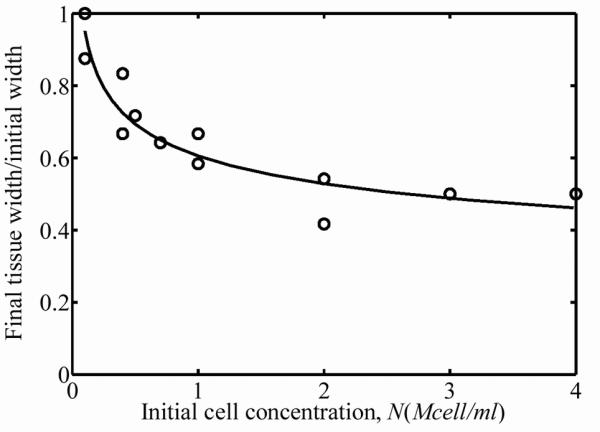
(a) FPM width and (b) FPM thickness decreased after three days of incubation. The circles correspond to the experimental variation of FPM width as the initial cell concentration varied.
Figure 2.
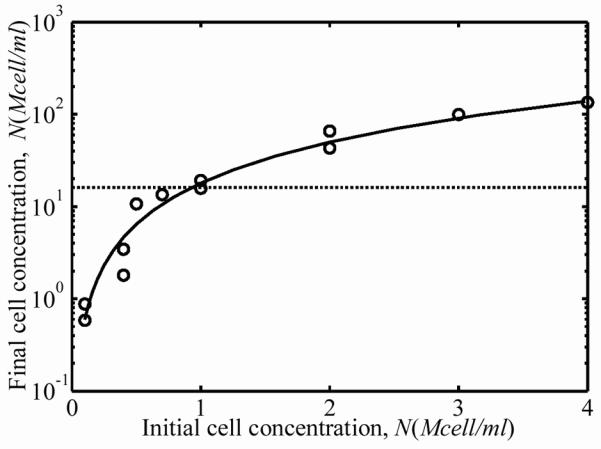
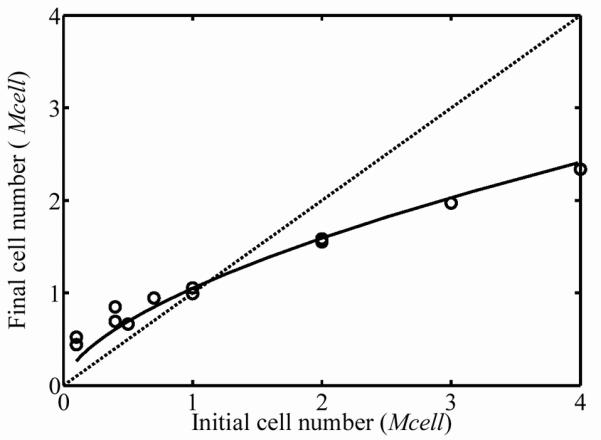
(a) Cellular concentration after three days of incubation increased monotonically with starting cell concentration. The dashed line is the concentration at which cells are predicted to form a contiguous, steric network. (b) The dashed line in Fig. 2b represents no change in the cell number after incubation; values above this line indicate an increase in the number of cells, while values below this indicate a decreasing number of cells, as was the case for FPMs beginning with very high cell concentrations.
Typical force relaxation data for the FPMs when stretched rapidly and held for 3600 sec exhibited a constant force for 0.01 sec after the jump, followed by a logarithmic relaxation as in Eq. 2 (Fig. 3.) The noise-to-signal ratio for the force was less than 4% in all cases. ECM specimens tested after immersion of FPMs in a deoxycholate bath behaved in a qualitatively similar fashion, but with lower overall force magnitude.
Figure 3.
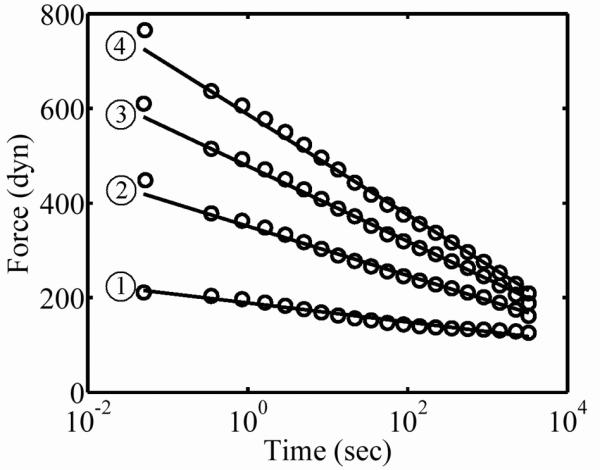
Typical logarithmic relaxation response of a FPM subjected to a rapid stretch. The sample shown had a final cell concentration of 10.7 Mcell/ml and was tested in DMEM at strain levels ε=0.02, 0.08, 0.15, and 0.22, from (1) through (4), respectively. The standard deviation of the data shown did not exceed the size of the circles, and was 4, 8, 12 and 16 dynes, for (1) through (4), respectively.
The coefficients a and b of the force relaxation given by Eq. 2 increased almost linearly with the strain after the jump stretch (Figs. 4 and 5 show values for a cell concentration in the middle range of those studied). The dashed lines in Figs. 4 and 5 corresponding to FPMs immersed in deoxycholate show that elimination of the cells yields a great decrease in the force response due to the high cell contribution to tissue mechanics at these concentrations. The force responses over the very large range of stretch amplitudes were nearly linear. Coefficients a1 and b1 were nearly proportional for all strains: a1/b1=−13 in all cases, with a 16% standard deviation. For the ECM response, the coefficient ao was less than 1% of a1, indicating no appreciable active response for the ECM. For the FPM response, the ratio of ao to a1 increased exponentially with increasing cell concentration, indicating a substantial active component to the cell contribution to overall FPM mechanics at the highest cell concentrations: a0/a1 = 0.067 (1–exp(−C/7.6)), where C is the dimensionless cell concentration,12 related to the cell concentration N by C=Nl3, in which l is the average cell length (100 μm).
Figure 4.

Coefficient a as a function of strain for FPMs containing a final cell concentration of 11.8 Mcell/ml (“ECM” represents specimens tested in PBS with deoxycholate; “FPM” represents specimens tested in DMEM with serum).
Figure 5.

Coefficient b as a function of tissue strain for FPMs containing a final cell concentration of 11.8 Mcell/ml (“ECM” represents specimens tested in PBS with deoxycholate; “FPM” represents specimens tested in DMEM with serum).
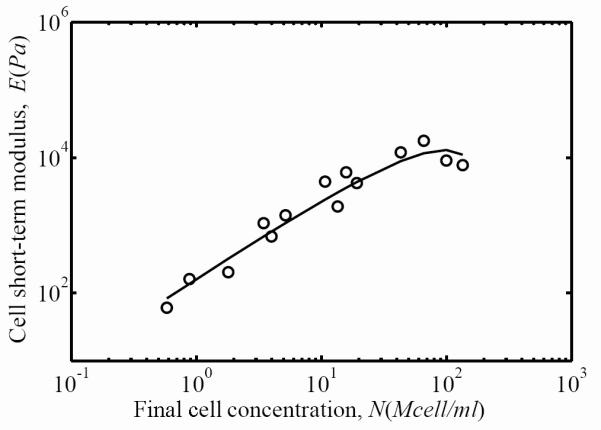
Using Eq. 5, we calculated the linear short-term (t=0.01 sec, Figs. 6 and 7) and long-term (t=3600 sec) secant moduli. The short-term and long-term secant moduli for both FPM and ECM were related to the cell concentration by a power law:
| (7) |
where Eo, Ei, and γ were calibrated from experiments using least squares fitting. For the short-term secant modulus of the FPM, Eo=148 Pa, Ei=221 Pa, and γ=1.29 (solid line in Fig. 6). For the short-term secant modulus of the ECM contribution, Eo=148 Pa, Ei=61.2 Pa, and γ=1.54 (solid line in Fig. 7.) Note that Eo (the cell-free ECM secant modulus) was very close for both the ECM and the FPM. This was also the case for the long-term secant moduli (not shown): the fitting for both the ECM and FPM yielded Eo=40.4 Pa. The long-term secant moduli for the ECM were about 27% of the short-term secant moduli (Ei=16.7 Pa and γ=1.54); the long-term secant moduli for the FPM were also about 27% of the short-term secant moduli (Ei=60 Pa and γ=1.3). Although Eq. 7 provided a good fitting for the secant moduli, the standard deviation of this fitting was about 40% in all cases, as can be seen from the variations of the parameters a and b (Fig. 4 and Fig. 5). The thousand-fold increase in ECM moduli exhibited over the range of final cell concentrations observed corresponds approximately to a hundred-fold increase in collagen concentration due to remodeling (Fig. 8).
Figure 6.
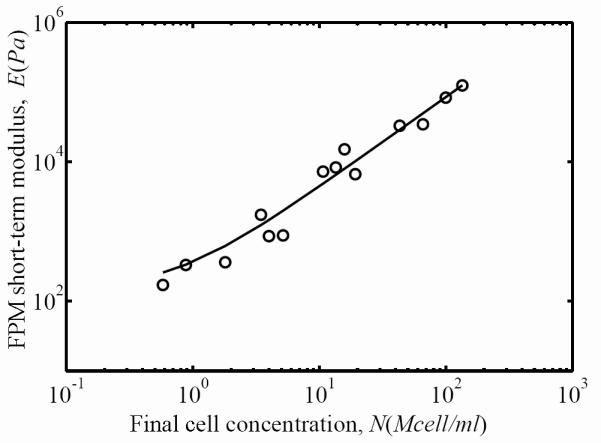
The overall FPM stiffness after three days of incubation increased monotonically with final cell concentration. Circles represent the experimental measurements of the FPM short-term secant modulus as a function of the final cell concentration, and the solid line is a power-law fit (Eq. 6).
Figure 7.
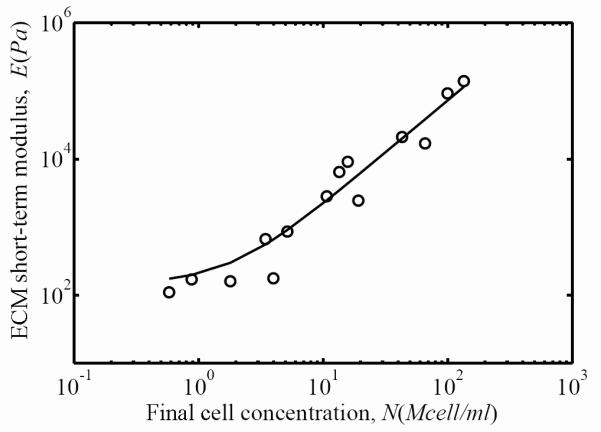
The contribution of the ECM to overall FPM stiffness after three days of incubation increased monotonically with final cell concentration. Circles represent the experimental measurements of the FPM short-term secant modulus as a function of the final cell concentration, and the solid line is a power-law fit (Eq. 6).
Figure 8.
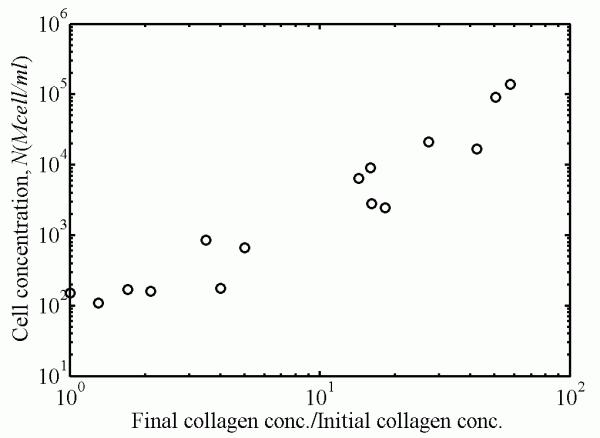
The ECM stiffness increases with increasing cell concentration were far greater than those that would be expected from compaction of collagen in the absence of remodeling. The relationship between collagen concentration and ECM modulus followed a power law.
The cellular contribution to overall FPM mechanics was calculated as the difference between FPM and ECM responses. This is shown in Fig. 9, where the circles are calculated from experiments and the solid line is calculated from the difference between predictions for FPM and ECM using Eq. 7. The cell contribution increased linearly for concentrations up to about C=50, then appeared to decrease slightly for the highest cell concentrations.
Figure 9.
The contribution of the cell to overall FPM stiffness after three days of incubation increased with final cell concentration for all but the highest of cell concentrations. Circles represent the experimental measurements of the FPM short-term secant modulus as a function of the final cell concentration, and the solid line is the difference between the fits for FPM and ECM (Eq. 6).
The portion of the cellular contribution to overall FPM mechanics that results from active cell contraction when the FPM is in its reference configuration can be assessed by evaluating the degree to which the FPM would seek to contract if released (the zero-force strain, Fig. 10). This was assessed by calculating the difference εo between the strain-axis intercept of the rate-independent component of the FPM mechanical response and that of the ECM mechanical response (see the inset of Fig. 10). The strain axis intercept of the rate-independent component of the ECM mechanical response was close to zero, indicating that the reference configuration chosen was close to an unstressed state of the ECM. Multiplying εo by the FPM secant modulus at t=1 provides an estimate of the active stress produced by the cells, σo.
Figure 10.
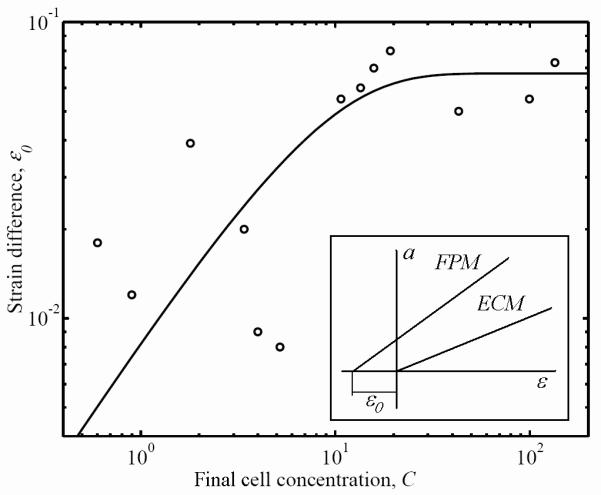
Variation in the stress-free strain, εo, for the rate-independent component of the FPM mechanical response as a function of the cell concentration. This difference is related to the contribution of the active cellular contraction to the overall stress in the FPM.
4. Discussion
ECM remodeling was associated with a change in thickness and width of the FPM and also with a mechanical stiffening of the ECM. These effects increased greatly with increasing initial cell concentration, suggesting that remodeling was most pronounced over a small region around cells in the three-day incubation. The results quantitatively support the observation of Wakatsuki et al.20 that the mechanics of FPMs changes significantly near the cell concentration needed to form a continuous cellular network.
Since the degree to which the cells reduced the FPM volume relates to the degree of ECM remodeling,20 we conclude from Figs 1 and 2 that the compression of the FPM over the three-day incubation increased monotonically with initial cell concentration. As observed previously by Wakatsuki et al.,20 the relationship between initial and final cell concentration (Fig. 2) was non-linear. From the DNA assay data, we can conclude that the cell division rate decreased as the cell concentration increased. Cell populations initially above the percolation threshold reduced in number during incubation. These suggest either a competition for nutrients that resulted in more extensive cell death at high cell concentrations, or that the proximity of neighboring cells might initiate signals that stimulate or inhibit cell division.
When the samples were tested in a relaxation test, the isometric force dropped logarithmically over the 3600 sec duration of the experiment (Fig. 3). The logarithmic relaxation implies that the dissipation modulus of the FPM is constant over the range of frequencies defined by these limiting time constants. This behavior has been observed in a wide variety of biological tissues.6 While others13,24 have described very accurately the viscoelastic response of FPMs using exponentials laws with at least five parameters, the logarithmic relaxation model provides a good description of the phenomenon using only two. The deviations from the logarithmic decay seen during the first fraction of a second after the jump are likely an artifact of the rapid stretch, which lasted on the order of 0.01 sec.
When analyzed over these larger timescales, the rate-independent (Fig. 4) and rate-dependent (Fig. 5) components of the ECM, cellular, and FPM responses exhibited a nearly linear increase with increasing strain of the sample. The threshold at which non-linearity was visible was never lower than a 10% strain; this threshold increased with increasing cell concentration.
In separating the cellular and ECM contributions to overall FPM mechanics, the cellular contribution identified in Fig. 9 was the combined stiffness contributions of cellular stiffness and any connectivity that the cells impart on the ECM. The cell contribution appeared to decrease at the very highest cell concentrations. As this corresponded to the highest matrix stiffnesses, this suggests a mechanism by which cells may stiffen when in a relatively compliant ECM.
The portion of the cellular contribution to FPM mechanics that resulted from active contraction was modeled as independent of strain based on observations published elsewhere.20 However, these results do need to be interpreted with caution, since any strain dependence that does exist would not be possible to separate from the estimates of rate-independent ECM stiffness in this study. The magnitude of active contraction was characterized by the stress-free strain increment εo that was interpreted as being caused by the active cell stress contribution (the product of εo and the FPM short-term secant modulus). At high concentrations, εo did not vary with cell concentration, meaning that active contraction was proportional to the FPM short-term modulus at high cell concentrations.
To convert the ECM contribution shown in Fig. 7 to a continuum (void-free) ECM modulus, the presence of voids left by the cells in the ECM due to elimination of cells must be accounted for. Continuum analysis of model problems5,15 indicates that these effects have little influence on the continuum ECM mechanical properties when the cell concentration is small; however, the effect is appreciable when the cell volume fraction is greater than 10%. Further analysis is needed to establish the continuum ECM mechanical properties.
Several other groups have used tissue constructs to study effects of ECM compaction in the context of cell concentration. Direct comparison is difficult due to the vast differences in ECM remodeling exhibited by different cell types.2 Furthermore, fibroblasts from different sources can exhibit fundamentally different behavior during ECM remodeling.16 However, other studies support some of the results presented here. In particular, Knapp et al.9 found, as in this study, that cell traction increased with cell concentration for tissue constructs cultured for shorter intervals. Cummings et al.3 found that cyclic mechanical stimulus during ECM remodeling increased final mechanical stiffness of vascular constructs, although the results of Wille et al.23 suggest limits to these effects for FPMs. Further modeling efforts are needed to understand how cells, ECM, and cell-ECM interactions change due to cyclic stressing to produce these changes. Additionally, further model refinement will be needed to account for the effects of any mechanical anisotropy that develops due to constraints imposed on FPMs by the cylindrical molds.18
5. Conclusions
This work established the mechanical response of cells and ECM in three-day old FPMs as a function of cell concentration. The initial cell concentration defined the remodeling of the ECM and the cell division rate.
As with many biological tissues, the cells and ECM in FPMs showed an active viscoelastic mechanical response. When interpreted in terms of a logarithmic relaxation model, the long- and short-term contributions of cells and ECM to overall FPM mechanics increased exponentially with increasing cell concentration, although cellular contributions dropped off for the highest cell concentrations studied.
We studied the effect of cell contribution on the overall FPM response; however, we have not yet studied how this relates to the mechanical response of individual cells. Future work must employ micro-mechanical modeling techniques to relate the observations in this work to specific continuum moduli of cells and ECM.
Acknowledgements
This work was supported in part by the National Institutes of Health through grants AR47591 and GM38838. The authors thank Tetsuro Wakatsuki for many insightful discussions.
References
- 1.Bell E, Ivarsson B, Merrill C. Production of a tissue-like structure by contraction of collagen lattices by human fibroblasts of different proliferative potential in vitro. Proc. Natl. Acad. Sci. USA. 1979;76(3):1274–8. doi: 10.1073/pnas.76.3.1274. [DOI] [PMC free article] [PubMed] [Google Scholar]
- 2.Bellows CG, Melcher AH, Aubin JE. Cells of different types compress and remodel collagen to markedly different degrees. Journal of Cell Science. 1981;50:299–314. doi: 10.1242/jcs.50.1.299. [DOI] [PubMed] [Google Scholar]
- 3.Cummings CL, Gawlitta D, Nerem RM, Stegemann JP. Properties of engineered vascular constructs made from collagen, fibrin, and collagen-fibrin mixtures. Biomaterials. 2004;25(17):3699–3706. doi: 10.1016/j.biomaterials.2003.10.073. [DOI] [PubMed] [Google Scholar]
- 4.Desmouliere A, Chaponnier C, Gabbiani G. Tissue repair, contraction, and the myofibroblast. Wound Repair. Regen. 2005;13(1):7–12. doi: 10.1111/j.1067-1927.2005.130102.x. [DOI] [PubMed] [Google Scholar]
- 5.Eshelby JD. The determination of the elastic field outside an ellipsoidal inclusion and related problems. Proc. Roy. Soc. A. 1957:241. [Google Scholar]
- 6.Fung YC. Biomechanics: Mechanical Properties of Living Tissues. Springer; New York: 1993. pp. 277–280. [Google Scholar]
- 7.Gabbiani GI. The myofibroblast in wound healing and fibrocontractive disease. The Journal of Pathology. 2003;200(4):500–503. doi: 10.1002/path.1427. (4) [DOI] [PubMed] [Google Scholar]
- 8.Hill R. The Mathematical Theory of Plasticity. Oxford University Press; London, UK: 1950. [Google Scholar]
- 9.Knapp DM, Tower TT, Tranquillo RT, Barocas VH. Estimation of cell traction and migration in an isometric cell traction assay. AIChE Journal. 1999;45(12):2628–2640. [Google Scholar]
- 10.Kolodney MS, Wysolmerski RB. Isometric contraction by fibroblasts and endothelial cells in tissue culture: a quantitative study. J. Cell Biol. 1992;117:73–82. doi: 10.1083/jcb.117.1.73. [DOI] [PMC free article] [PubMed] [Google Scholar]
- 11.Marquez JP, Genin GM, Zahalak GI, Elson EL. Thin bio-artificial tissues in plane stress: the relationship between cell and tissue strain, and an improved constitutive model. Biophys. J. 2005;88:765–777. doi: 10.1529/biophysj.104.040808. [DOI] [PMC free article] [PubMed] [Google Scholar]
- 12.Marquez JP, Genin GM, Zahalak GI, Elson EL. The relationship between cell and tissue strain in three-dimensional bio-artificial tissues. Biophys. J. 2005;88:778–789. doi: 10.1529/biophysj.104.041947. [DOI] [PMC free article] [PubMed] [Google Scholar]
- 13.Pryse KM, Nekouzadeh A, Genin GM, Elson EL, Zahalak GI. Incremental mechanics of collagen gels: new experiments and a new viscoelastic model. Ann Biomed Eng. 2003;31(10):1287–96. doi: 10.1114/1.1615571. [DOI] [PubMed] [Google Scholar]
- 14.Pryse KM, Elson EL. Mechanical effects of deoxycholate, triton, cytochalasin, and latrunculin A, on reconstituted collagen and fibroblast cells. 2005. Manuscript in preparation.
- 15.Roberts AP, Garboczi EJ. Elastic properties of model porous ceramics. J. Am. Cer. Soc. 2000;83(12):3041–3048. [Google Scholar]
- 16.Shreiber DI, Barocas VH, Tranquillo RT. Temporal variations in cell migration and traction during fibroblast-mediated gel compaction. Biophysical Journal. 2003;84(6):4102–4114. doi: 10.1016/S0006-3495(03)75135-2. [DOI] [PMC free article] [PubMed] [Google Scholar]
- 17.Tomasek JJ, Gabbiani G, Hinz B, Chaponnier C, Brown RA. Myofibroblasts and mechano-regulation of connective tissue remodelling. Nat Rev Mol Cell Biol. 2002;3(5):349–63. doi: 10.1038/nrm809. [DOI] [PubMed] [Google Scholar]
- 18.Thomopoulos S, Fomovsky GM, Holmes JW. The Development of Structural and Mechanical Anisotropy in Fibroblast Populated Collagen Gels. ASME J. Biomechanical Engr. 2005;127:742–750. doi: 10.1115/1.1992525. [DOI] [PubMed] [Google Scholar]
- 19.Tranquillo RT, Murray JD. Continuum model of fibroblast-driven wound contraction: inflammation-mediation. J. Theor. Biol. 1992;158:135–172. doi: 10.1016/s0022-5193(05)80715-5. [DOI] [PubMed] [Google Scholar]
- 20.Wakatsuki T, Kolodney MS, Zahalak GI, Elson EL. Cell mechanics studied by a reconstituted model tissue. Bioph. J. 2000;79:2353–2368. doi: 10.1016/S0006-3495(00)76481-2. [DOI] [PMC free article] [PubMed] [Google Scholar]
- 21.Wang JHC, Goldschmidt-Clermont P, Yin FC. Contractility affects stress fiber remodeling and reorientation of endothelial cells subjected to cyclic mechanical stretching. Ann. Biomed. Eng. 2000;28:1165–1171. doi: 10.1114/1.1317528. [DOI] [PubMed] [Google Scholar]
- 22.Wille JJ, Ambrosi CM, Yin FC. Comparison of the effects of cyclic stretching and compression on endothelial cell morphological responses. J Biomech Eng. 2004;126(5):545–51. doi: 10.1115/1.1798053. [DOI] [PubMed] [Google Scholar]
- 23.Wille JJ, Elson EL, Okamoto RJ. Cell and Matrix Mechanics Determined By Cyclic Stretch of Bioartificial Tissues. Proceedings of the Society for Experimental Mechanics Annual Conference and Exposition; St. Louis, MO. June 4-7, 2006; 2006. Paper number 182. [Google Scholar]
- 24.Zahalak GI, Wagenseil JE, Wakatsuki T, Elson EL. A cell-based constitutive relation for bio-artificial tissues. Biophys. J. 2000;79:2369–2381. doi: 10.1016/S0006-3495(00)76482-4. [DOI] [PMC free article] [PubMed] [Google Scholar]