Abstract
The estimated glomerular filtration rate (eGFR) is a parameter derived from the serum creatinine, patient age and gender and is used to ascertain renal function. It is subject to variation because of the analytical error of the creatinine measurement and biological variation. The widespread use of the eGFR to classify renal disease has led to the identification of more patients with marginal chronic kidney disease but because of the uncertainty of the eGFR it has also led to over-diagnosis of some kidney disease. There is a well described age relation with eGFR.The uncertainty of the eGFR at the critical decision level of 60 mL/min/1.73 m2 is calculated to be 11. Caution needs to be exercised when interpreting an eGFR between 49 and 71 mL/min/1.73 m2.
Keywords: eGFR, Uncertainty, Biological variation, Analytical variation, Chronic renal failure
Introduction
The estimated glomerular filtration rate (eGFR) calculation is widely used to diagnose and monitor chronic kidney disease and was introduced because of the limitations of serum creatinine [1]. As the eGFR calculation uses the sex, ethnicity and age of the patient, some of the sources of variation when using the serum creatinine alone are eliminated. However, as creatinine is effectively the only measured parameter in the eGFR equation, errors in the serum creatinine will produce errors in the eGFR.
Serum creatinine has a low intra-individual coefficient of variation (CV) compared with the between individual CV. Thus serum creatinine is not very sensitive as a marker of deteriorating renal function when an individual is compared to the population reference interval. Indeed it has been shown that the serum creatinine can remain within the population reference interval when the individual’s GFR has decreased by 50 % [2]. Also, because of the reciprocal relationship between GFR and serum creatinine it is more difficult to appreciate the rate of decline of renal function. An increase in creatinine from 88 to 177 μmol/L reflects a decline in GFR of 46 mL/min/1.73 m². A further increase to 265 μmol/L reflects a decline of only 14 mL/min/1.73 m2 [2, 3]. It has been shown that 11 % of patients will have a serum creatinine in the reference range when their eGFR is <60 mL/min/1.73 m2 [4].
While it has been noted that the intra-individual variation of serum creatinine in stable renal function is relatively small and thus changes in serial measurements for an individual can be useful, this data when available may be from different sources employing different methodologies and thus not comparable [5]. Attempts have also been made to tighten the reference intervals for creatinine by dividing the intervals into age and sex specific ranges [6].
Interferences that directly increase or decrease plasma creatinine, will produce an eGFR that does not reflect the ‘true’ GFR. Most laboratory staff and clinicians are aware of the problems associated with creatinine in different situations. However, eGFR seems more intuitive as a measure of renal function as the relationship between serum creatinine and GFR is reciprocal and non-linear.
Recent mandatory reporting of eGFR in Australia and Canada has led to increased appropriate referral of elderly, diabetic and female patients to specialist nephrologists but it has also led to increased numbers of inappropriate referrals [7, 8]. Most of the adults classified as being in stage 3 CKD in the Canadian study are older females whereas in the Australian study no gender difference was noted. Glassock and Winearls [9] point out that the characteristics of patients with stage 3 differ from those with end stage renal disease so the arbitrary cutoff of 60 mL/min/1.73 m2 may not be an appropriate predictor of renal disease. In the Canadian experience the proportion of appropriate to inappropriate referrals did not change whereas in the Australian study there was an increased percentage of inappropriate referrals, mainly non-diabetic patients with eGFRs >30 mL/min/1.73 m2. It was suggested that the reasons for the inappropriate referrals are lack of familiarity with eGFR, lack of resources to manage patients with mild chronic renal failure in primary care, patient demand to be referred to a specialist and different perspectives as to what constitutes an appropriate referral [7]. In the Australian cohort the referral patients (see Table 1 for referral guidelines) had a significantly lower eGFR (39.6 vs 46.4 mL/min/1.73 m2) but not a significantly different serum creatinine (140 vs 130 μmol/L) compared with the pre mandatory reporting group. It has been reported that up to 25–30 % of patients initially categorised as being in stage 3 CKD will move out of this category if retested at a later time [9].
Table 1.
Kidney check Australia taskforce guidelines for indications for referral to a nephrologist (9)
| • | eGFR <30 mL/min/1.73 m2 |
| • | Rapidly declining kidney function (15 % decrease in eGFR over 3 months irrespective of baseline) |
| • | Proteinuria >1 g/24 h |
| • | Glomerular haematuria |
| • | Kidney disease and hypertension that proves difficult to control |
| • | Diabetes and eGFR <60 mL/min/1.73 m2 |
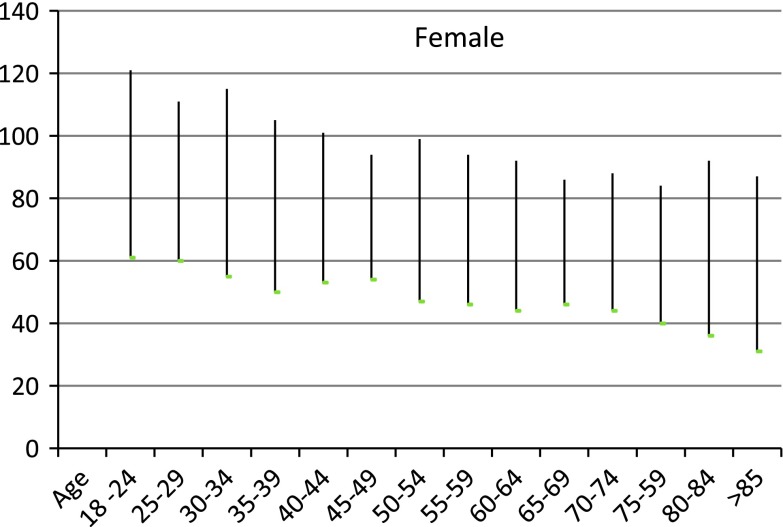
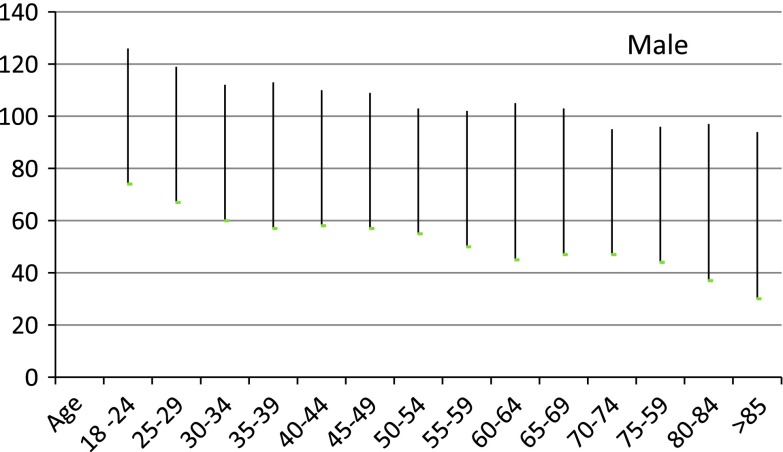
It is likely that the actual underlying rate of kidney disease has not changed [10] and may represent inappropriate classification of individuals into stage 3 CKD. Sixty percent of adults with stage 3 CKD are female and greater than 60 years old. There is strong evidence that there is an age related decrease in GFR in apparently normal males and females at ages as young as 45 and above [10, 11]. Thus there is an argument to present eGFR results with age and sex related reference intervals even at ages of 45 and above as proposed by Wetzels et al. [12] (see Figs. 1, 2). Recently, however the revised recommendations of the Australian Creatinine Consensus Group did not agree with age related reference intervals. In the study of patients with eGFRs of between 45 and 60 mL/min/1.73 m2 and no albuminuria there was no difference in mortality from kidney disease in those above to those below 65 years [13]. However, Roderick [14] has shown that older patients (>75) commonly had eGFRs <60 mL/min/1.73 m2 but there did not appear to be associated adverse pathophysiologic consequences until the eGFR fell to less than 45 mL/min/1.73 m2. It should also be noted that CKD stages 3–5 are defined solely on the absolute value of the eGFR without any requirement of evidence of kidney damage such as proteinuria or haematuria.
Fig. 1.
Calculated reference intervals by 5 year intervals for females from reference [13]
Fig. 2.
Calculated reference intervals by 5 year intervals for males from reference [13]
Uncertainty of the eGFR
The purpose of this paper is to provide some understanding of the uncertainty of measurement of the eGFR and to calculate the reference change value (RCV) for an eGFR at critical decision levels. The significance of this uncertainty is that it will impact on clinical outcomes.
eGFR and Creatinine–Relationship
The eGFR is a function of creatinine, age, sex and ethnicity. There are a variety of eGFR equations currently used and they were derived based on different populations, the analytical method and the calibration system used for creatinine [1]. Table 2 lists the eGFR equations commonly in use in laboratory practice. Using such estimations which are age and sex related will improve the closeness to true GFR but it will over estimate GFR in obese or oedematous patients.
Table 2.
eGFR Equations based on serum creatinine concentration
 |
 |
| CKD-EPI eGFR; |
| Female with creatinine <62 μmol/L; use eGFR = 144 × (Cr/61.6)−0.329 × (0.993)age female with creatinine >62 μmol/L; use eGFR = 144 × (Cr/61.6)−1.209 × (0.993)age male with creatinine <80 μmol/L; use eGFR = 141 × (Cr/79.2)−0.411 × (0.993)age male with creatinine >80 μmol/L; use eGFR = 141 × (Cr/79.2)−1.209 × (0.993)age, where Cr is serum creatinine |
The Modification of Diet in Renal Disease (MDRD) study [15] was based on a multicentre trial to evaluate the effect of dietary protein restriction and blood pressure control on progression of renal disease in 1,628 patients with CKD, with the added objective of developing an equation that could improve the prediction of GFR from serum creatinine. The MDRD was subsequently validated in patients with diabetic kidney disease, renal transplants and African Americans. It has not been validated in other ethnic groups or in children or patients older than 70. The initial study used creatinine measured by the Alkaline Picrate (Jaffe) method on a Beckman Coulter CX3. Subsequently, The Isotope Dilution Mass Spectrometry (IDMS) MDRD equation standardised the creatinine assay to the reference method (GS-IDMS). The MDRD formula was developed in a population with some renal impairment and it has been shown to underestimate GFR in subjects with normal renal function.
The CKD-Epidemiology Collaboration group (CKD-EPI) equation was developed by recalibrating the original MDRD creatinine results to those obtained with the Roche Creatininase Plus enzymatic assay [16]. The equations were developed and validated against urinary clearance of I125 iothalamate. The enzymatic method for serum creatinine is subject to less interference than the Jaffe rate method. In fact it has been stated that up to 20 % of the colour produced by the Jaffe reaction is due to non-creatinine chromogens [11]. Therefore the Jaffe creatinine will produce a higher value for creatinine than the enzymatic method and hence it will lead to a lower eGFR. However in another study investigating different commercially available creatinine assays the authors noted that, even though the Jaffe methods were significantly more affected by interference from endogenous and exogenous substances, all methods including enzymatic methods were affected to some degree. Interestingly, not only were the magnitudes of the biases different, but the bias could be positive in some methods and negative in others. Where samples were supplemented with interferents the observed bias was greater at creatinine levels within the reference interval than at higher concentrations [17].
The CKD-EPI is the closest approximation to the true GFR as measured by clearance of iothalamate in urine. The only measured parameter is serum creatinine and overwhelmingly this is performed using the Jaffe method. The eGFR calculation is thus subject to the same interference problems as serum creatinine. That is, if there are interfering substances present which impact on the serum creatinine, the estimate of GFR will be inaccurate.
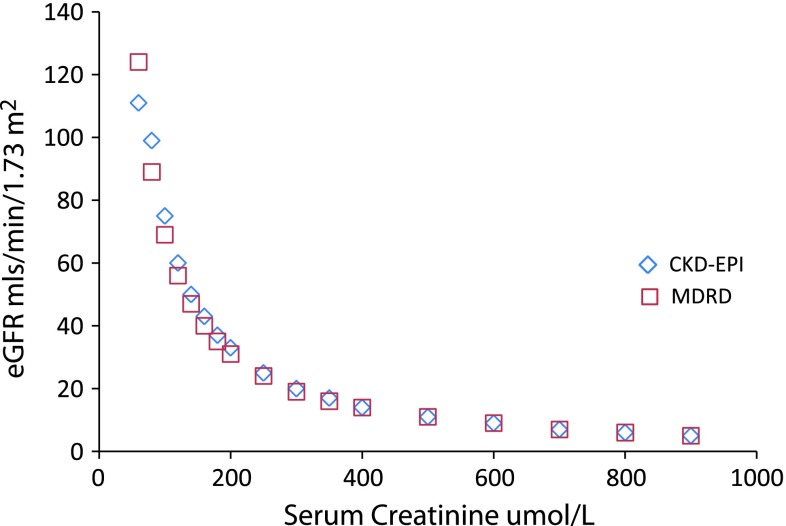
Figure 3 compares results for two methods of estimating eGFR at different serum creatinine levels.
Fig. 3.
eGFR calculated for a given serum creatinine for the MDRD and CKD-EPI formula
Biological and Analytical Variation of Creatinine
The biological variation of serum creatinine in healthy subjects has been reported between 4.3 and 5.3 % [18] but others have reported different variations in disease states [19]. Table 3 shows the reported CVs for creatinine in healthy subjects and in various disease states.
Table 3.
Biological variation in health and disease
| Normal | Diseased | n | Disease group | |
|---|---|---|---|---|
| Florkowski | 5.3 | |||
| 4.3 | 5.3 | 17 | CRF | |
| 5.9 | 27 | Type 1 DM | ||
| 6.4 | 9 | Impaired RF | ||
| 6.5 | 11 | Type 1 DM | ||
| 11.5 | 41 | Post transplant | ||
| 13 | 54 | Children CRF | ||
| 13.4 | 20 | AMI |
Within run CV for creatinine in a rate Jaffe method is concentration dependent and typically has levels of between 2 % at a level of 130 μmol/L to 1 % at 600 μmol/L. In the calculations which follow we used results from an external quality assurance program to provide values for analytical variation. Using the Royal College of Pathologists Australia QAP results [20] for the cycle 88 2011 we find that the average analytical CVs for creatinine range from the best at 1.1 % to the worst at 4.7 % and a median of 3 %. The allowable limits of performance for the RCPA QAP for creatinine are 8 μmol/L up to 100 and 8 % for higher concentrations.
Uncertainty of Measurement of eGFR and Creatinine
We will use the CKD-EPI equation and a 50 year old male Caucasian as the basis for our analysis. Firstly we will determine the uncertainty of measurement for the CKD-EPI eGFR. We assume that there is no error in the age, sex or ethnicity and concentrate on the error in the measurement of serum creatinine. The square of the standard uncertainty of measurement of a parameter xA is the square of A multiplied by the square of standard uncertainty of x, hence the uncertainty of the CKD-EPI eGFR is 1.209 times the uncertainty of the creatinine [21]. For a creatinine with an analytical variation (CVA) of 3 % therefore, the standard uncertainty of the eGFR is 3.6 % (1.209 × 3). We use the coverage factor of 2 to obtain the expanded uncertainty which is therefore equal to 7.2 %.
Reference Change Value
The reference change value or critical difference is the value where two serial measurements are statistically different based on the underlying biological and analytical variation of the analyte of interest [18]. The formula for RCV is usually given as  , where CVA = analytical imprecision and CVI = intra-individual biological variation; and the analyte is normally distributed.
For creatinine the intra-individual biological variation is 4.3 % and we will again use 3 % as the CVA. To calculate the CVI for eGFR we will factor the CVI of creatinine by 1.209 which is the factor used in the eGFR calculation, thus CVI for eGFR becomes 5.2 %. This yields an RCV of 17.5 % (2.77 × (5.22 + 3.62)1/2) and the RCV at an eGFR decision level of 60 is 11 mL/min/1.73 m2. That is, taking into account biological variation as well as analytical imprecision, two eGFRs are not statistically different unless they differ by more than 11 mL/min/1.73 m2.
Smellie [22] described guidelines for the interpretation of eGFR which cite changes of 2 or 4 mL/min/1.73 m2 as significant. But as he states and we have shown by the RCV calculation above, these levels are statistically insignificant. In Table 4 we show for a 50 year old male with a creatinine of 120 μmol/L the uncertainty of measurement of the creatinine, the uncertainty of measurement of the CKD-EPI eGFR and the RCV of that eGFR.
Table 4.
Calculated uncertainties for serum creatinine, CKD-EPI eGFR and the RCV of that eGFR for a male with a creatinine of 120 μmol/L
| At median QAP performance CV % | Worst QAP performance CV % | |
|---|---|---|
| Uncertainty of measurement of serum creatinine (%) using coverage factor of 2 | 6 | 9.4 |
| Uncertainty of measurement of eGFR calculated as UM creatinine × 1.209 (%) | 5.2 | 11.4 |
| Uncertainty at eGFR of 60 which equates to a creatinine of 120 μmol/L | 57–63 | 53–67 |
We next consider the RCV of the eGFR when the patient has chronic renal disease. Data has been published giving CVI values for patients in different disease states [19]. We will assume that the creatinine CVA is 1 % and the CVI is 5.3 % for patients with elevated creatinine. This yields an RCV for creatinine of 18 % (using the CV for creatinine × 1.209). At different eGFRs of 50, 40 and 30 mL/min/1.73 m2 we obtain the results given in Table 5, where we assume that the laboratory is an average performer on the external QAP and hence has an analytical imprecision of 3 %.
Table 5.
Uncertainties of measurement for serum creatinine, CKD-EPI eGFR and RCV for eGFR for eGFRs of 30, 40 and 50 mL/min/1.73 m2
| Calculated eGFR (mL/min/1.73 m2) | Serum creatinine (μmol/L) Approx | UM creatinine μmol/L 3 % | RCV creatinine μmol/L assume UM × 1.209 and CVI = 5.2 | UM eGFR (UM creat × 1.209) (mL/min/1.73 m2) | RCV eGFR |
|---|---|---|---|---|---|
| 50 | 140 | 4 | 36 | 5 | 10 |
| 40 | 160 | 5 | 42 | 6 | 8 |
| 30 | 200 | 6 | 52 | 7 | 6 |
Creatinine and eGFR at the Decision Point
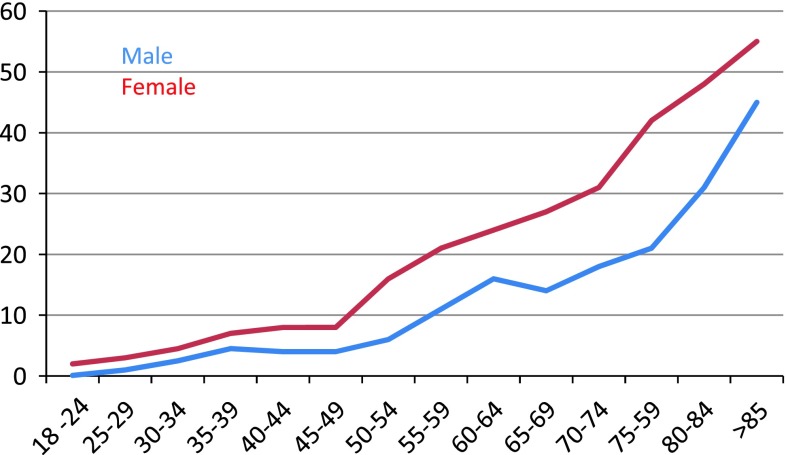
The decline in eGFR with age is clearly apparent from the data in Figs. 1 and 2. But the interpretation of these formulae in older patients is somewhat controversial. Smellie [23] state that eGFR should not been validated if the patient is older than 70, but that eGFR is still useful as it is more accurate than serum creatinine. The interpretation of eGFR in older patients is however complex and perhaps age related reference intervals should be used in this group to avoid unnecessary concern. In Fig. 4 we have calculated from the data of Wetzels et al. [12] the percentage of the population (who have no comorbidities) who lie below 60 mL/min/1.73 m2. Clearly by the age of 85 a significant proportion of the population, indeed with females the majority, will have an eGFR less than 60 mL/min/1.73 m2.
Fig. 4.
The percentage of the population used by Wetzels et al. [12] who lie below the eGFR cutoff of 60 mL/min/1.73 m2
Conclusion
Estimated glomerular filtration rate has an uncertainty because of the imprecision and biological variation of serum creatinine. We would recommend that each laboratory determine this uncertainty by calculating the uncertainty of measurement of the creatinine as measured in their laboratory. It is important to note however that the uncertainty in creatinine and hence in the eGFR varies with the level of creatinine, the method used to estimate creatinine and disease state.
The RCV for eGFR is significant and can affect the decision to refer a patient for specialist review because at the decision point of 60 mL/min/1.73 m2 it is 11 mL/min/1.73 m2. Therefore caution should be used when interpreting eGFRs near this point. It would be prudent to use two estimates of eGFR if one fell between 49 and 71 mL/min/1.73 m2.
References
- 1.Florkowski CM, Chew-Harris JSC. Methods of estimating GFR: different equations including CKD-EPI. Clin Biochem Rev. 2011;31(2):75–79. [PMC free article] [PubMed] [Google Scholar]
- 2.Shemesh O, Golbetz H, Kriss JP, Myers BD. Limitations of creatinine as a filtration marker in glomerulopathic patients. Kidney Int. 1985;28(5):830–838. doi: 10.1038/ki.1985.205. [DOI] [PubMed] [Google Scholar]
- 3.Stevens LA, Coresh J, Greene T, Levey AS. Assessing kidney function–measured and estimated glomerular filtration rate. N Eng J Med. 2006;354(23):2473–2483. doi: 10.1056/NEJMra054415. [DOI] [PubMed] [Google Scholar]
- 4.Kannapiran M, Nisha D, Madhusudhana Rao A. Underestimation of impaired kidney function with serum creatinine. Ind J Clin Biochem. 2010;25(4):380–384. doi: 10.1007/s12291-010-0080-4. [DOI] [PMC free article] [PubMed] [Google Scholar]
- 5.Fraser C. Estimating GFR: What’s wrong with using serum creatinine alone?. http://www.aacc.org/members/nacb/NACBBlog/lists/posts/post.aspx?ID=5#. Accessed 17 Sept 2012.
- 6.Ceriotti F, Boyd JC, Klein G, Henny J, Queraltó J, Kairisto V, Panteghini M. Reference intervals for serum creatinine concentrations: assessment of available data for global application. Clin Chem. 2008;54(3):559–566. doi: 10.1373/clinchem.2007.099648. [DOI] [PubMed] [Google Scholar]
- 7.Akbari A, Grimshaw J, Stacey D, Hogg W, Ramsay T, Cheng-Fitzpatrick M, Magner P, Bell R, Karpinski J. Change in appropriate referrals to nephrologists after the introduction of automatic reporting of the estimated glomerular filtration rate. CMAJ. 2012;184(5):E269–E276. doi: 10.1503/cmaj.110678. [DOI] [PMC free article] [PubMed] [Google Scholar]
- 8.Noble E, Johnson DW, Gray N, Hollett P, Hawley CM, Campbell SB, Mudge DW, Isbel NM. The impact of automated eGFR reporting and education on nephrology service referrals. Nephrol Dial Transplant. 2008;23(12):3845–3850. doi: 10.1093/ndt/gfn385. [DOI] [PMC free article] [PubMed] [Google Scholar]
- 9.Glassock RJ, Winearls C. CKD: fiction not fact. Nephrol Dial Transplant. 2008;23(8):2695–2696. doi: 10.1093/ndt/gfn331. [DOI] [PubMed] [Google Scholar]
- 10.http://www.kidney.org.au/LinkClick.aspx?fileticket=sMKP3HBuquM%3d&tabid=635&mid=1584. Accessed 17 Sept 2012.
- 11.Perrone RD, Madias NE, Levey AS. Serum creatinine as an index of renal function: new insights into old concepts. Clin Chem. 1992;38(10):1933–1953. [PubMed] [Google Scholar]
- 12.Wetzels JF, Kiemeney LA, Swinkels DW, Willems HL, den Heijer M. Age- and gender-specific reference values of estimated GFR in Caucasians: the Nijmegen Biomedical Study. Kidney Int. 2007;72(5):632–637. doi: 10.1038/sj.ki.5002374. [DOI] [PubMed] [Google Scholar]
- 13.Johnson DW, Jones GRD, Mathew TH, Ludlow MJ, Doogue MP, Jose MD, Langham RG, Lawton PD, McTaggart SJ, Peake MJ, Polkinghorne K, Usherwood T. Chronic kidney disease and automatic reporting of estimated glomerular filtration rate: new developments and revised recommendations. Med J Aust. 2012;197(4):224–225. doi: 10.5694/mja11.11329. [DOI] [PubMed] [Google Scholar]
- 14.Roderick PJ, Atkins RJ, Smeeth L, Mylne A, Nitsch DDM, Hubbard RB, Bulpitt CJ, Fletcheret AE. Chronic kidney disease and mortality risk in older people: a community-based population study in the United Kingdom. Am J Kidney Dis. 2009;53:950–960. doi: 10.1053/j.ajkd.2008.12.036. [DOI] [PubMed] [Google Scholar]
- 15.Levey AS, Bosch JP, Lewis JB, Greene T, Rogers N, Roth D. A more accurate method to estimate glomerular filtration rate from serum creatinine: a new prediction equation. Modification of Diet in Renal Disease Study Group. Ann Intern Med. 1999;130:461–470. doi: 10.7326/0003-4819-130-6-199903160-00002. [DOI] [PubMed] [Google Scholar]
- 16.Levey AS, Coresh J, Greene T, Marsh J, Stevens LA, Kusek JW, Van Lente F. Expressing the Modification of Diet in Renal Disease Equation for estimating glomerular filtration rate with standardised serum creatinine values. Clin Chem. 2007;53(4):766–772. doi: 10.1373/clinchem.2006.077180. [DOI] [PubMed] [Google Scholar]
- 17.Greenberg N, Roberts WL, Bachmann LM, Wright EC, Dalton RN, Zakowski JJ, Miller WG. Specificity characteristics of 7 commercial creatinine measurement procedures by enzymatic and Jaffe method principles. Clin Chem. 2012;58(2):391–401. [DOI] [PubMed]
- 18.Fraser CG. Biological variation: from principles to practice. Washington: AACC; 2001. [Google Scholar]
- 19.Ricós C, Iglesias N, García-Lario JV, Simón M, Cava F, et al. Within-subject biological variation in disease: collated data and clinical consequences. Ann Clin Biochem. 2007;44:343–352. doi: 10.1258/000456307780945633. [DOI] [PubMed] [Google Scholar]
- 20.RCPA Chemical Pathology Quality Assurance. http://www.rcpaqap.com.au/chempath/. Accessed 19 Sept 2012.
- 21.Farrance I, Frenkel R. Uncertainty of measurement: a review of the rules for calculating uncertainty components through functional relationships. Clin Biochem Rev. 2012;33(2):49–75. [PMC free article] [PubMed] [Google Scholar]
- 22.Smellie WS. What is a significant difference between sequential laboratory results? J Clin Pathol. 2008;61(4):419–425. doi: 10.1136/jcp.2007.047175. [DOI] [PubMed] [Google Scholar]
- 23.Smellie WSA, Shaw N, Bowley R, Stewart MF, et al. Best practice in primary care pathology: review 10. J Clin Pathol. 2007;60:1195–1204. doi: 10.1136/jcp.2007.048512. [DOI] [PMC free article] [PubMed] [Google Scholar]


