

The semiquantitative fetal total maturation score scale may be used to assess morphologic brain maturity of fetuses between 25 and 35 weeks of gestational age on a single-case basis in a clinical setting.
Abstract
Purpose:
To develop a valid, reliable, and simple-to-use semiquantitative visual scale of fetal brain maturation for use in clinical fetal MR imaging assessment and interpretation.
Materials and Methods:
This is a retrospective assessment of data from a previous study that was prospective, institutional review board approved, and HIPAA compliant. Forty-eight normal pregnancies with a gestational age (GA) of 25 to 35 weeks were studied. A fetal total maturation score (fTMS) was developed by utilizing six subscores that evaluated cortical sulcation, myelination, and the germinal matrix and provided a single combined numerical value to be evaluated as a marker of brain maturity. The fTMS was correlated with GA and segmented brain volume. A regression model that associated GA based on the visual fTMS scoring was determined. The model was validated with a leave-one-out cross validation procedure.
Results:
Mean GA was 29.3 weeks ± 2.9 (standard deviation) (range, 25.2–35.3 weeks) and mean fTMS was 8.6 ± 3.7 (range, 4–16). The intraclass correlation coefficient between the three readers (independent and blinded) was 0.948 (P < .001). The correlations were as follows: GA and brain volume, r = 0.964 (P < .001); fTMS and brain volume, r = 0.970 (P < .001); and GA and fTMS, r = 0.975 (P < .001). A regression model to calculate GA based on fTMS yielded the following equation: calculated GA (weeks) = 22.86 + 0.748 fTMS (P < .001; adjusted R2 = 0.946). The standard error of the model for calculation of fetal GA from the visual fTMS scale was ±4.8 days.
Conclusion:
If validated further, the fTMS scale might be used to assess morphologic brain maturity of fetuses between 25 and 35 weeks GA on a single-case basis in a clinical setting.
© RSNA, 2013
Supplemental material: http://radiology.rsna.org/lookup/suppl/doi:10.1148/radiol.13111715/-/DC1
Introduction
Assessment of fetal brain maturation has the potential to provide important prognostic information and to facilitate the future study of human brain development in normal and high-risk fetuses. It can also provide a means to assess the effect of cardiovascular, placental, and systemic conditions on the developing fetal brain (1–8).
Authors of numerous publications (9–14) focus on evaluation of the normal in utero changes that occur during development of the brain by using fetal magnetic resonance (MR) imaging. Authors of excellent pictorial atlases (9,10,15) demonstrate the stages of normal fetal brain development, but the atlases may be somewhat difficult or time consuming to use when the numerous and varied features of the brain of an individual fetus are compared to it, especially when the different rates of maturation in various areas of the brain are considered. Similarly, authors of a number of publications (12,14,16–19) reported quantitative and biometric measurements of the fetal brain in various stages of development. These biometric indices are certainly useful, but many of the individual quantitative measurements that are proposed do not provide a comprehensive multidimensional framework for evaluation of brain maturity, and interpretation of the importance of each of these measurements in an individual fetal patient may be difficult or limited. Additionally, some of them use complex and sophisticated image analysis methods that cannot be readily applied in the clinical setting. Therefore, there is a paucity of easy-to-use and reliable methods of brain maturation assessment that could be routinely used in the clinic. The primary goal of this study was to develop a valid, reliable, and simple semiquantitative visual scale of fetal brain maturation for daily clinical fetal MR image assessment and interpretation.
Materials and Methods
Patients
All patients were recruited for a previously published study (2) with institutional review board approval, Health Insurance Portability and Accountability Act compliance, and written informed consent. Study participants were prospectively enrolled into a longitudinal case-control study that compared brain development in fetuses that had congenital heart disease with healthy controls. The present report includes data from healthy controls that were recruited in the study. The patients included healthy pregnant volunteers with a normal fetal echocardiogram obtained for a family history of congenital heart disease or who were suspected of having congenital heart disease in their current pregnancy. Estimated gestational age (GA) was based on maternal dates and first-trimester ultrasonographic measurements, if available, by the pregnant mother’s referring obstetrician. The working GA as determined by the referring obstetrician at the time of MR imaging was used. All pregnancies and prenatal ultrasonography examinations were normal. Exclusion criteria included GA older than 36 completed weeks, multiple-gestation pregnancy, gestational diabetes, maternal contraindication to MR imaging, inadequate MR imaging data quality, prenatally documented chromosomal abnormalities, congenital infection, fetal ultrasonographic findings of dysmorphic features, dysgenic brain lesions, or anomalies of other organ systems. Detection of structural fetal brain anomalies identified on fetal or neonatal MR imaging also excluded patients from the study. There were no predetermined minimum GA exclusion criteria. The patients were born with a median GA of 39 weeks (range, 37–41 weeks). All patients included in the study had normal postnatal brain MR examinations that were performed between 39 and 44 weeks GA. The Vineland Adaptive Behavior Scale (20) was used to assess functional performance in communication, daily living, socialization, and motor skills in the cohort between 18 and 24 months. Developmental scores on the Vineland Adaptive Behavior Scale were age appropriate for all patients.
Fetal MR Imaging Examinations
All images were acquired with a 1.5-T imager (Achieva; Philips Medical Systems, Best, the Netherlands) with a five-channel phased-array cardiac coil. Multiplanar single-shot turbo spin-echo imaging was performed (repetition time/effective echo time = 12 500/120 msec; signal acquired, 0.625; field of view, 330 mm; matrix, 256 × 204; section thickness, 2 mm; no gap). No contrast material or maternal sedation was used.
Development of the Semiquantitative Brain Maturation Score
The semiquantitative brain maturation score was developed by major modifications and additions to previously used postnatal brain maturation scores (5,21), and based on the authors’ clinical experience with fetal brain MR imaging and previously published fetal brain atlases (9,10,16). Six simple morphologic scoring criteria were used to construct a fetal total maturation score (fTMS) by assigning a numerical subscore to each of the six criteria (Table). These six subscores included degree of frontal and occipital sulcation, degree of insular sulcation, extent of visualization of the germinal matrix, extent of myelination, presence and depth of the superior temporal sulcus, and presence and depth of the inferior temporal sulcus (Fig 1, Figs E1–E4 [online]). Images of the right and left sides of the brain were scored separately and averaged, since there may be small differences between the right and left hemispheres. A cumulative fTMS of the brain was calculated by adding the results from those six individual subscores. A pediatric neuroradiologist (A.V.) and a pediatric neurologist (D.J.L.), each with 8 years of experience with fetal MR imaging, were blinded to GA and brain volume and independently scored brain MR images for each of the patients. For further assessment of interrater reliability, a third rater who was not involved with development of the fTMS scale (P.J.S.) and is a student with no fetal MR imaging experience but with 1 year of pediatric brain MR imaging analysis research experience, also scored the fetal MR images after blinded training on five randomly selected patient cases.
Morphologic Visual Criteria to Calculate fTMS in Assessment of Fetal Brain Maturation on MR Images
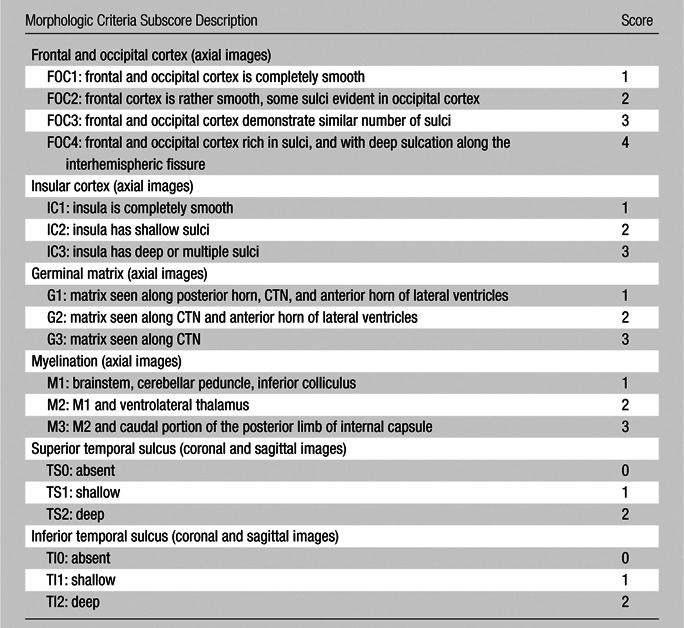
Note.—FTMS is the sum of the six subscores; minimum = 4, maximum = 17. The left- and right-sided scores are averaged. CTN = caudothalamic notch.
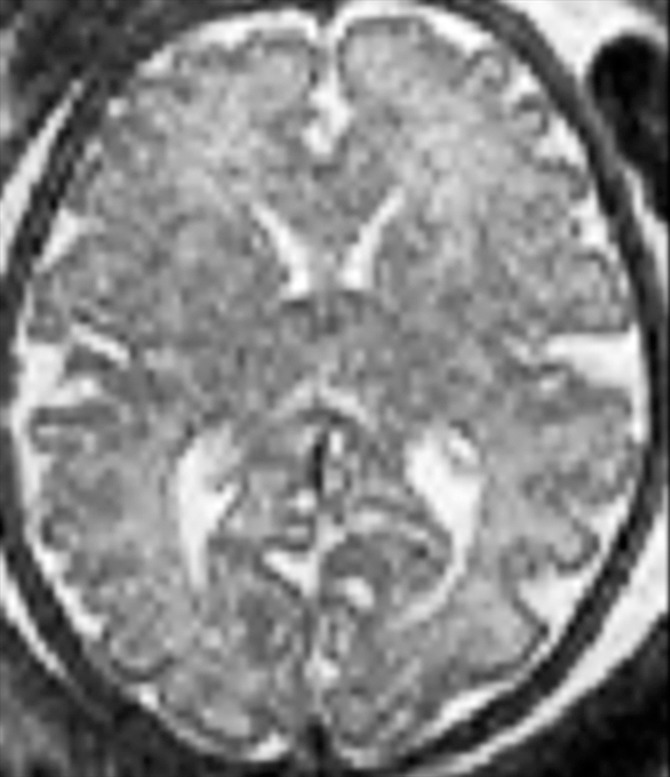
Figure 1a:
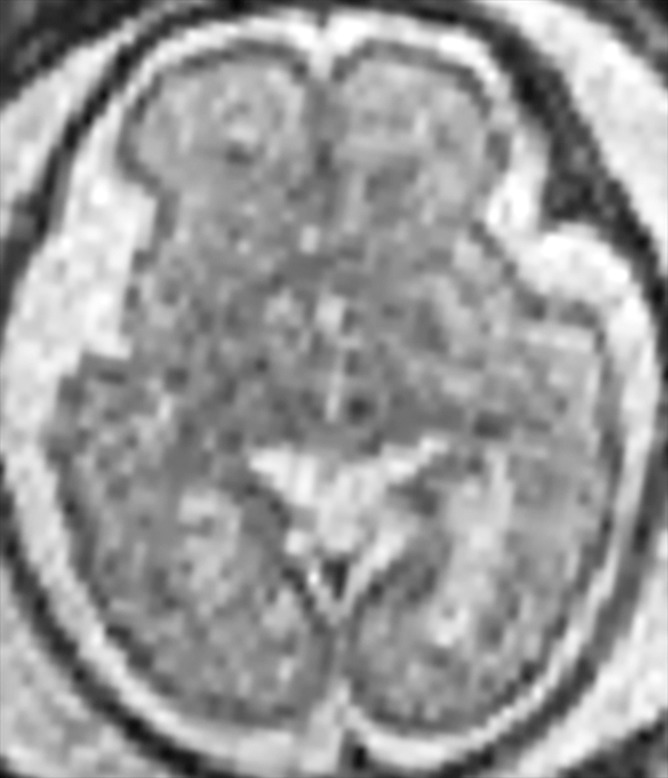
Demonstration of the frontal and occipital cortex sulcation subscore of the fTMS scale. Axial MR images at the level of the basal ganglia show increasing frontal and occipital sulcation. (a) Image from a 26-week GA fetus shows smooth frontal and occipital cortices; frontal and occipital cortex subscore of 1. (b) Image from a 28-week GA fetus shows relatively smooth frontal cortices, but with presence of sulci along the occipital cortices; frontal and occipital cortex subscore of 2. (c) Image from a 30-week GA fetus shows similar sulcation in the frontal and occipital cortices; frontal and occipital cortex subscore of 3. (d) Image from a 35-week GA fetus shows rich frontal and occipital cortical sulcation and relatively deep sulci along the interhemispheric fissures; frontal and occipital cortex subscore of 4.
Figure 1b:
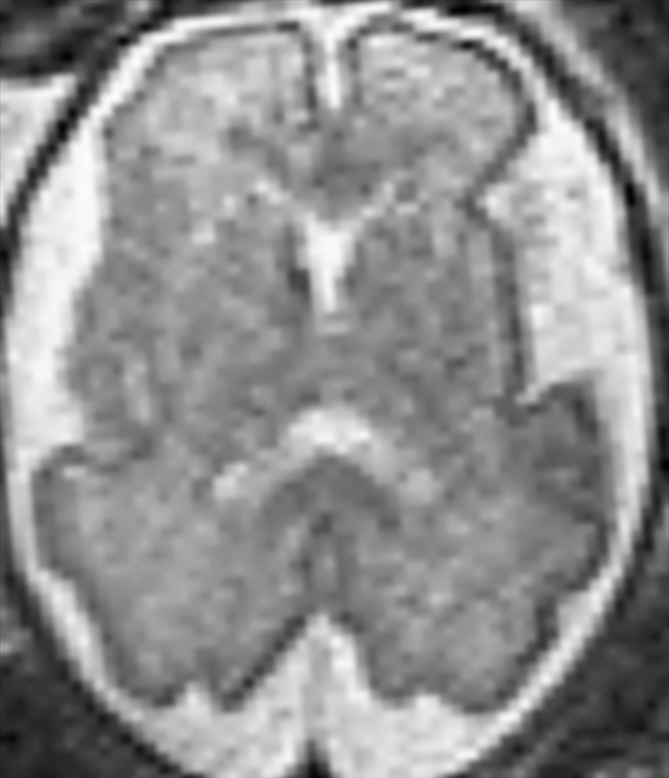
Demonstration of the frontal and occipital cortex sulcation subscore of the fTMS scale. Axial MR images at the level of the basal ganglia show increasing frontal and occipital sulcation. (a) Image from a 26-week GA fetus shows smooth frontal and occipital cortices; frontal and occipital cortex subscore of 1. (b) Image from a 28-week GA fetus shows relatively smooth frontal cortices, but with presence of sulci along the occipital cortices; frontal and occipital cortex subscore of 2. (c) Image from a 30-week GA fetus shows similar sulcation in the frontal and occipital cortices; frontal and occipital cortex subscore of 3. (d) Image from a 35-week GA fetus shows rich frontal and occipital cortical sulcation and relatively deep sulci along the interhemispheric fissures; frontal and occipital cortex subscore of 4.
Figure 1c:
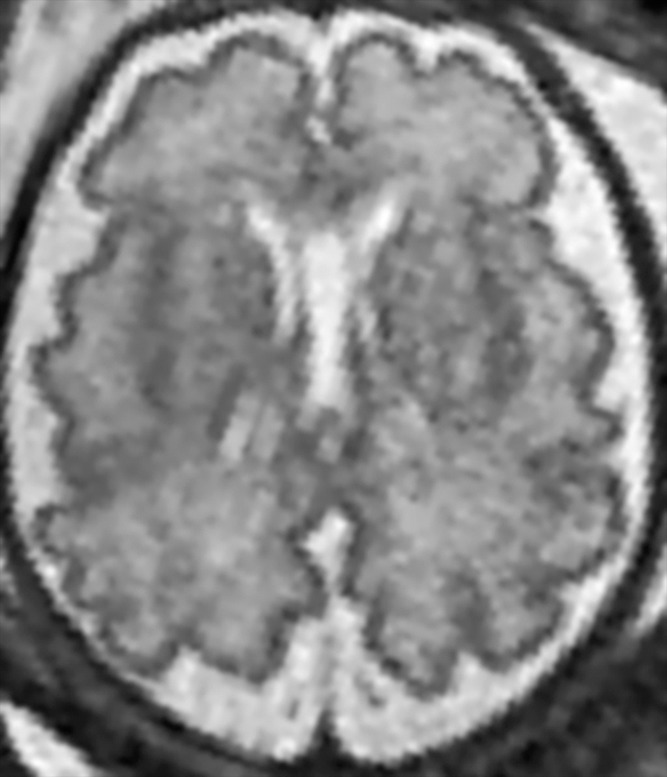
Demonstration of the frontal and occipital cortex sulcation subscore of the fTMS scale. Axial MR images at the level of the basal ganglia show increasing frontal and occipital sulcation. (a) Image from a 26-week GA fetus shows smooth frontal and occipital cortices; frontal and occipital cortex subscore of 1. (b) Image from a 28-week GA fetus shows relatively smooth frontal cortices, but with presence of sulci along the occipital cortices; frontal and occipital cortex subscore of 2. (c) Image from a 30-week GA fetus shows similar sulcation in the frontal and occipital cortices; frontal and occipital cortex subscore of 3. (d) Image from a 35-week GA fetus shows rich frontal and occipital cortical sulcation and relatively deep sulci along the interhemispheric fissures; frontal and occipital cortex subscore of 4.
Figure 1d:
Demonstration of the frontal and occipital cortex sulcation subscore of the fTMS scale. Axial MR images at the level of the basal ganglia show increasing frontal and occipital sulcation. (a) Image from a 26-week GA fetus shows smooth frontal and occipital cortices; frontal and occipital cortex subscore of 1. (b) Image from a 28-week GA fetus shows relatively smooth frontal cortices, but with presence of sulci along the occipital cortices; frontal and occipital cortex subscore of 2. (c) Image from a 30-week GA fetus shows similar sulcation in the frontal and occipital cortices; frontal and occipital cortex subscore of 3. (d) Image from a 35-week GA fetus shows rich frontal and occipital cortical sulcation and relatively deep sulci along the interhemispheric fissures; frontal and occipital cortex subscore of 4.
Quantitative Brain Volumetric MR Imaging Analysis
The method for the quantitative brain volumetric MR imaging analysis has been previously reported (2). Briefly, the MR images of the fetal intracranial cavity were masked manually to extract the fetal brain from the intrauterine tissue, brain coverings, and cerebrospinal fluid. Images were corrected for intensity inhomogeneity by using the nonparametric nonuniformity intensity normalization method (22). To minimize the effects of image degradation secondary to fetal motion, an iterative section-by-section registration was used, which normalized the intensity of each section (23). The middle brain section, defined as the section at the midpoint of the brain, was used as a reference, and the global median intensity of each subsequent section was normalized to the reference with the use of single-scale intensity normalization with a nonlinear registration approach. A Gauss-Seidel iterative schema was then applied to register the sections to a weighted average of the considered section and the two neighboring sections. The rigid-body registration of the sections reached a steady point when it was identical to the previous registration. After correction for fetal motion, coronal sections were segmented manually by using image processing software (MINC; McConnell Brain Imaging Centre, Montreal Neurological Institute, Montreal, Quebec, Canada) to measure brain volume. Total brain volume was determined by the sum of brain parenchymal volumes measured on each coronal section. All measurements were made by a single operator (C.L., with 8 years of pediatric and fetal brain MR imaging analysis experience) who was blinded to clinical data. Each coronal area was traced twice, and the average of the two measurements was used for volume calculations. Brain volumes could not be calculated for three patients due to motion or image distortion, and they were therefore excluded from analyses that involved fetal brain volume.
Statistical Analysis
Interrater reliability between the three independent raters was assessed by using an intraclass correlation coefficient with a two-way random model for absolute agreement (24). Correlations between fTMS, GA, and total brain volume were estimated by using the Pearson product moment correlation coefficient corrected for multiple comparisons with a Bonferroni approach. Linear regression was used to assess the primary hypothesis that fTMS predicts GA on fetal MR imaging within the range of GA in the fetuses studied. To assess the validity of the model across various samples, cross validation was performed by a leave-one-out methodology in which the analysis is repeated n−1 times, each time with one patient left out of the analysis. Multivariable stepwise linear regression with assessment of colinearity was performed on the six morphologic subscores that composed the fTMS to assess whether other combinations of the subscores could provide an accurate calculation of GA.
Results
A total of 48 fetuses were studied. There were 27 (56%) males and 21 (44%) females. Brain volumes could not be calculated for three patients owing to motion or image distortion and they were therefore excluded from analyses involving fetal brain volume. The mean GA at the time of fetal MR imaging was 29.3 weeks ± 2.9 (standard deviation; range, 25.2–35.3 weeks). Mean calculated fetal brain volume was 179 × 103 mm3 ± 63 (range, 102–321 × 103 mm3). Average fTMS was 8.6 ± 3.7 (range, 4–16). There was no statistically significant difference between male and female fetuses regarding GA (t = 0.45; P = .65), brain volume (t = 0.65; P = .51), or fTMS (t = 0.88; P = .38).
The intraclass correlation coefficient between the three independent blinded readers who scored the MR images for fTMS was 0.948 (95% confidence interval [CI]: 0.887, 0.974; P < .001). The correlation between GA and brain volume was r = 0.964 (P < .001), correlation between fTMS and brain volume was r = 0.970 (P < .001), and correlation between GA and fTMS was r = 0.975 (P < .001) (Fig 2).
Figure 2a:

Relationship between calculated brain volumes with (a) fetal GA and (b) fTMS scores.
Figure 2b:

Relationship between calculated brain volumes with (a) fetal GA and (b) fTMS scores.
Regression Analysis
Univariate regression analysis to predict GA based on the total fTMS yielded a regression equation in the form of: calculated GA (weeks) = 22.86 + 0.748 fTMS (P < .001; adjusted R2 = 0.946); standard error of estimate, 0.69 week (Fig 3). The mean standard error of the model for calculation of GA from the total fTMS was ±4.8 days. This model indicated that for every 1-unit increase in fTMS, GA was predicted to increase by 0.748 weeks. Figure 3 shows the 95% CI across a range of fTMS. This CI is a reasonable bound on the value that GA would take in a new sample, and here it takes the form: calculated GA ± 1.41 × square root [0.00148 (fTMS)2 − 0.0254 (fTMS) + 1.1299]. For example, for an fTMS of 10, the calculated GA is 30.3 weeks (95% CI: 28.9, 31.8 weeks). The results of the cross-validation leave-one-out procedure showed a standard error of 0.21 for the constant y (95% CI: 22.44, 23.29; P < .001) and a standard error of 0.02 for the slope x (95% CI: 0.703, 0.793; P < .001) in the model.
Figure 3:

Relationship between the visual fTMS scores and fetal GA.
The relationship of the individual subscores to GA is shown in Figure 4. A model that utilized four of the six subscores was derived from the stepwise analysis, namely frontal-occipital sulcation, germinal matrix, superior temporal sulcation, and inferior temporal sulcation subscores, with a standard error of estimate of 0.74 and adjusted R2 of 0.934.
Figure 4a:

Relationship between fetal GA and the six components of the fTMS scoring system, including (a) the frontal and occipital cortex subscore, (b) the insular cortex subscore, (c) the germinal matrix subscore, (d) the myelination subscore, (e) the superior temporal sulcus subscore, and (f) the inferior temporal sulcus subscore.
Figure 4b:

Relationship between fetal GA and the six components of the fTMS scoring system, including (a) the frontal and occipital cortex subscore, (b) the insular cortex subscore, (c) the germinal matrix subscore, (d) the myelination subscore, (e) the superior temporal sulcus subscore, and (f) the inferior temporal sulcus subscore.
Figure 4c:

Relationship between fetal GA and the six components of the fTMS scoring system, including (a) the frontal and occipital cortex subscore, (b) the insular cortex subscore, (c) the germinal matrix subscore, (d) the myelination subscore, (e) the superior temporal sulcus subscore, and (f) the inferior temporal sulcus subscore.
Figure 4d:

Relationship between fetal GA and the six components of the fTMS scoring system, including (a) the frontal and occipital cortex subscore, (b) the insular cortex subscore, (c) the germinal matrix subscore, (d) the myelination subscore, (e) the superior temporal sulcus subscore, and (f) the inferior temporal sulcus subscore.
Figure 4e:

Relationship between fetal GA and the six components of the fTMS scoring system, including (a) the frontal and occipital cortex subscore, (b) the insular cortex subscore, (c) the germinal matrix subscore, (d) the myelination subscore, (e) the superior temporal sulcus subscore, and (f) the inferior temporal sulcus subscore.
Figure 4f:

Relationship between fetal GA and the six components of the fTMS scoring system, including (a) the frontal and occipital cortex subscore, (b) the insular cortex subscore, (c) the germinal matrix subscore, (d) the myelination subscore, (e) the superior temporal sulcus subscore, and (f) the inferior temporal sulcus subscore.
Discussion
A large part of brain development occurs in the second half of pregnancy, and includes neuronal migration and arborization, synaptogenesis, oligodendrocyte maturation, initiation of cerebral myelination, programmed cell death, reorganization, and increase of synaptic connections (5,13,25). The availability of quantitative clinical tools to assess brain changes during this critical time period by using noninvasive imaging methods is desirable for surrogate measures of brain maturity. As such, they can provide important clues to normal, abnormal, or delayed development of the brain.
Brain maturation progresses through a predictable series of morphologic changes of cortical and subcortical structures. The fetal cortex undergoes a predetermined temporal sequence of sulcation and gyration in various lobes (9–11,13,16). Early in fetal life, the cortex begins as a smooth structure, and deep primary and more superficial secondary cortical infoldings gradually appear. The earliest signs of surface indentation and sulcation on MR images occurs at the sylvian fissure at 16 weeks and the parieto-occipital and anterior cingular sulci at 18 weeks GA (11,25). Toward the 35th week, all primary and most of the secondary sulci are present; the secondary sulci appears from the 24th week and the tertiary sulci appears after the 28th week (13,25). Some of these sulci can be used as landmarks for a certain GA, and enable the estimation of age-related brain cortical development (11,13,14,16,25). The germinal matrices or germinal zones are the sites of origin and migration of cortical neurons and glial cells, and they appear robust between 10 and 28 weeks GA. The blood supply to the germinal matrix gradually involutes as neuronal proliferation halts and glial multiplication (which forms migrating bands of glial cells) begins; this starts at 20 weeks GA (26). The myelination of the cerebral hemispheres is largely postnatal, but can be detected in certain locations as darker foci on routine T2-weighted fetal MR images. Myelination in the fetal brain undergoes a sequence of steps during fetal development (14,21,27). Early changes can be seen in the brainstem, cerebellar vermis, cerebellar peduncles, and inferior colliculi. Later, the ventrolateral thalamus and globus pallidus show myelination, and the posterior limbs of the internal capsule subsequently demonstrate myelination, which starts caudally and later involves the more cranial portions. The fTMS uses these detectable morphologic changes on visual inspection of fetal MR images.
Some research groups have focused on brain development beyond simple morphologic assessments. Measurements of diffusion imaging parameters, such as diffusivity or anisotropy in various areas of the brain, have been shown to provide valuable information on fetal brain development and maturity (6,19,28–34). Nevertheless, routine clinical use of these measurements is hindered by various technical issues, practical factors, and limitations that affect quality and reproducibility of these measures. Additionally, while these indices are quite useful in performance of group studies of fetal brain development, it is almost impossible at this stage to interpret the importance of these measured individual values in a particular patient. MR spectroscopic assessment of known brain metabolites, such as N-acetylaspartate, choline, and lactate in the fetus, has also been investigated as a marker of brain development (6,33,35–37). Again, various technical complexities, lack of standards, limitations in availability, and difficulty of interpretation of individual values hamper the usefulness of MR spectroscopy in routine clinical assessment of brain development.
Many of these previous studies cannot be directly or routinely used in the clinical setting because of their complex or time-consuming nature. Others are limited in their reproducibility or the information they provide for a single-patient assessment. This study was undertaken to address some of these limitations. The fTMS scale was developed by major modifications and additions to a previously developed and validated postnatal total maturation score in healthy preterm infants to make it appropriate for fetal MR imaging assessment. The postnatal total maturation score scale is a semiquantitative scoring system that uses predictable anatomic maturational changes in the brain on early postnatal MR images (21). The postnatal total maturation score scale has been applied by a number of research groups and has demonstrated great usefulness with assessment of brain maturational changes in various disease states (1,5,7,8).
Our study results demonstrated the feasibility of developing a highly accurate, reproducible, and simple-to-use clinical scale of brain maturation that capitalizes on brain morphologic changes that can be easily detected with routine T2-weighted fetal MR imaging sequences. It simultaneously tapped into various aspects of brain development during the second half of pregnancy, including cortical sulcation in various parts of the brain, myelination, and changes in the germinal matrix, and provided a single combined numerical value as a surrogate marker of brain maturity. The fTMS scale demonstrated excellent correlations with segmented fetal brain volumes and GA. It was reproducible as shown by the very high correlations between three independent blinded readers. The regression model showed that the fTMS scale is highly accurate, with a standard error of 4.8 days in calculation of the GA of the fetus, all by just a short visual assessment of routine clinical fetal MR images. The cross-validation assessment demonstrated that it may be applied in a similar way across different patient samples. The total fTMS regression model may have appeared slightly more accurate for calculation of GA compared with the four subscore model from the stepwise regression. We note that fTMS was specified in advance whereas the stepwise model developed a new algorithm based on the data and thus overestimates the adjusted R2 that would be obtained in a new sample. Thus, in a new sample the difference between fTMS and the simpler model is expected to be even larger than the difference described here.
An important advantage of this scoring system is that calculation of the fTMS is simple, and can be easily learned and applied to routine clinical fetal T2-weighted MR images without any specialized MR imaging sequences, additional imaging time, specialized software, quantitative measurement tools, or complex analyses. The evaluation can be done in a few minutes on standard clinical axial, coronal, and sagittal T2-weighted images by using clinical reading workstations. It has the potential to be easily implemented in routine clinical assessments, if needed.
This scoring system has great potential to detect gross delays in morphologic maturation of the brain during pregnancy. It can be further used to assess the fetal brain in various systemic fetal, maternal, or placental disease states that may affect brain maturation in utero. It is important to note that correct interpretation of this scoring system necessitates accurate determination of and comparison with GA of the pregnancy.
Our study had limitations. One limitation of this study was its small size. Further validation of this scoring system is desirable in larger population samples. Another limitation of the study was that the study population consisted of fetuses 25–35 weeks GA. Many clinical fetal MR examinations are performed before 25 weeks GA, and it would be helpful to have a simple scale to assess brain maturity at these ages. Another limitation was the use of the working GA, determined by the pregnant mother’s referring obstetrician, at the time of MR imaging as an alternative to more strict pregnancy dating. It should also be noted that this scoring system has not been validated for nor is it currently meant to assess brain maturity in fetal brains with gross malformations, masses, frank hydrocephalus, infarcts, or other major insults. Finally, the clinical utility of the scale in assessment of abnormal growth or development will need to be addressed in future studies.
By providing superior anatomic detail, fetal brain MR imaging has an important role in evaluation of the structurally abnormal brain. Assessment of morphologic brain maturity and intersubject variability on fetal brain MR imaging is valuable in both research and clinical situations. The fTMS semiquantitative scale presented and validated in this study can be used to assess morphologic brain maturity of fetuses between 25 and 35 weeks GA on a single-case basis in a clinical setting. It also has potential for evaluation of the effect of various conditions on the developing fetal brain.
Advances in Knowledge.
• A clinically simple-to-use fetal total maturation score (fTMS) was developed that evaluated cortical sulcation, myelination, and germinal matrix, and provided a single combined numerical value as a surrogate measure of brain maturity.
• The fTMS showed high interrater reliability with an intraclass correlation coefficient of 0.948 (95% confidence interval: 0.887, 0.974; P < .001).
• The fTMS was highly correlated with segmented fetal brain volumes (r = 0.970; P < .001) and gestational age (GA) (r = 0.975, P < .001).
• Regression analysis to calculate GA based on the fTMS yielded the regression equation: GA (weeks) = 22.86 + 0.748 fTMS (P < .001; adjusted R2 = .946); standard error of the model for calculation of GA by the visual fTMS scale was ±4.8 days.
Implication for Patient Care.
• If further validated, fTMS has potential for use in evaluation of the effect of various systemic fetal, maternal, or placental disease states on brain maturation in utero.
Disclosures of Conflicts of Interest: A.V. No relevant conflicts of interest to disclose. C.L. Financial activities related to the present article: grant money from the Canadian Institutes of Health Research paid to author’s institution. Financial activities not related to the present article: none to disclose. Other relationships: none to disclose. M.E.P. Financial activities related to the present article: grant money from National Institutes of Health paid to author’s institution. Financial activities not related to the present article: none to disclose. Other relationships: none to disclose. A.J.d.P. No relevant conflicts of interest to disclose. P.J.S. No relevant conflicts of interest to disclose J.W. No relevant conflicts of interest to disclose. J.C.G. Financial activities related to the present article: grant money from National Institutes of Health paid to author’s institution. Financial activities not related to the present article: grant money from private foundation and National Institutes of Health paid to author’s institution related to general program in pediatric neuroimaging analysis research. Other relationships: none to disclose. D.J.L. No relevant conflicts of interest to disclose.
Supplementary Material
Received September 8, 2011; revision requested November 15; revision received July 5, 2012; accepted August 3; final version accepted November 23.
Supported in part by the Canadian Institutes of Health Research (MOP-81116) and SickKids Foundation (XG 06-069).
Funding: This research was supported by the National Institutes of Health (grant number P30 HD026979).
Abbreviations:
- CI
- confidence interval
- fTMS
- fetal total maturation score
- GA
- gestational age
References
- 1.Ramenghi LA, Fumagalli M, Righini A, et al. Magnetic resonance imaging assessment of brain maturation in preterm neonates with punctate white matter lesions. Neuroradiology 2007;49(2):161–167 [DOI] [PubMed] [Google Scholar]
- 2.Limperopoulos C, Tworetzky W, McElhinney DB, et al. Brain volume and metabolism in fetuses with congenital heart disease: evaluation with quantitative magnetic resonance imaging and spectroscopy. Circulation 2010;121(1):26–33 [DOI] [PMC free article] [PubMed] [Google Scholar]
- 3.Limperopoulos C. Disorders of the fetal circulation and the fetal brain. Clin Perinatol 2009;36(3):561–577 [DOI] [PubMed] [Google Scholar]
- 4.Abe S, Takagi K, Yamamoto T, Kato T. Assessment of cortical gyrus and sulcus formation using magnetic resonance images in small-for-gestational-age fetuses. Prenat Diagn 2004;24(5):333–338 [DOI] [PubMed] [Google Scholar]
- 5.Licht DJ, Shera DM, Clancy RR, et al. Brain maturation is delayed in infants with complex congenital heart defects. J Thorac Cardiovasc Surg 2009;137(3):529–536; discussion 536–537 [DOI] [PMC free article] [PubMed] [Google Scholar]
- 6.Miller SP, McQuillen PS, Hamrick S, et al. Abnormal brain development in newborns with congenital heart disease. N Engl J Med 2007;357(19):1928–1938 [DOI] [PubMed] [Google Scholar]
- 7.Andropoulos DB, Hunter JV, Nelson DP, et al. Brain immaturity is associated with brain injury before and after neonatal cardiac surgery with high-flow bypass and cerebral oxygenation monitoring. J Thorac Cardiovasc Surg 2010;139(3):543–556 [DOI] [PMC free article] [PubMed] [Google Scholar]
- 8.Ramenghi LA, Martinelli A, De Carli A, et al. Cerebral maturation in IUGR and appropriate for gestational age preterm babies. Reprod Sci 2011;18(5):469–475 [DOI] [PubMed] [Google Scholar]
- 9.Griffiths PD, Morris J, Larroche J, Reeves M. Atlas of fetal and postnatal brain MR. Philadelphia, Pa: Mosby, 2010 [Google Scholar]
- 10.Garel C, ed. MRI of the fetal brain. Berlin, Germany: Springer-Verlag, 2004 [Google Scholar]
- 11.Levine D, Barnes PD. Cortical maturation in normal and abnormal fetuses as assessed with prenatal MR imaging. Radiology 1999;210(3):751–758 [DOI] [PubMed] [Google Scholar]
- 12.Garel C. Fetal cerebral biometry: normal parenchymal findings and ventricular size. Eur Radiol 2005;15(4):809–813 [DOI] [PubMed] [Google Scholar]
- 13.Fogliarini C, Chaumoitre K, Chapon F, et al. Assessment of cortical maturation with prenatal MRI. Part I: Normal cortical maturation. Eur Radiol 2005;15(8):1671–1685 [DOI] [PubMed] [Google Scholar]
- 14.Garel C, Chantrel E, Elmaleh M, Brisse H, Sebag G, Fetal MRI: normal gestational landmarks for cerebral biometry, gyration and myelination. Childs Nerv Syst 2003;19(7-8):422–425 [DOI] [PubMed] [Google Scholar]
- 15.Chapman T, Matesan M, Weinberger E, Bulas DI. Digital atlas of fetal brain MRI. Pediatr Radiol 2010;40(2):153–162 [DOI] [PubMed] [Google Scholar]
- 16.Garel C, Chantrel E, Brisse H, et al. Fetal cerebral cortex: normal gestational landmarks identified using prenatal MR imaging. AJNR Am J Neuroradiol 2001;22(1):184–189 [PMC free article] [PubMed] [Google Scholar]
- 17.Parazzini C, Righini A, Rustico M, Consonni D, Triulzi F. Prenatal magnetic resonance imaging: brain normal linear biometric values below 24 gestational weeks. Neuroradiology 2008;50(10):877–883 [DOI] [PubMed] [Google Scholar]
- 18.Rajagopalan V, Scott J, Habas PA, et al. Local tissue growth patterns underlying normal fetal human brain gyrification quantified in utero. J Neurosci 2011;31(8):2878–2887 [DOI] [PMC free article] [PubMed] [Google Scholar]
- 19.Rutherford M, Jiang S, Allsop J, et al. MR imaging methods for assessing fetal brain development. Dev Neurobiol 2008;68(6):700–711 [DOI] [PubMed] [Google Scholar]
- 20.Sparrow S, Cicchetti D, Balla D. Vineland Adaptive Behavioral Scales (Vineland II). Minneapolis, Minn: AGS Publishing/Pearson Assessments, 2005 [Google Scholar]
- 21.Childs AM, Ramenghi LA, Cornette L, et al. Cerebral maturation in premature infants: quantitative assessment using MR imaging. AJNR Am J Neuroradiol 2001;22(8):1577–1582 [PMC free article] [PubMed] [Google Scholar]
- 22.Sled JG, Zijdenbos AP, Evans AC. A nonparametric method for automatic correction of intensity nonuniformity in MRI data. IEEE Trans Med Imaging 1998;17(1):87–97 [DOI] [PubMed] [Google Scholar]
- 23.Guizard N, Lepag C, Fonov V, Hakyemez H, Evans A, Limperopoulos C. Development of a fetal brain atlas from multi-axial MR acquisitions [abstr]. In: Proceedings of the Sixteenth Meeting of the International Society for Magnetic Resonance in Medicine. Berkeley, Calif: International Society for Magnetic Resonance in Medicine, 2008 [Google Scholar]
- 24.McGraw KO, Wong SP. Forming inferences about some intraclass correlation coefficients. Psychol Methods 1996;1(1):30–46 [Google Scholar]
- 25.Prayer D, Kasprian G, Krampl E, et al. MRI of normal fetal brain development. Eur J Radiol 2006;57(2):199–216 [DOI] [PubMed] [Google Scholar]
- 26.Volpe JJ. Neurology of the newborn. Philadelphia, Pa: Saunders, 2001 [Google Scholar]
- 27.Abe S, Takagi K, Yamamoto T, Okuhata Y, Kato T. Semiquantitative assessment of myelination using magnetic resonance imaging in normal fetal brains. Prenat Diagn 2004;24(5):352–357 [DOI] [PubMed] [Google Scholar]
- 28.Kasprian G, Brugger PC, Weber M, et al. In utero tractography of fetal white matter development. Neuroimage 2008;43(2):213–224 [DOI] [PubMed] [Google Scholar]
- 29.Bui T, Daire JL, Chalard F, et al. Microstructural development of human brain assessed in utero by diffusion tensor imaging. Pediatr Radiol 2006;36(11):1133–1140 [DOI] [PubMed] [Google Scholar]
- 30.Cannie M, De Keyzer F, Meersschaert J, et al. A diffusion-weighted template for gestational age-related apparent diffusion coefficient values in the developing fetal brain. Ultrasound Obstet Gynecol 2007;30(3):318–324 [DOI] [PubMed] [Google Scholar]
- 31.Righini A, Bianchini E, Parazzini C, et al. Apparent diffusion coefficient determination in normal fetal brain: a prenatal MR imaging study. AJNR Am J Neuroradiol 2003;24(5):799–804 [PMC free article] [PubMed] [Google Scholar]
- 32.Schneider MM, Berman JI, Baumer FM, et al. Normative apparent diffusion coefficient values in the developing fetal brain. AJNR Am J Neuroradiol 2009;30(9):1799–1803 [DOI] [PMC free article] [PubMed] [Google Scholar]
- 33.Manganaro L, Perrone A, Savelli S, et al. Evaluation of normal brain development by prenatal MR imaging. Radiol Med (Torino) 2007;112(3):444–455 [DOI] [PubMed] [Google Scholar]
- 34.Limperopoulos C. Advanced neuroimaging techniques: their role in the development of future fetal and neonatal neuroprotection. Semin Perinatol 2010;34(1):93–101 [DOI] [PubMed] [Google Scholar]
- 35.Girard N, Gouny SC, Viola A, et al. Assessment of normal fetal brain maturation in utero by proton magnetic resonance spectroscopy. Magn Reson Med 2006;56(4):768–775 [DOI] [PubMed] [Google Scholar]
- 36.Kok RD, van den Berg PP, van den Bergh AJ, Nijland R, Heerschap A. Maturation of the human fetal brain as observed by 1H MR spectroscopy. Magn Reson Med 2002;48(4):611–616 [DOI] [PubMed] [Google Scholar]
- 37.Pugash D, Krssak M, Kulemann V, Prayer D. Magnetic resonance spectroscopy of the fetal brain. Prenat Diagn 2009;29(4):434–441 [DOI] [PubMed] [Google Scholar]
Associated Data
This section collects any data citations, data availability statements, or supplementary materials included in this article.