The wirelessly powered local detector can provide superior local sensitivity by amplifying the nuclear MR signal before coupling it to the external receiver.
Abstract
Purpose:
To assess the feasibility of imaging deep-lying internal organs at high spatial resolution by imaging kidney glomeruli in a rodent model with use of a newly developed, wireless amplified nuclear magnetic resonance (MR) detector.
Materials and Methods:
This study was approved by the Animal Care and Use Committee at the National Institutes of Health/National Institute of Neurologic Disorder and Stroke. As a preclinical demonstration of this new detection technology, five different millimeter-scale wireless amplified nuclear MR detectors configured as double frequency resonators were chronically implanted on the medial surface of the kidney in five Sprague-Dawley rats for MR imaging at 11.7 T. Among these rats, two were administered gadopentetate dimeglumine to visualize renal tubules on T1-weighted gradient-refocused echo (GRE) images, two were administered cationized ferritin to visualize glomeruli on T2*-weighted GRE images, and the remaining rat was administered both gadopentetate dimeglumine and cationized ferritin to visualize the interleaved pattern of renal tubules and glomeruli. The image intensity in each pixel was compared with the local tissue signal intensity average to identify regions of hyper- or hypointensity.
Results:
T1-weighted images with 70-μm in-plane resolution and 200-μm section thickness were obtained within 3.2 minutes to image renal tubules, and T2*-weighted images of the same resolution were obtained within 5.8 minutes to image the glomeruli. Hyperintensity from gadopentetate dimeglumine enabled visualization of renal tubules, and hypointensity from cationic ferritin enabled visualization of the glomeruli.
Conclusion:
High-spatial-resolution images have been obtained to observe kidney microstructures in vivo with a wireless amplified nuclear MR detector.
© RSNA, 2013
Supplemental material: http://radiology.rsna.org/lookup/suppl/doi:10.1148/radiol.13121352/-/DC1
Introduction
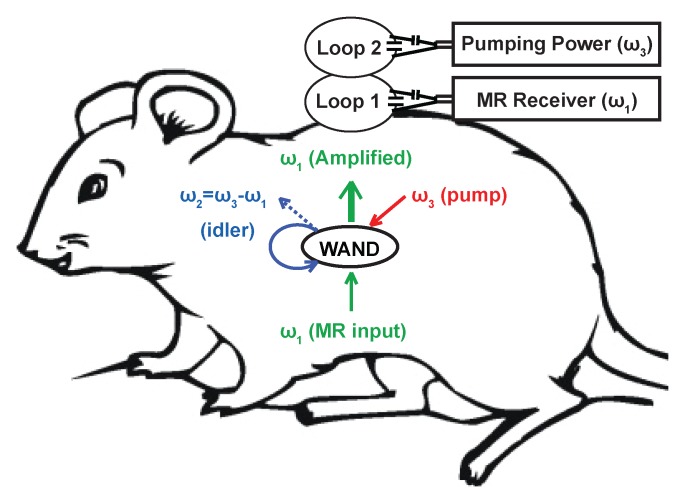
The applicability of magnetic resonance (MR) imaging is often limited by its detection sensitivity (1), which determines the achievable spatial resolution (2). With the advent of higher magnetic fields, array detectors (3), faster imaging sequences (4–6), and hyperpolarization schemes (7–10), the detection sensitivity of MR imaging has increased dramatically over the 4 decades of its existence. In this study, we evaluate a new method that has been developed that utilizes a wireless local detector for further improvement in sensitivity. This method benefits from the well-known fact that a miniaturized detection coil has better local sensitivity when placed in close proximity to the object of interest (11,12). Unlike the traditional microcoils that need a wired connection, the wireless detector can provide superior local sensitivity by amplifying the nuclear MR signal before coupling it to an external receiver (13,14). The wireless amplifier integrated with the detector uses parametric amplification (15,16) to amplify the weak nuclear MR signal in situ, so that it can be placed inside the body without the need for an internal power source (Fig 1a). This wireless detector may potentially be useful for such applications as the repeated long-term monitoring of transplant organs or engineered tissues that are inaccessible by means of a wired connection. This approach may also be used with rectal (17) or catheter coils to reduce radiofrequency heating by eliminating conductive wires. The purpose of this study was to assess the feasibility of imaging deep-lying internal organs at high spatial resolution by imaging kidney glomeruli in a rodent model with use of a newly developed, wireless amplified nuclear MR detector (WAND).
Figure 1a:
(a) WAND device implanted within an animal couples inductively to two external loops (Loop 1 and Loop 2). Loop 2 couples power via the pumping signal to the WAND at ω3 to convert the weak MR signal at ω1 into an amplified output at the idler frequency ω2. The idler current at ω2 mixes again with the pumping signal at ω3 to amplify the current at ω1, which couples out to loop 1 connected to the MR imaging system. (b) Schematic of the WAND implemented as a double resonant circuit coupled inductively to the external loops. (c) Photograph of the PDMS-encapsulated WAND device (see text for discussion of L1, C1, L2, and C2). (d) The phantom test arrangement with the WAND device placed on the surface of a 1% agarose gel. Loop 1 and loop 2 are both 22 mm in diameter and are mounted concentrically above the gel.
Materials and Methods
The Wand Resonator
Previously, it was demonstrated that a centimeter-scale WAND could be implemented as a triple frequency resonator (14), where the weak MR signal at ω1 is mixed with a strong pumping signal at ω3 to produce an amplified output at the idler frequency  . The idler signal at ω2 mixes again with the pumping signal at ω3 to produce a secondary amplified output at ω1. We have found, however, that by making the idler frequency ω2 close enough to the Larmor frequency ω1 and making ω3 approximately twice ω1, it is possible for ω1 and ω2 to share a single circuit mode and to reduce the triple frequency resonator into a double frequency resonator. To differentiate the amplified outputs at ω1 and ω2, it is necessary to separate ω2 from ω1 by a difference frequency that is slightly larger than the receiver bandwidth of the system.
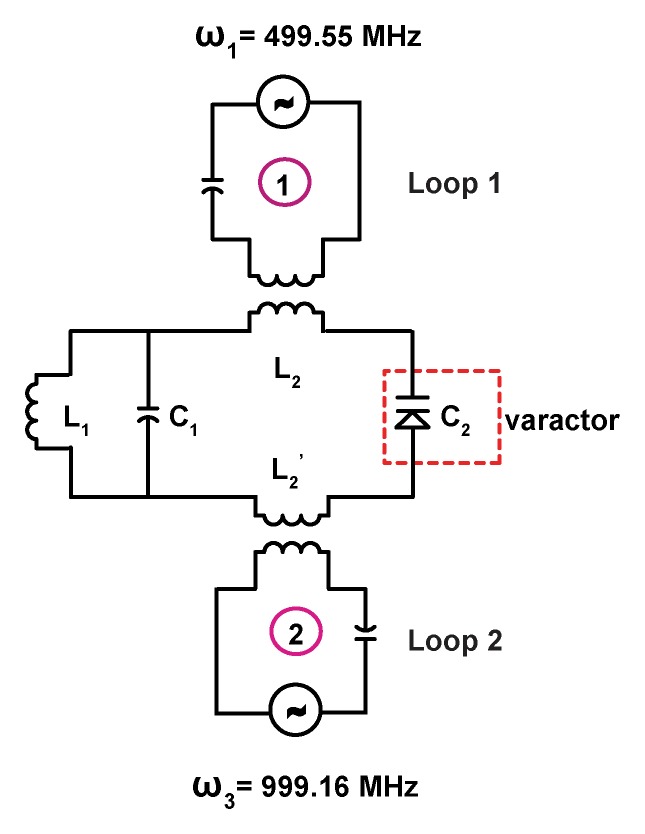
Figure 1b shows the schematic of the double frequency parametric resonator. It consists of a parallel resonant circuit (L1 and C1) placed in series with L2 and C2, where C2 is the varactor diode that performs frequency mixing. The circuit is constructed in such a way as to ensure sufficient radiofrequency current flow through the varactor at ω1, ω2, and ω3. In addition to the parametric resonator, there are two external single tuned loops that inductively couple to the detector. Loop 1 is tuned to receive the amplified MR imaging signal at the Larmor frequency, and loop 2 provides external pumping power for amplification. Figure 1c is an enlarged view of the WAND. In this figure, L1 and L2 are oriented perpendicular to each other so that the resonator couples effectively to nuclear spins when placed inside the magnet at different orientations. The entire WAND is coated with polydimethylsiloxane (PDMS) and has outside dimensions of 7 × 3.5 × 3.5 mm3. The WAND has two circuit modes: a lower frequency mode for reception of the MR imaging signal and a higher frequency mode for reception of the pumping power. The lower resonance frequency is tuned 4 MHz below the Larmor frequency to reduce its coupling with the transmit B1 field. Moreover, since the zero-biased varactor has high capacitive nonlinearity, the WAND is dynamically decoupled by the periodic modulation of its resonance frequency in the presence of the transmit field. During radiofrequency reception, the pumping power is turned on, and the pumping frequency is set to approximately twice the Larmor frequency. The WAND can be wirelessly “tuned” by the external pumping signal, which is demonstrated by measurements shown in Figure E1 (online).
Figure 1b:
(a) WAND device implanted within an animal couples inductively to two external loops (Loop 1 and Loop 2). Loop 2 couples power via the pumping signal to the WAND at ω3 to convert the weak MR signal at ω1 into an amplified output at the idler frequency ω2. The idler current at ω2 mixes again with the pumping signal at ω3 to amplify the current at ω1, which couples out to loop 1 connected to the MR imaging system. (b) Schematic of the WAND implemented as a double resonant circuit coupled inductively to the external loops. (c) Photograph of the PDMS-encapsulated WAND device (see text for discussion of L1, C1, L2, and C2). (d) The phantom test arrangement with the WAND device placed on the surface of a 1% agarose gel. Loop 1 and loop 2 are both 22 mm in diameter and are mounted concentrically above the gel.
Figure 1c:
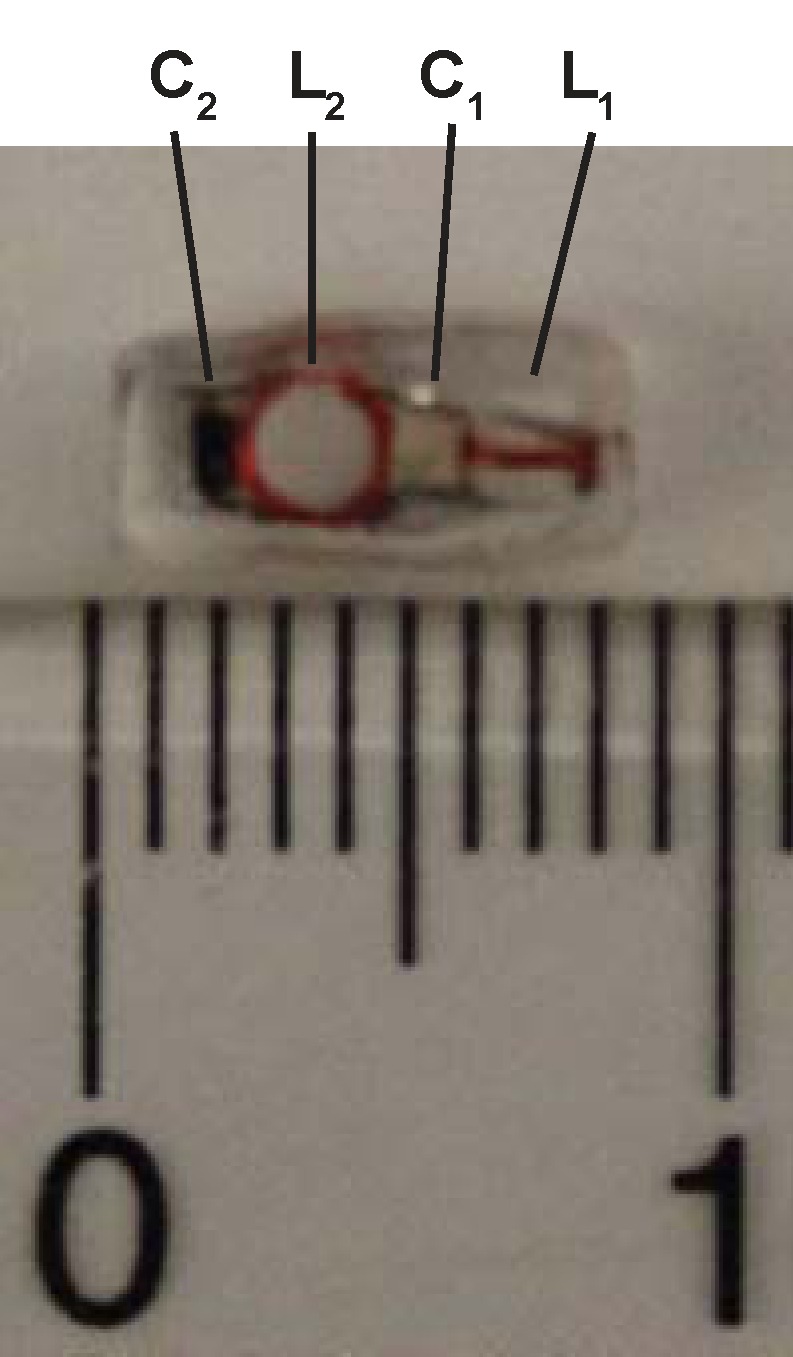
(a) WAND device implanted within an animal couples inductively to two external loops (Loop 1 and Loop 2). Loop 2 couples power via the pumping signal to the WAND at ω3 to convert the weak MR signal at ω1 into an amplified output at the idler frequency ω2. The idler current at ω2 mixes again with the pumping signal at ω3 to amplify the current at ω1, which couples out to loop 1 connected to the MR imaging system. (b) Schematic of the WAND implemented as a double resonant circuit coupled inductively to the external loops. (c) Photograph of the PDMS-encapsulated WAND device (see text for discussion of L1, C1, L2, and C2). (d) The phantom test arrangement with the WAND device placed on the surface of a 1% agarose gel. Loop 1 and loop 2 are both 22 mm in diameter and are mounted concentrically above the gel.
In Vitro Experiments
The resonator was tested by positioning it above a 1% (weight/volume) agarose gel phantom, as indicated in Figure 1d. Loop 1 was separated from the gel by a distance of 15 mm, which is representative of the coil separation from regions of interest for subsequent in vivo studies in rodents. All experiments were performed by using a 11.73-T magnet (Agilent, Oxford, England) equipped with an AVANCE III console (Bruker Biospin, Billerica, Mass). For comparison purposes, multisection two-dimensional (2D) fast low-angle shot (FLASH) images were acquired with the following parameters: repetition time msec/echo time msec, 476/4.9; flip angle, 30°; section thickness, 0.2 mm; field of view (FOV), 4 × 4 cm2; and matrix size, 256 × 256. These experiments were performed during a series of detection configurations: first, using only loop 1; second, with loop 1 passively coupled to the parametric resonator but no pumping power; third, the active situation with pumping power applied; and finally, with a surface coil of the same size as the parametric resonator but with a direct connection to the spectrometer preamplifier. The B1 homogeneity of the WAND was evaluated by using the double angle method (18).
Figure 1d:
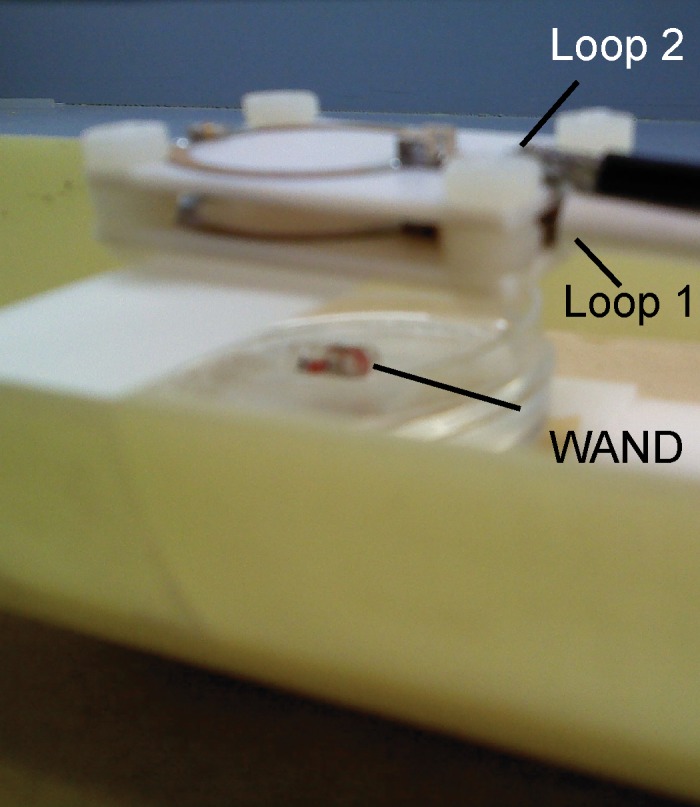
(a) WAND device implanted within an animal couples inductively to two external loops (Loop 1 and Loop 2). Loop 2 couples power via the pumping signal to the WAND at ω3 to convert the weak MR signal at ω1 into an amplified output at the idler frequency ω2. The idler current at ω2 mixes again with the pumping signal at ω3 to amplify the current at ω1, which couples out to loop 1 connected to the MR imaging system. (b) Schematic of the WAND implemented as a double resonant circuit coupled inductively to the external loops. (c) Photograph of the PDMS-encapsulated WAND device (see text for discussion of L1, C1, L2, and C2). (d) The phantom test arrangement with the WAND device placed on the surface of a 1% agarose gel. Loop 1 and loop 2 are both 22 mm in diameter and are mounted concentrically above the gel.
In Vivo Experiments
Animal experiments and surgery were approved by the National Institutes of Health/National Institute of Neurologic Disorder and Stroke Animal Care and Use Committee. Five male Sprague–Dawley rats (200–300 g) were anesthetized with isoflurane (5% induction, 1.5–2.0% maintenance), and an incision was made on the lateral abdomen of each rat to expose the left kidney. The resonator was fixed to the medial surface of the kidney by using a mixture of 10% (weight/volume) type A gelatin solution and 1% (weight/volume) glutaraldehyde (Sigma-Aldrich). The kidney was then returned to the abdominal cavity, and the incision was closed with an absorbable suture. An antibiotic ointment was applied to the wound, and the analgesic ketoprofen (5 mg/kg) was administered during recovery. The rats were treated with trimethoprim and sulfamethoxazole from 1 day ahead of the surgery until the wound was healed, approximately 7 days after surgery, before they were taken for imaging.
Each rat was placed under ventilation with 2% isoflurane and secured in the supine position with a restraint belt wrapped about its abdomen to reduce respiratory-induced motion. Coaxial, 22-mm-diameter pick-up and pumping loops were situated externally beneath the left kidney. With the rat immobilized in its cradle inside the imager, a low-spatial-resolution, multisection 2D FLASH image was first acquired to locate the WAND. Subsequently, both T1- and T2*-weighted high-spatial-resolution gradient-refocused echo (GRE) images were acquired in the vicinity of the parametric resonator, with the acquisition parameters summarized in the Table. The readout direction was aligned approximately perpendicularly to the pick-up loop, so that the intense surface signal directly detected by the external pick-up loop could be filtered out. Among the five rats used in this study, two were imaged both before and after administration of a bolus of gadopentetate dimeglumine (Magnevist; Bayer, Berlin, Germany) at 5 μmol per kilogram of body weight by using a T1-weighted GRE sequence. Two others were imaged both before and after administration of a bolus of cationized ferritin (Sigma-Aldrich) at 113 mg/kg by using a T2*-weighted GRE sequence. The fifth rat was first infused with gadopentetate dimeglumine (5 μmol/kg) followed by administration of cationized ferritin (113 mg/kg) and imaged with both T1-weighted and T2*-weighted sequences during the intervals between contrast agent administration. All contrast agents were administered through tail veins. Dilute gadopentetate dimeglumine concentrates in the renal tubules during the urine formation (19) and increases the signal intensity of the image, whereas cationized ferritin binds specifically to the basement membrane of glomeruli (20) and reduces the image intensity. To quantitatively identify contrast-enhanced regions, the intensity value of each pixel was compared with the local average and their difference was divided by the noise floor to obtain the deviation-to-noise ratio (DNR). The threshold for region identification was chosen to be twice the standard deviation of DNR on non–contrast-enhanced (hereafter, precontrast) images, so that regions enhanced by the contrast agent can be identified at the 95% confidence level.
Acquisition Parameters for in Vivo Images

Results
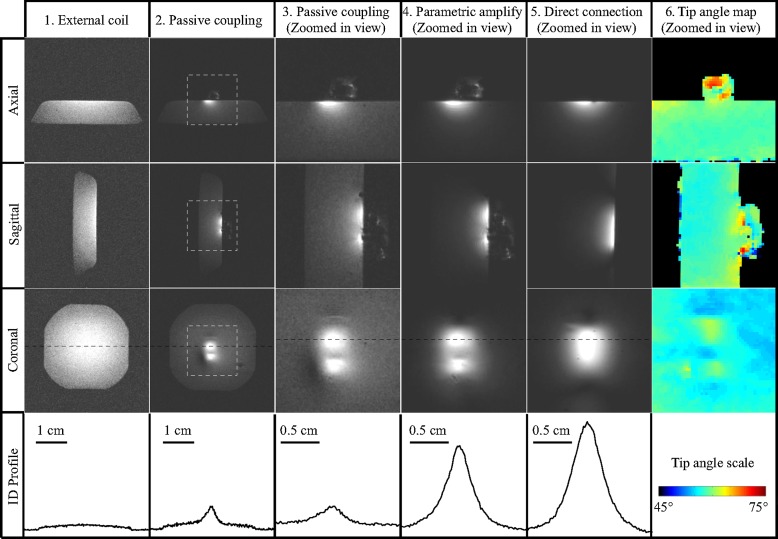
Figure 2 shows 2D FLASH images acquired with different detection configurations. In column 2, images acquired with the unamplified resonator (column 2) were 12 dB more sensitive than those acquired with only the external pick-up loop (column 1) owing to the stronger, proximal B1 field of the local coil (21,22). The images in columns 3 and 4 show that the detection sensitivity was further enhanced by 9 dB when the parametric resonator provided a power gain of 23 dB. Further increase in gain level did not provide better sensitivity, because at 23 dB, the noise originating in the small detector dominated that of the external pick-up loop. Comparing the signal intensities of columns 4 and 5, the WAND retained 72% of the sensitivity obtained by a directly connected surface coil of similar size (column 5), even though the WAND was separated from the external pick-up loop by a distance much larger than its own dimension. The loss in sensitivity results from the noise added by parametric amplification (23). Since the WAND is decoupled from the transmit field by a combination of static frequency offset (4 MHz) and dynamic resonance modulation, there was little B1 distortion around the resonator, as evidenced by the homogeneous B1 profile of the transmit coil in column 6.
Figure 2:
FLASH 2D images (476/4.9, 30° flip angle, 4 × 4 cm2 FOV, 0.2 mm section thickness, 256 × 256 matrix) acquired in three orientations from the gel phantom. Column 1 images were acquired with the external pick-up loop only, separated from the gel surface by 15 mm. Column 2 images were acquired with passive coupling to the resonator but without application of pumping power. Zoomed-in views of the image regions defined by the square are shown in column 3. Column 4 shows zoomed-in views acquired with parametric amplification. Column 5 shows images acquired from a sample coil of the same dimension as the parametric resonator and having a direct connection to the MR receiver. Column 6 shows tip angle maps obtained with the double angle method (18), acquired with 60° and 120° excitations in the absence of pumping power, with repetition time of 5 seconds and echo time of 3 msec (remaining parameters same as above). One-dimensional intensity profiles in the bottom row are taken along the black dashed lines shown on the coronal sections in the third row to have the same horizontal scale. Their vertical axes are scaled to the same noise level on the images, so that their heights are a measure of MR sensitivity.
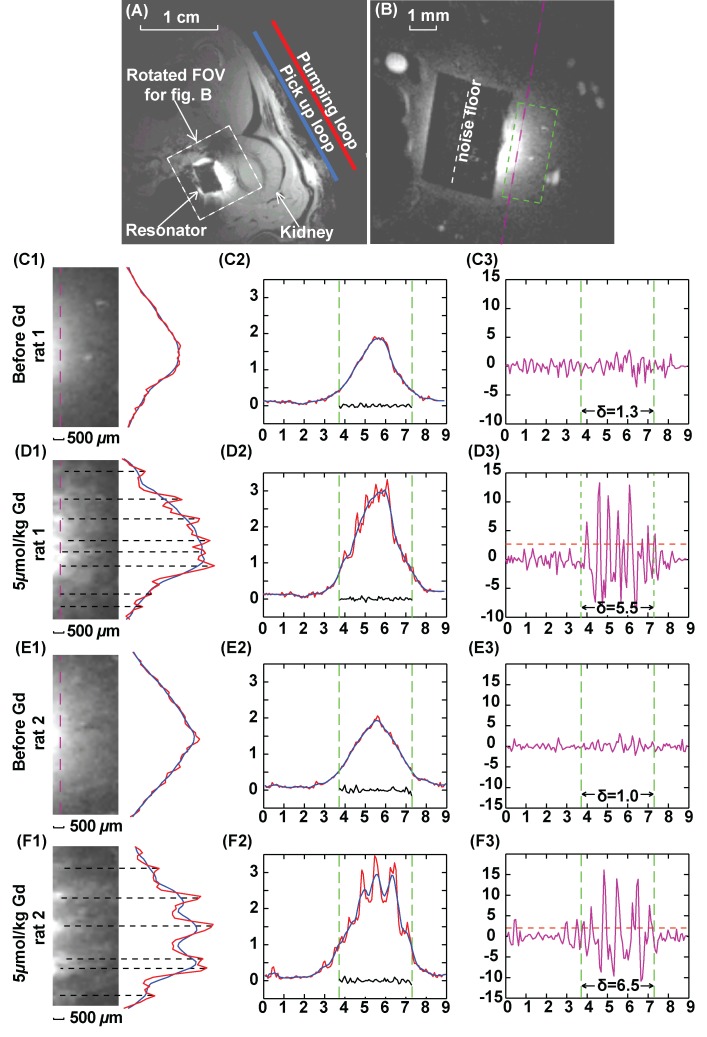
Figure 3, A, shows a low-spatial-resolution axial image acquired from the external pick-up loop and WAND device without applying any pumping power. Even without parametric amplification, the WAND device shows higher local sensitivity from inductive coupling to the external coil (21). Figure 3, B, shows a high-spatial-resolution T1-weighted image obtained with the pumping power adjusted to 0.3 dB below the oscillation threshold. Images with good sensitivity at an in-plane resolution of 70 μm and section thickness of 200 μm were obtained in 3.2 minutes. Before the injection of gadopentetate dimeglumine, little intracortical contrast enhancement was observed in the renal cortex, except for the blood vessels, which appeared as bright spots on the zoomed-in image in Figure 3, C1. Twenty minutes after injection of a low-dose bolus of gadopentetate dimeglumine at 5 μmol/kg, bright strips appeared on the image in Figure 3, D1, as gadopentetate dimeglumine was filtered out of blood and became sufficiently concentrated inside renal tubules (19). This contrast enhancement persisted for the entire imaging session, possibly due to slow excretion of gadopentetate dimeglumine for a rat under deep anesthesia. The contrast enhancement within the renal cortex is quantitatively illustrated by the one-dimensional intensity profile on Figure 3, D2. When compared with Figure 3, C2, the red curve of Figure 3, D2, has multiple peaks with intensities higher than the local average (blue). The DNR can be calculated by dividing the difference between the red and blue curves with the standard deviation of the noise floor. This DNR curve has an almost flat profile before the injection of contrast agent (Fig 3, C3), which indicates little intrinsic T1 contrast. After the injection of gadopentetate dimeglumine, many distinct peaks appeared on Figure 3, D3, that exceeded the threshold line (orange dashed line), which was set as twice the standard deviation of the DNR from precontrast images (Fig 3, C3). This threshold was chosen to identify regions enhanced by the contrast agent with 95% confidence level. Figure 3, E1, shows an image from a different rat before injection of contrast agent. Again, there was high contrast enhancement in the renal cortex after the injection of gadopentetate dimeglumine (Fig 3, F1). For this second rat, the DNR of Figure 3, E3, has similar standard deviation to that of Figure 3, C3, and the same threshold can be applied to identify the contrast-enhanced image segments.
Figure 3:
Axial T1-weighted GRE images of rat kidney. A, Low-spatial-resolution image acquired without parametric amplification (357/6, 30° flip angle, one signal acquired, 156 × 156 μm2 in-plane resolution, 4 × 4 cm2 FOV, 1 mm section thickness). B, High-spatial-resolution image, with FOV defined by the white dashed box in A (37.4/3.6, 40° flip angle, 70 × 70 μm2 in-plane resolution, 9 × 9 mm2 FOV, 0.2 mm section thickness, 40 signals acquired; experiment time, 3.2 min). The black rectangular region in the center of B is the PDMS-coated resonator. C–F, Column 1 shows 1.5 × 3.5 mm2 region of interest defined by green dashed box in B and positioned 0.5 mm from the edge of the resonator. Column 2 shows one-dimensional intensity profiles along the pink dashed line in B with an extended width of 9 mm. Red = unsmoothed profile, blue = smoothed profile. Smoothing was done by averaging image intensity over seven adjacent pixels. Green dashed line = edges of the resonator. Noise plotted within the green lines is taken along the white dashed line in B through the center of the coated resonator where there is little background signal. Column 3 shows DNR for each one-dimensional profile, obtained by dividing the difference between image intensity for each pixel and the local average with the standard deviation of noise floor defined in B. For each plot, horizontal axis is in millimeters and vertical axis is a dimensionless unit. Standard deviation of DNR is evaluated within the region of interest defined by the green dashed line. Threshold (dashed orange) lines for peak identification in D3 and F3 are defined by twice the standard deviation of DNR in C3 and E3, respectively. Peaks above the threshold lines in D3 and F3 are labeled by black dashed lines in D1 and F1.
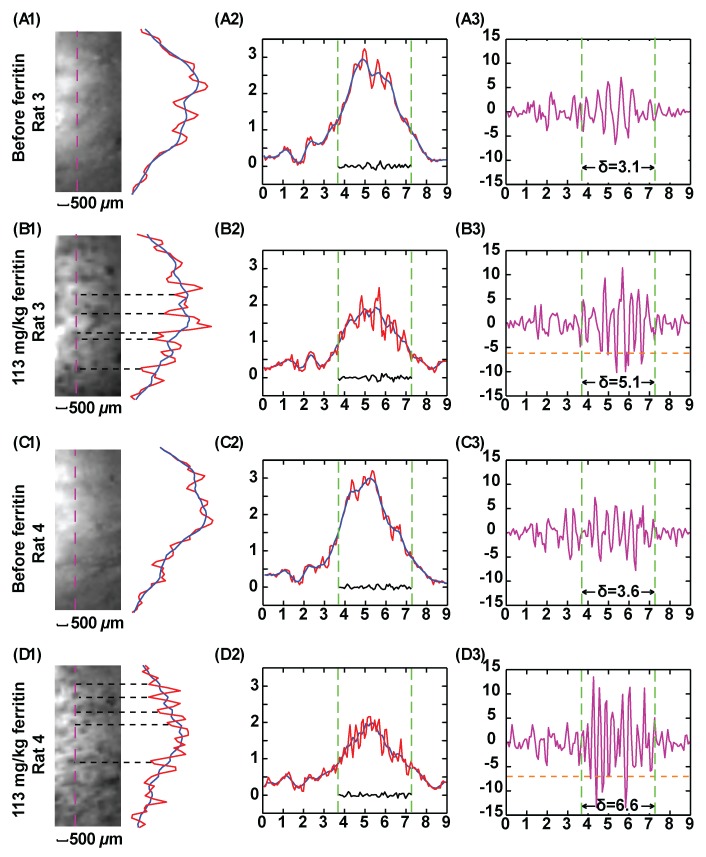
Previous reports have demonstrated that cationized ferritin is a good T2* contrast agent with which to visualize glomeruli ex vivo (20,24), and the WAND technology is used here to observe glomeruli in vivo with higher spatial resolution. The experimental set-up in Figure 4 is the same as for the T1-weighted images in Figure 3, and high-spatial-resolution T2*-weighted images were acquired to visualize glomeruli. As is shown in Figure 4, A, and Figure 4, C, the native kidney has some intracortical contrast enhancement on T2*-weighted images, probably due to the dephasing effect of venous blood (25). Thirty minutes after bolus injection of cationized ferritin at 113 mg/kg, additional contrast enhancement appears as dark spots, as can be seen in Figure 4, B1, and Figure 4, D1. These dark spots have an average diameter of 150 μm and adjacent spots are separated by an average distance of approximately 400 μm, which is in reasonable agreement with the previous observation for glomeruli in perfused kidneys (20). Because iron-rich ferritin particles (13 nm) specifically bind to the glomeruli basement membrane and dephase the surrounding signal, each black dot can be identified as an individual glomerulus. Plots for the DNR in the third column quantitatively identify image segments in kidneys both before and after ferritin injection. As indicated in Figure 5, B3, and Figure 5, D3,, many glomeruli spots can be identified by means of values that are more negative than twice the standard deviation of the DNR of the native kidney.
Figure 4:
T2*-weighted GRE kidney images acquired with parametric amplification (58/10, 20° flip angle, 9 × 9 mm2 FOV, 0.2 mm section thickness, 70 × 70 μm2 in-plane resolution, 40 signals acquired; experiment time, 5.8 min). Column 1 images show 3.5 × 1.5 mm2 region of interest approximately 0.5 mm away from the edge of the resonator. Column 2 shows one-dimensional intensity profiles along pink dashed line defined in the region of interest. Red = unsmoothed profile, blue = smoothed profile. Smoothing was done by averaging image intensity over seven adjacent pixels. One-dimensional intensity profiles are displayed along an extended region of 9 mm. Green dashed line = vertical boundary of the region of interest. Column 3 shows DNR for each one-dimensional intensity profile in column 2, obtained by dividing the difference between image intensity for each pixel and the local average with the noise floor as defined in Figure 3. For each plot, standard deviation of DNR is evaluated within the region of interest defined by the green line. The threshold (dashed orange) lines in B3 and D3 are defined by twice the standard deviation in A3 and C3, respectively. The peaks below the threshold lines in B3 and D3 are labeled by black dashed lines in B1 and D1. These peaks correspond to glomeruli spots darkened by cationized ferritin that specifically bind to the basement membrane.
Figure 5:
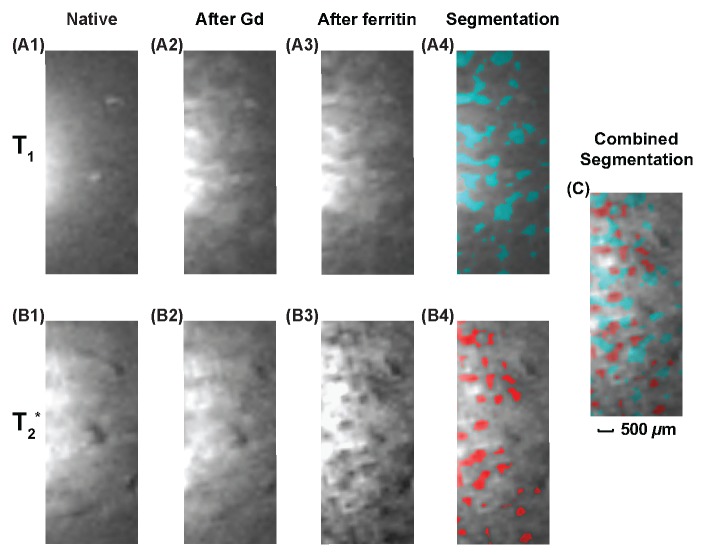
Kidney images obtained with the combined use of gadopentetate dimeglumine and cationized ferritin. Top row: T1-weighted images (37.4/3.6, 40° flip angle, 9 × 9 mm2 FOV, 0.2 mm section thickness, = 70 × 70 μm2 in-plane resolution, 40 signals acquired; experiment time, 3.2 min). Bottom row: T2*-weighted GRE images (58/10, 20° flip angle, remaining parameters as for T1-weighted images; experiment time, 5.8 min). A first set of images was acquired before injection of contrast agents (column 1). A second set was acquired after injection of gadopentetate dimeglumine at a bolus of 5 μmol/kg (column 2). A third set was acquired after subsequent injection of cationized ferritin at a bolus of 113 mg/kg (column 3). Green regions in A4 have DNR greater than twice the standard deviation of DNR in A1, and red regions in B4 have DNR ratio more negative than twice the standard deviation of DNR in B1. C, Image is overlaid view of A4 and B4, which is indicative of the interleaved distribution pattern of glomeruli and renal tubules.
In Figure 5, gadopentetate dimeglumine was administered together with cationized ferritin to obtain both positive and negative contrast enhancement to distinguish renal tubules from glomeruli. Before injection of any contrast agent, there is some intrinsic contrast in the renal cortex, such as from blood vessels, which appear as bright spots on T1-weighted images (Fig 5, A1) and dark lines on T2*-weighted images (Fig 5, B1). The different high signal intensity on the left of each image is an artifact due to near field effects. Twenty minutes after bolus injection of gadopentetate dimeglumine, bright ribbons appear on T1-weighted images, which are tentatively assigned as renal tubules (Fig 5, A2). At low concentration of gadopentetate dimeglumine, there is little additional contrast enhancement on the T2*-weighted images, as indicated in Figure 5, B2. However, 30 minutes after injection of cationized ferritin, glomeruli show up as dark spots on T2*-weighted images (Fig 5, B3). T1 contrast enhancement, on the other hand, remains approximately the same, as can be seen in Figure 5, A3. In the segmented images in column 4, the cyan regions on the T1-weighted image (Fig 5, A4) have a DNR larger than twice the standard deviation of the DNR on the precontrast image (Fig 5, A1), and the red regions on the T2*-weighted image (Fig 5, B4) have a DNR that is more negative than twice the standard deviation of the DNR on the precontrast image (Fig 5, B1). For clarity of display, precontrast images of the kidney in Figure 5, A1, and Figure 5, B1, were also segmented, and segmented regions from those images were excluded from the color labeling. In Figure 5, C, glomeruli and putative renal tubules are visualized together by overlaying Figure 5, A4, with Figure 5, B4. The interleaved distribution pattern indicates that the spatial resolution obtained with the WAND is adequate to resolve the kidney’s internal morphology in vivo.
Discussion
In our work, a millimeter-scale WAND has been fabricated and implanted onto the medial surface of the rodent kidney. Although the detection region is deeply buried inside the body, the WAND has adequate sensitivity to observe individual glomeruli and renal tubules in vivo. There are several unique features of the WAND in this application. First, it is an entirely wireless device that does not require an internal power supply. Second, it has very low power consumption. In our study, 10 mW of power applied to the external pumping loop was sufficient to drive a WAND implanted at a depth of 1.5 cm. For future human applications, the device would likely be used at much lower field strengths, where the pumping signal will have better penetration properties at lower frequencies. A third feature of the WAND resonator is that it can be “tuned” wirelessly by adjusting the frequency of the pumping signal. When the pumping power is turned off, the lower resonance of the WAND shifts several megahertz below the Larmor frequency, reducing its coupling with the transmit field. The WAND’s coupling with transmit coil is further reduced because its resonance frequency is strongly modulated by the transmit field due to the nonlinearity of the zero-biased varactor. Fourth, WAND provides sensitivity comparable to direct connection to the local detection coil when the gain is sufficient to overcome the noise from the external pick-up loop. Fifth, the WAND is coated with PDMS with excellent biocompatibility; it is mechanically and electrically stable inside the rat’s abdomen for at least 6 months.
There are certain limitations of this study. First, parametric amplification is somewhat more noisy than a modern preamplifier (23). As is implemented here, WAND retains 72% of the sensitivity obtained by an equally sized surface coil directly connected to a transistor-based amplifier. However, WAND is still more sensitive than a passive resonator and the external pick-up loop under weak coupling conditions, when the sensitivity loss due to parametric amplification is much smaller than the sensitivity gain due to local signal detection. Compared with an unamplified resonator, WAND remains more sensitive at larger distance separations even when the attainable gain is not sufficient to preserve the local detector’s signal-to-noise ratio (Fig E2 [online]). Second, the MR contrast enhancement observed by means of the WAND at high spatial resolution is not entirely understood. Further study combined with tissue histologic examination is needed to confirm the assignment of glomeruli and renal tubules. Third, WAND is an invasive device that has a limited FOV, similar to other intravascular or intracavity coils. But because of its wireless capability, WAND will find potential applications where a chronic monitoring device is needed to observe selected regions on transplant organs or tissue engineered constructs. Since this double-resonant device has a simple construction, the possibility exists for further miniaturization, so that it could be less invasive as an interventional device into a blood vessel or as an ingestible device inside the digestive tract.
In summary, the WAND enables wireless amplification of MR signals for sensitive detection of deep-lying internal organs. It may also find applications with catheters, where the radiofrequency heating along wires has limited their use as detection devices.
Advances in Knowledge.
• A millimeter-scale wireless amplified nuclear MR detector (WAND) with a power gain of 23 dB has been developed to enhance the detection sensitivity of deep-lying internal organs.
• Superior sensitivity of the local detection coil can be maintained without wired connections because the signal is amplified in situ by a wirelessly powered amplifier that is integrated with the detection coil.
• This new detector can obtain images with 70-μm in-plane resolution and 200-μm section thickness to visualize ferritin-enhanced glomeruli in the rodent kidney.
Implication for Patient Care.
• The WAND may potentially be useful for intravascular or intestinal applications where the detector can be placed close to the tissue of interest; applications may also be found in bioengineered tissue constructs where the detector can be imbedded.
Disclosures of Conflicts of Interest: C.Q. No relevant conflict of interest to disclose. X.Y. No relevant conflict of interest to disclose. D.Y.C. No relevant conflict of interest to disclose. S.D. No relevant conflict of interest to disclose. N.B. No relevant conflict of interest to disclose. N.P. No relevant conflict of interest to disclose. Y.C. No relevant conflict of interest to disclose. S.B. No relevant conflict of interest to disclose. K.B. No relevant conflict of interest to disclose. J.M.B. No relevant conflict of interest to disclose. A.K. No relevant conflict of interest to disclose.
Supplementary Material
Received July 5, 2012; revision requested August 13; revision received September 26; accepted October 30; final version accepted November 13.
Funding: This research was supported by the National Institutes of Health (grant Z01999999).
Abbreviations:
- DNR
- deviation-to-noise ratio
- FLASH
- fast low-angle shot
- FOV
- field of view
- GRE
- gradient refocused echo
- PDMS
- polydimethylsiloxane
- 2D
- two-dimensional
- WAND
- wireless amplified nuclear MR detector
References
- 1.Hoult DI, Richards RE. The signal-to-noise ratio of the nuclear magnetic resonance experiment. 1976. J Magn Reson 2011;213(2):329–343 [DOI] [PubMed] [Google Scholar]
- 2.Benveniste H, Blackband S. MR microscopy and high resolution small animal MRI: applications in neuroscience research. Prog Neurobiol 2002;67(5):393–420 [DOI] [PubMed] [Google Scholar]
- 3.Roemer PB, Edelstein WA, Hayes CE, Souza SP, Mueller OM. The NMR phased array. Magn Reson Med 1990;16(2):192–225 [DOI] [PubMed] [Google Scholar]
- 4.Sodickson DK, Manning WJ. Simultaneous acquisition of spatial harmonics (SMASH): fast imaging with radiofrequency coil arrays. Magn Reson Med 1997;38(4):591–603 [DOI] [PubMed] [Google Scholar]
- 5.Pruessmann KP, Weiger M, Scheidegger MB, Boesiger P. SENSE: sensitivity encoding for fast MRI. Magn Reson Med 1999;42(5):952–962 [PubMed] [Google Scholar]
- 6.Griswold MA, Jakob PM, Heidemann RM, et al. Generalized autocalibrating partially parallel acquisitions (GRAPPA). Magn Reson Med 2002;47(6):1202–1210 [DOI] [PubMed] [Google Scholar]
- 7.Albert MS, Cates GD, Driehuys B, et al. Biological magnetic resonance imaging using laser-polarized 129Xe. Nature 1994;370(6486):199–201 [DOI] [PubMed] [Google Scholar]
- 8.Middleton H, Black RD, Saam B, et al. MR imaging with hyperpolarized 3He gas. Magn Reson Med 1995;33(2):271–275 [DOI] [PubMed] [Google Scholar]
- 9.Bouchard LS, Burt SR, Anwar MS, Kovtunov KV, Koptyug IV, Pines A. NMR imaging of catalytic hydrogenation in microreactors with the use of para-hydrogen. Science 2008;319(5862):442–445 [DOI] [PubMed] [Google Scholar]
- 10.Ardenkjaer-Larsen JH, Fridlund B, Gram A, et al. Increase in signal-to-noise ratio of > 10,000 times in liquid-state NMR. Proc Natl Acad Sci U S A 2003;100(18):10158–10163 [DOI] [PMC free article] [PubMed] [Google Scholar]
- 11.Olson DL, Peck TL, Webb AG, Magin RL, Sweedler JV. High-resolution microcoil 1H-NMR for mass-limited, nanoliter-volume samples. Science 1995;270(5244):1967–1970 [Google Scholar]
- 12.Sakellariou D, Le Goff G, Jacquinot JF. High-resolution, high-sensitivity NMR of nanolitre anisotropic samples by coil spinning. Nature 2007;447(7145):694–697 [DOI] [PubMed] [Google Scholar]
- 13.Martius S, Heir O, Vester M, et al. Wireless local coil signal transmission using a parametric upconverter [abstr]. In: Proceedings of the Seventeenth Meeting of the International Society for Magnetic Resonance in Medicine. Berkeley, Calif: International Society for Magnetic Resonance in Medicine, 2009; 2934 [Google Scholar]
- 14.Qian C, Murphy-Boesch J, Dodd S, Koretsky A. Sensitivity enhancement of remotely coupled NMR detectors using wirelessly powered parametric amplification. Magn Reson Med 2012;68(3):989–996 [DOI] [PMC free article] [PubMed] [Google Scholar]
- 15.Collin RE. Parametric amplifiers. In: Foundations for microwave engineering. 2nd ed. New York, NY: McGraw-Hill, 1966; 541–570 [Google Scholar]
- 16.Syms RR, Solymar L, Young IR. Three-frequency parametric amplification in magneto-inductive ring resonators. Metamaterials (Amst) 2008;2(2-3):122–134 [Google Scholar]
- 17.Schnall MD, Lenkinski RE, Pollack HM, Imai Y, Kressel HY. Prostate: MR imaging with an endorectal surface coil. Radiology 1989;172(2):570–574 [DOI] [PubMed] [Google Scholar]
- 18.Cunningham CH, Pauly JM, Nayak KS. Saturated double-angle method for rapid B1+ mapping. Magn Reson Med 2006;55(6):1326–1333 [DOI] [PubMed] [Google Scholar]
- 19.Choyke PL, Frank JA, Girton ME, et al. Dynamic Gd-DTPA-enhanced MR imaging of the kidney: experimental results. Radiology 1989;170(3 Pt 1):713–720 [DOI] [PubMed] [Google Scholar]
- 20.Bennett KM, Zhou H, Sumner JP, et al. MRI of the basement membrane using charged nanoparticles as contrast agents. Magn Reson Med 2008;60(3):564–574 [DOI] [PMC free article] [PubMed] [Google Scholar]
- 21.Schnall MD, Barlow C, Subramanian VH, Leigh JS., Jr Wireless implanted magnetic-resonance probes for in vivo NMR. J Magn Reson 1986;68(1):161–167 [Google Scholar]
- 22.Burl M, Coutts GA, Young IR. Tuned fiducial markers to identify body locations with minimal perturbation of tissue magnetization. Magn Reson Med 1996;36(3):491–493 [DOI] [PubMed] [Google Scholar]
- 23.Syms RR, Floume T, Young IR, et al. Parametric amplification of magnetic resonance images. IEEE Sens J 2012;12(6):1836–1845 [Google Scholar]
- 24.Beeman SC, Zhang M, Gubhaju L, et al. Measuring glomerular number and size in perfused kidneys using MRI. Am J Physiol Renal Physiol 2011;300(6):F1454–F1457 [DOI] [PubMed] [Google Scholar]
- 25.Terrier F, Lazeyras F, Posse S, et al. Study of acute renal ischemia in the rat using magnetic resonance imaging and spectroscopy. Magn Reson Med 1989;12(1):114–136 [DOI] [PubMed] [Google Scholar]
Associated Data
This section collects any data citations, data availability statements, or supplementary materials included in this article.


