

Abstract
One of the key questions about genomic alterations in cancer is whether they are functional in the sense of contributing to the selective advantage of tumor cells. The frequency with which an alteration occurs might reflect its ability to increase cancer cell growth, or alternatively, enhanced instability of a locus may increase the frequency with which it is found to be aberrant in tumors, regardless of oncogenic impact. Here we’ve addressed this on a genome-wide scale for cancer-associated focal deletions, which are known to pinpoint both tumor suppressor genes (tumor suppressors) and unstable loci. Based on DNA copy number analysis of over one-thousand human cancers representing ten different tumor types, we observed five loci with focal deletion frequencies above 5%, including the A2BP1 gene at 16p13.3 and the MACROD2 gene at 20p12.1. However, neither RNA expression nor functional studies support a tumor suppressor role for either gene. Further analyses suggest instead that these are sites of increased genomic instability and that they resemble common fragile sites (CFS). Genome-wide analysis revealed properties of CFS-like recurrent deletions that distinguish them from deletions affecting tumor suppressor genes, including their isolation at specific loci away from other genomic deletion sites, a considerably smaller deletion size, and dispersal throughout the affected locus rather than assembly at a common site of overlap. Additionally, CFS-like deletions have less impact on gene expression and are enriched in cell lines compared to primary tumors. We show that loci affected by CFS-like deletions are often distinct from known common fragile sites. Indeed, we find that each tumor tissue type has its own spectrum of CFS-like deletions, and that colon cancers have many more CFS-like deletions than other tumor types. We present simple rules that can pinpoint focal deletions that are not CFS-like and more likely to affect functional tumor suppressors.
Introduction
In human cancer it is generally the case that highly recurrent point mutations, such as those occurring in KRAS or TP53, contribute to the selective advantage of tumor cells. However the case is less clear with DNA copy number alterations, where some frequent alterations such as amplification of the ERBB2/HER2 locus clearly provide a selective advantage, whereas others like the frequent deletions of DNA at the telomeric ends of chromosomes likely do not. This means that alteration frequency alone is not sufficient to determine whether or not a given DNA copy number alteration directly impacts oncogenicity. Nowhere has this been more difficult to tease out than for candidate tumor suppressor genes located within common fragile sites. Common fragile sites are found throughout the human genome and are prone to DNA breaks when the cell is exposed to partial replication stress [1], [2]. Cancer cells frequently show hemizygous or homozygous deletions at these loci and in addition there are often expression alterations of the underlying gene [3]. Tumor suppressor functions have been found for some of these genes, including WWOX, FHIT, and PARK2, and these functions include growth suppressive effects of restoring expression in deficient cell lines and loss-of-function mutations leading to enhancement of carcinogen-induced or genetically-engineered cancer in mice [3], [4], [5]. Other studies have made observations that do not support a tumor suppressor role for these genes, including the inability to detect inactivating point mutations [6], [7] and the frequent failure of deletions to affect underlying RNA or protein expression [7], [8], both of which are common features of other tumor suppressor genes.
Previously we discovered and validated 26 oncogenes by functionally screening sets of genes that are focally amplified in human cancer and similarly have validated 10 tumor suppressor genes that were found in focal deletions affecting liver cancer [9], [10], [11], [12], [13], [14], [15]. We began this study with the goal of validating two tumor suppressor gene candidates that were focally deleted at high frequency particularly in colorectal cancer, A2BP1 and MACROD2. In contrast to the results obtained by screening focal deletions in liver cancer, we did not find that these genes were tumor suppressors, which prompted us to take a genome-wide look at the properties of focally deleted genes in a large dataset of DNA copy number alterations affecting over 1000 cancer samples. This led to the discovery of two classes of focal deletions in human cancer, one that resembles deletions affecting common fragile sites and the other that resembles deletions affecting CDKN2A/B. Since then, a genome-wide examination of small homozygous deletions in 270 human cancer cell lines has been reported that also finds two classes of focal deletions [16], and while our conclusions are largely similar to theirs, there are some important distinctions and nuances about the two classes and additional findings which are described below.
Results
Common Sites of Focal Deletions in Human Cancer
Our dataset was generated by array CGH analysis of 850 primary tumors and 304 cancer cell lines or xenografts of diverse tissue types including brain, breast, colon, liver, lung, ovarian, pancreatic, prostate, and skin (melanoma) (Table S1). Following data normalization and segmentation we detected a total of 10,835 focal deletions (<10 Mb) in these 1,154 samples (Table S2). The average size of deletions, both focal and large, is the shortest at telomeres as expected (Figure 1A, Figure S1 in File S1) and therefore a substantial percentage (13%) of focal deletions involved telomeric ends, particularly both ends of the X chromosome and the p arm of chromosome 4 (Table S3). Figure 1 shows the distribution of the other 87% of focal deletions across the genome, binned into 2-Mb intervals. There were five loci that showed focal deletion frequencies greater than 5% and they corresponded to the CDKN2A/B, FHIT and WWOX loci, known or suspected tumor suppressor genes, and the MACROD2 and A2BP1 loci (Figure 1B). Deletions affecting A2BP1 (also known as RBFOX1) were very frequent in colorectal cancer (21%) but considerably less frequent or absent in other tumor types (1–4% in ovarian, liver and lung cancers and absent in breast, melanoma, prostate, and pancreatic cancers). Similarly, deletions affecting MACROD2 were most frequent in colorectal cancer (17%) but considerably less frequent or absent in other tumor types (0.5–3% in breast, liver and lung cancers and absent in ovarian, melanoma, prostate, and pancreatic cancers). Frequent deletions affecting A2BP1 and MACROD2 in colon cancer have been observed by others [17], [18].
Figure 1. Sites in the genome of frequent cancer focal deletions.

(A) Average DNA segment size as a function of position on chromosome 1 is displayed. (B) the 9,401 focal deletions that were not telomeric were binned into 2 Mb intervals and used to generate a frequency distribution across the genome. The most frequently affected genomic interval corresponded to the CDKN2A/B locus and the next six most frequently affected genomic intervals are indicated with red arrows and the relevant gene.
Examination of A2BP1 and MACROD2 as Potential Tumor Suppressor Genes
We examined the effects of A2BP1 and MACROD2 deletions on underlying gene expression in colon cancers and normal colon tissues. RNA expression of A2BP1 could not be detected by real-time RT-PCR in any of the normal colon tissues, tumors, or cancer cell lines that we examined (Figure 2A). To help confirm this negative result, we designed three additional probes for real-time RT-PCR and standard RT-PCR, but in each case failed to detect A2BP1 in colon samples, despite being able to readily detect its expression in the brain (Figure 2A). These results are consistent with a prior report that expression of A2BP1/RBFOX1, which encodes an alternative splicing factor, is restricted to the heart, muscle, and brain [19]. Although we cannot rule out very low-level but physiologically relevant expression of A2BP1 in colon samples, we did not observe any growth suppressive or tumor suppressive effects of expressing A2BP1 in colon cancer cell lines harboring deletions (Figure 2B). Additionally, although MACROD2 is expressed in colon cancer cells, deletions had no effect on expression as measured by quantitative RT-PCR using four different probes including three within coding sequences and one in the 3′ untranslated region. Nor did deletions have any appreciable effect on expression of MacroD2 protein (Figure 2C). Although seemingly paradoxical, these deletions all occurred within introns of MACROD2 and therefore would not necessarily be expected to affect expression.
Figure 2. Expression and tumor suppressive properties of A2BP1 and MACROD2.

(A) Threshold PCR cycles for RT-PCR detection of ACTB (control) and A2BP1 in two different samples of normal brain tissue, four different samples of normal colon tissue, and 19 colon cancer cell lines. Values below 40 indicate no signal detection. (B) The effect of forced ectopic expression of A2BP1 on tumor formation of colon cancer cell line HCT-15, which harbors a 250-kb deletion within A2BP1. Detection of expression by immunoblotting using a polyclonal antibody that recognizes the A2BP1 protein [38] is shown in the insert. Lack of tumor suppressive effects were also observed for the colon cancer cell lines HCT-116 and SW480, both harboring deletions in A2BP1. (C) The expression of MACROD2 in colon cancer cell lines as determined by TaqMan RT-PCR using four different probes (three to coding sequences and one to a 3′ UTR, all unaffected by deletions), comparing cell lines that harbor deletions within the MACROD2 gene to ones that do not. Relative expression was calculated by the ΔCT method using GADPH expression levels as the reference. (D) The expression of MACROD2 in colon cancer cell lines as determined by immunoblotting using an antibody to MacroD2.
Patterns of Deletions Affecting A2BP1, MACROD2, CDKN2A/B, and PTEN
We noted several differences in the types and patterns of deletions affecting A2BP1 and MACROD2 loci when compared to focal deletions affecting CDKN2A/B and PTEN loci (Figure 3). By examining all focal deletions (<10 Mb) that spanned a four Mb locus centered on the target gene, we found that deletions affecting the A2BP1 and MACROD2 loci were on average smaller (0.6 Mb vs. 1.6 Mb, p = 1.5e-04). Additionally, the deletions affecting the A2BP1 and MACROD2 loci were more separated and the majority did not converge upon a single common site of overlap, in contrast to CDKN2A/B and PTEN loci (Figure 3). We measured the degree to which each deletion was separate (non-overlapping) from other deletions (“Deletion Separation”, see Materials and Methods) and found that there was a significant difference between the A2BP1 and MACROD2 loci and the CDKN2A/B and PTEN loci (0.4 vs. 0.16, p = 0.03).
Figure 3. The boundaries of focal deletions that affect the A2BP1, MACROD2, CDKN2A/B, and PTEN genes.

Each of the four panels shows (top) an ideogram of the chromosome on which the featured gene is located and (below) an expanded view of a 4-Mb region centered on the featured gene, showing other genes in the area (location based on the UCSC Genome Browser). If the gene is large enough, the exon-intron structure and/or transcriptional direction of the gene are indicated. For most genes, particularly in panels C and D, the genes are shown as rectangles due to their smaller size. Shown below each expanded region are horizontal bars indicating the extent and boundaries of individual deletions in colon tumors (Panels A and B; A2BP1 and MACROD2, respectively), lung tumors (Panel C; CDKN2A/B), or multiple tumor types (Panel D; PTEN). The featured genes in Panels C and D are highlighted in green.
We then wanted to determine if these two distinctions between deletions affecting A2BP1 and MACROD2 loci on the one hand and CDKN2A/B and PTEN loci on the other hand held true when comparing deletions affecting known common fragile sites and recessive tumor suppressor genes from the Cancer Gene Census [20], [21]. In our dataset, there were 11 common fragile sites and 24 recessive tumor suppressor genes that contained a sufficient sample size of deletions (>14) for this statistical analysis (Table S4). Similar to what we observed above, in this larger set of loci the average deletion size affecting common fragile sites was significantly smaller than those affecting recessive tumor suppressors (0.6 Mb vs. 3.3 Mb, p = 9e-06, Figure 4A). Likewise, the “Deletion Separation” metric was significantly greater in common fragile sites than it was in recessive tumor suppressor genes (Figure 4B). This latter result suggests that deletions affecting these two groups arise by different mechanisms. Deletions in common fragile site genes can be induced by replicative stress and subsequent DNA damage and repair [22], deletions affecting CDKN2A/B have been suggested to arise from aberrant recombination or DNA repair by nonhomologous end-joining [23]. In support of the idea that these two types of deletions arise by separate mechanisms, we found that the frequency of co-occurrence of deletions in different common fragile site genes and co-occurrence of deletions in different tumor suppressor genes was greater than that of co-deletion of CFS and tumor suppressor genes (Figure 4C).
Figure 4. Deletion size and deletion separation can distinguish common fragile sites from tumor suppressor genes.
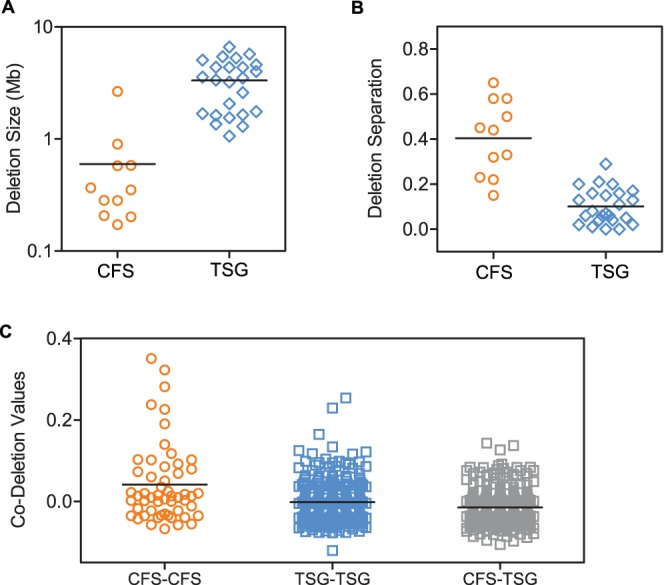
(A) Box and whisker plots for “Deletion Size,” which measures the median size of deletions within a 2-Mb window centered on the gene, common fragile site genes (orange) and tumor suppressor genes (blue) (B) Box and whisker plots for “Deletion Separation,” which measures the separation (non-overlapping) of deletions within a 2-Mb window centered on the gene, (C) The co-deletion tendency of common fragile site genes (orange) and tumor suppressor genes (blue) relative to the co-deletion of genes of different classes (gray).
Additional Properties that Distinguish Deletions Affecting Common Fragile Sites
We next wanted to determine whether the inability of deletions to affect expression of MACROD2 was a more generalizable observation that could be used to distinguish common fragile site-like genes from tumor suppressor genes. We determined the correlation of RNA expression and DNA copy number for 115 cancer samples where we had both gene expression profiling and ROMA aCGH data. Compared to the correlations of the tumor suppressor group, there was very little effect of DNA copy number on gene expression in the common fragile site group (p = .003, Figure 5A), indicating that this feature could be useful in predicting whether or not a given site of deletions was CFS-like. We then examined whether the average DNA copy number value was significantly different, which reflects the degree to which deletions were homozygous versus heterozygous. Even though there wasn’t a statistically significant difference between the average DNA copy number values (p = .09), there did appear to be greater range of lower values for the tumor suppressor group, indicating that some of these genes have more homozygous deletions than do common fragile site genes (Figure 5B).
Figure 5. Deletion properties that distinguish common fragile site genes from tumor suppressor genes.

Scatter dot plots of values for statistics that distinguish focal deletions affecting common fragile site (CFS) genes (orange) from tumor suppressor genes (blue). (A) “RNA/DNA Correlation,” which corresponds to the Pearson’s correlation coefficient of log2-transformed DNA copy number values and relative RNA expression values for the 115 tumor samples with both array CGH and RNA expression profiling data, (B) DNA Copy Number is the median value of segmented DNA copy number values. (C) Cell Line Proportion” which provides a relative measure of how frequently deletions for a given gene are found in cell lines rather than primary tumors. Panels (D) and (E) show the number of deletions found in each gene within a 10 Mb region centered on the MACROD2 locus (D) and TP53 and MAP2K4 loci (E). (F) Box and whisker plots of “Deletion Isolation,” which measures how frequently neighboring genes are deleted relative to the featured gene.
We also found that deletions affecting common fragile sites were more common in cancer cell lines than in primary tumors when compared to deletions affecting tumor suppressors (p = 7e-05, Figure 5C). This is particularly evident in breast cancer, where MACROD2 and FHIT are deleted in 28% and 15% of breast cancer cell lines, respectively, but either not at all (FHIT) or in only one out of 255 primary tumors (MACROD2) (Table S5). FHIT was co-deleted with MACROD2 in 75% of the cell lines with FHIT deletion, indicating that for certain breast cancer cell lines, replicative stress followed by DNA breakage and repair might occur during adaptation to cell culture and affect multiple common fragile site genes.
By looking at genome coordinate plots of focal deletion frequencies, we noted that the frequent deletions affecting MACROD2 were relatively isolated along the genome and that the frequency count fell precipitously to the genes immediately left and right of MACROD2 (Figure 5D). This was very distinct from the genome neighborhood of focal deletions affecting the tumor suppressor genes TP53 and MAP2K4, which both formed peaks of deletion counts but less dramatically in the context of genomic regions with a higher overall rate of deletions (Figure 5E). We wanted to determine whether this distinction was a generalizable feature that distinguished common fragile site genes from tumor suppressor genes, and developed a metric “Deletion Isolation” that measured how much the deletion frequency of a given gene was greater than neighboring genes. This metric was considerably higher in common site fragile genes than tumor suppressor genes (>40-fold, p = 0.00001) (Figure 5F).
Computational Analysis and Classification of Focal Deletions
We wanted to use these six properties to analyze deletions on a genome-wide scale. We restricted our attention to genes with sufficient deletions in order to obtain statistically meaningful results (>14 deletions; 4,823 genes). We first explored whether any of the six properties were redundant by determining if they were highly correlated with any of the other five. Although deletion size was moderately correlated with deletion separation (r = 0.39), all of the other pairwise correlations were negligible (ranging from −0.13 to 0.18), and we proceeded to include all six properties for unsupervised analysis. We then transformed the six properties using principal component analysis and plotted the 4,823 genes using the first three principal components. The resultant graph showed that the majority of genes were most similar to recessive tumor suppressor genes (Figure 6A). With one exception, common fragile site genes were well separated from the main group and were similar to only a small number of additional genes (Figure 6A). This result indicated that most genes that are targeted by focal deletions are similar to tumor suppressor genes, whereas considerably fewer genes are similar to common fragile site genes. To test this idea independently, we used supervised learning methods (support vector machine and random forest [RF]) to classify the 4,823 genes into CFS-like or tumor suppressor categories. The results of these two methods were significantly correlated (r = 0.72) and both classified most genes as tumor suppressor like, in agreement with the unsupervised analysis (Figure 5B). The three variables that were most important in the RF classification were deletion size, deletion separation, and deletion isolation (Table S6). Using just these three variables, we generated a new RF classifier that yielded results that were 99% identical with the original classifier, establishing these three properties as the most critical determinants as to whether a given pattern of focal deletions is CFS-like or tumor suppressor-like.
Figure 6. Genome-wide analysis and classification of focal deletions in cancer.

Genes that had 15 or more focal deletions (4,823) were analyzed by the unsupervised learning method of Principal Component Analysis (PCA) and classified by two supervised learning methods, Support Vector Machine (SVM) and Random Forest (RF). (A) Graph of the 4,826 genes based on their values for the first three principal components derived from the seven deletion properties that distinguish common fragile site genes from tumor suppressor genes. Known common fragile site genes are shown in blue, known tumor suppressors are shown in red, and all others are shown in green. Most known tumor suppressors are buried within the major group of genes, whereas the known common fragile site genes, with one exception (LARGE), are clearly separated from the major group of genes by their first and second principal component values. There are only a handful of other genes that are located near the known common fragile site genes. (B) Graphical representation of the classification of the 4,826 genes based on their probability of being common fragile site genes by Random Forest (y-axis) or Support Vector Machine (x-axis) classifiers. Both classifiers were trained on the 35 known CFS genes or tumor suppressors (Table S4). The probability of being a tumor suppressor is one minus the CFS probability. Most genes are clustered together in the lower left quadrant; therefore, both classifiers predict with high probability that most of these genes are tumor suppressors.
Validation of MACROD2 as a Common Fragile Site Gene
To test whether our classification could successfully predict new common fragile site gene genes, we examined whether induction of replicative stress in a colon cancer cell line can generate deletions in MACROD2 or A2BP1, which, together with the known common fragile site gene gene FHIT, are the three genes most frequently affected by focal deletions in colon cancer. We designed a custom tiling array for these three genes and then performed aCGH, comparing the original cell line DNA to DNA from eight different clones isolated after brief induction of replicative stress. Four out of eight clones showed deletions within MACROD2, and two out of eight clones showed deletions within FHIT (Figure 7). This establishes that MACROD2, which was not previously shown to be a common fragile site gene in lymphocytes, is indeed a common fragile site gene when assayed in a colon cancer cell line. The fact that MACROD2 was readily detected as a common fragile site gene in colon cancer cells but not in lymphocytes is consistent with prior evidence that different cell types show different profiles of common fragile sites [24].
Figure 7. Validation of MACROD2 as a common fragile site gene.

(A) A schematic of the experiment, which used a custom tiling array to determine if aphidicolin induction of replicative stress could generate focal deletions at three loci (A2BP1, MACROD2, and FHIT) in colon epithelial cancer cells. No deletions affecting A2BP1 were observed in the 8 examined clones; 4 out of 8 clones had deletions affecting MACROD2; and 2 clones had deletions affecting FHIT. (B) An example of an induced focal deletion affecting the MACROD2 locus. The x-axis represents an approximately 1-Mb region spanning MACROD2. The blue lines represent the normalized DNA copy number values, and the orange lines represent the segmented DNA copy number values. (C) An example of an induced focal deletion affecting FHIT. (D) An example of an unaffected locus (the HLA locus on chromosome 6p).
Different Tumor Types have Different Frequencies and Spectrums of Deletions within CFS-like Genes
Interestingly, we found that colon tumors were by far the most frequently affected by focal deletions in CFS-like genes, with deletion frequencies as high as 21% for A2BP1, 17% for MACROD2, 9% for FHIT and 9% for PARK2 (Figure 8A). None of the other nine tumor types were as frequently affected. Lung cancer was the next most affected, but curiously had a different spectrum of frequencies, with LRP1B being the most frequently deleted CFS-like gene at 4% (Figure 8A). Several cancers did not appear to be affected at all, including glioblastomas, CLL, and prostate cancers, and many had very low frequency of deletions of CFS-like genes, including breast cancer, which showed PARK2 as its most frequently deleted CFS-like gene at just above 2% (Figure 8A).
Figure 8. Deletion frequency of CFS-like genes in different tumor types and cancer cell lines.

(A) The frequency with which the indicated common fragile site or CFS-like gene is deleted in different primary tumors. (B) The frequency with which the indicated common fragile site or CFS-like gene is deleted in cancer cell lines.
The frequency and spectrum of deletions in CFS-like genes was different for all tumor types when comparing cell lines to primary tumors (Figure 8B). In colon cancer cell lines, deletions affected FHIT in over 60% of the cell lines compared to 9% of primary tumors. In breast cancer cell lines, FHIT was deleted in 10% of the samples but not at all in primary tumors (Figure 8B). It seems possible that this may reflect the plasticity of the genome at FRA3B (the FHIT fragile site) under culture conditions, and the same may hold true for the increased incidence of deletions in other CFS-like genes when comparing cell lines to primary tumors.
The Most Frequently Deleted Fragile Site-like Genes and Tumor Suppressor-like Genes
The ability to predict new tumor suppressors is more pertinent to cancer biology than the ability to predict new fragile site genes. We reasoned that those tumor suppressor-like genes most frequently affected by focal deletions would be amongst the strongest candidates (Table 1). Interestingly, focal deletions in only two of the top ten genes have been previously described (CDKN2A/B and MAP2K4 [25]). Of the other eight genes, one is a tumor suppressor that is known to be inactivated by other genetic mechanisms [26] (MEN1), and four are candidate tumor suppressors based on either mutational analysis (CSMD1 [27]), functional analysis (CDKN2AIP/CARF [28], MAD1L1 [29]), or cancer-specific promoter hypermethylation (RRAD [30]). On the other hand, two genes recently proposed to be tumor suppressors based on their focal deletion in cancer, PDE4D [31] and LRP1B [32], are amongst the top ten most frequently affected CFS-like genes and accordingly may not be functional tumor suppressors (Table 1).
Table 1. Predicted and validated fragile site genes and tumor suppressor genes ranked by focal deletion frequency.
| Tumor Suppressor Gene Probability | ||||||
| Gene Symbol | Random Forest | Support Vector Machine | Focal Deletion Frequencyc | Deletion Depthd | Chromosomal Location | Functione |
| Tumor suppressor genes: | ||||||
| CDKN2AIP/CARF a | 0.78 | 0.96 | 8% | 0.73 | 4q35.1 | p14ARF/p53 |
| CDKN2A/B | 0.96 | 0.96 | 8% | 0.28 | 9p21.3 | Cdk4/Rb1/p14ARF/p53 |
| MAD1L1 a | 0.97 | 0.95 | 7% | 0.79 | 7p22.3-p22.2 | Mitotic checkpoint |
| CSMD1 a | 0.99 | 0.81 | 5% | 0.41 | 8p23.2 | CUB and Sushi multiple domains |
| PARK7 a | 0.86 | 0.98 | 4% | 0.71 | 1p36.23 | Redox-sensitive chaperone |
| ARHGAP8 a | 0.93 | 0.87 | 4% | 0.64 | 22q13.31 | Rho-GTPase activating protein |
| UNC84A a | 0.93 | 0.80 | 3% | 0.65 | 7p22.3 | Nuclear envelope protein |
| RRAD a | 0.99 | 0.97 | 3% | 0.68 | 16q22.1 | Ras-related; associated with diabetes |
| MEN1 | 0.99 | 0.98 | 3% | 0.73 | 11q13.1 | Transcription factor |
| MAP2K4 | 0.99 | 0.91 | 3% | 0.22 | 17p12 | JNK and p38 MAP kinase signaling |
| Fragile site genes: | ||||||
| FHIT | 0.00 | 0.01 | 7% | 0.54 | 3p14.2 | Dinucleoside hydrolase |
| MACROD2 b | 0.01 | 0.02 | 7% | 0.59 | 20p12.1 | Macro domains |
| A2BP1 b | 0.05 | 0.06 | 5% | 0.54 | 16p13.2 | Alternative splicing factor |
| WWOX | 0.02 | 0.02 | 5% | 0.60 | 16q23.1 | Oxidoreductase |
| LRP1B | 0.03 | 0.04 | 4% | 0.48 | 2q22.2-q22.1 | LDL receptor-related |
| PARK2 | 0.07 | 0.07 | 4% | 0.53 | 6q26 | E3 ligase |
| PDE4D b | 0.00 | 0.02 | 3% | 0.51 | 5q11.2-q12.1 | Phosphodiesterase |
| FAM190A | 0.00 | 0.01 | 2% | 0.54 | 4q22.1 | Unknown |
| CNTNAP2 | 0.02 | 0.03 | 2% | 0.51 | 17q35-q36.1 | Contactin-associated protein |
| DLG2 | 0.03 | 0.08 | 2% | 0.61 | 11q14.1 | Membrane-associated guanylate cyclase |
predicted tumor suppressor gene bpredicted common fragile site gene.
for deletions less than 10 Mb; does not include larger deletions.
deletions in CDKN2A/B, CSMD1, and MAP2K4 tend to be homozygous more often than deletions in other genes.
functions were assigned from the literature.
Discussion
We initiated this study to reconcile two disparate findings: the absence of tumor suppressor candidates from two loci frequently affected by focal deletions, and the ability of focal deletions to enrich for tumor suppressors in a functional screen. Through computational and statistical analysis of focal deletions present in more than 1000 cancer samples, we defined two distinct classes of deletions in cancer that resolve this incongruity: a class that represents genes similar to common fragile site genes, and another that is tumor suppressor-like. These two types of deletions are likely to arise from different mechanisms, based on their different deletion sizes and their tendency to co-occur. The one class of deletions, when highly recurrent, overlap a common site and significantly affect the expression of the underlying genes, indicating that recurrence is driven by selective advantage to the evolving tumor cells. In contrast, deletions in common fragile site-like genes do not overlap a common site nor do they have significant effects on underlying gene expression, all of which is consistent with their recurrence being driven by the inherent instability of the genomic locus rather than by selective advantage.
Our findings establish that most focal deletions belong to the class that represents tumor suppressor-like genes and not common fragile site genes. This is the only disagreement we have with a recent study which suggests that most focal deletions in cancer are fragile-like based in part on in part on their propensity to be heterozygous rather than homozygous [16]. However, we believe that this property is not useful as a classifier because several tumor suppressors, including TP53 and CDH1, are affected by focal heterozygous deletions. It may be many haploinsufficient tumor suppressors, such as p27KIP1 [33], remain to be discovered, and computational tools that discount these would be misguided. In some cases, homozygous deletion of a tumor suppressor might be lethal, which could be the case for the spindle assembly checkpoint gene MAD1L1 which we found here to be very frequently affected by heterozygous focal deletions. Although MAD1L1 is not yet in the COSMIC database of tumor suppressors, heterozygous deletion of MAD1L1 has been shown to increase the incidence of tumors caused by partial loss of TP53 in mice [29].
One of the most interesting findings of our study was the tumor-type specific pattern of deletions in CFS-like genes. There appears to be a clear distinction in many cases from known common fragile site genes, which have been determined almost exclusively from analysis of DNA breaks in lymphocytes [1]. Indeed, many of the most commonly deleted CFS-like genes in cancer, including A2BP1, MACROD2, and PDE4D, are not known common fragile sites even in the most recent analyses [2]. Although we initially hypothesized that significantly different chromatin structure within different tissue types could underlie at least part of tumor-type specific patterns of deletions in CFS and CFS-like genes, we observed no correlation with chromatin structure as indicated by DNAase I hypersensitivity data from ENCODE (Table S9). We think a more likely explanation for the tissue-type diversity comes from the findings that both replication origin setting and replication timing are tissue specific in mammalian cells and that this explains the diversity of common site breakage at the FRA3B locus [34].
From the six deletion properties that could be used to distinguish CFS-like genes, machine learning analysis with the random forests classifier determined that only three deletion properties are necessary to classify genes as being CFS-like or not: deletion size, deletion separation, and deletion isolation. These properties should be useful for investigators interested in determining if their particular deleted candidate tumor suppressor gene is CFS-like or not.
Methods
Online Access to Microarray Data
We have deposited the aCGH microarray data with the Gene Expression Omnibus (GEO) repository, accessions GSE31586 and GSE22916.
Tumor Samples, Xenografts, and Cell Lines
We analyzed 850 tumor samples for this study (Table S1). Many of them have been previously described, including the 255 breast cancer samples from the Cancer Center of the Karolinska Institute, Sweden, and the Oslo University Hospital, Norway [35]; the 161 lung cancer samples from the Cooperative Human Tissue Network (CHTN) [9]; the 88 liver cancer samples from CHTN and medical centers in Germany and Hong Kong [15]; and the 27 pancreatic cancer samples and 40 pancreatic cancer xenografts from Johns Hopkins University and the Arizona Cancer Center [36]. New to this study are samples that were obtained after approval from their respective institutional review boards as indicated below. All patients provided written informed consent and samples were procured under the respective Institutional Review Board approvals. These include 135 colon cancer samples which were obtained from Case Western Reserve University collected under an Institutional Review Board (IRB) approved protocol at the Case Medical Center; 106 ovarian cancer samples which were obtained from Memorial Sloan Kettering Cancer Center (MSKCC) under a protocol approved by the MSKCC Human Biospecimen Utilization Committee, a Norwegian cohort from the Oslo University Hospital approved by the Regional Committees for Medical and Health Research Ethics (REC) board, the University of Michigan with a protocol approved by the Institutional Review Boards of the University of Michigan Medical School (IRBMED); 29 melanoma samples which were obtained from MSKCC under a protocol approved by the Memorial Hospital Institutional Review Board; 27 prostate cancer samples which were obtained under clinical research approvals from the IRB of the Karolinska Hospital; and 22 glioblastoma samples which were obtained from the Brain Tumor and Neuro-Oncology Center under approval of the Institutional Review Board of the Neurological Institute of the Cleveland Clinic. This new data has been deposited with NCBI GEO Datasets (GSE31586). DNA and RNA were extracted from dissected tissue containing greater than 75% tumor cell content. The 264 cell lines were obtained from either the American Type Culture Collection (ATCC), the Deutsche Sammlung von Mikroorganismen und Zellkulturen (DSMZ), or the Japanese Collection of Research Bioresources (JCRB).
Array CGH Analysis
200 ng of genomic DNA was used to make representations for whole-genome copy number analysis by ROMA array comparative genomic hybridization as described [35]. The probes were mapped to the March 2006 human reference sequence (NCBI Build 36.1). Hybridizations, washing, scanning, and data normalization were performed as described [35]. The majority of cancer samples were co-hybridized to the arrays with a differentially-labeled unrelated reference genome, although in some cases matching normal DNA was used as the reference. The normalized fluorescent ratios representing DNA copy number measurements were segmented using the CBS segmenter [37].
Identification and Validation of Focal Deletions
Common germline copy number polymorphisms (>5% frequency) were removed from the CBS segmented data by previously described methods [35] using a masking dataset of germline DNA copy number profiles from 500 different normal individuals analyzed with the same platform and CBS segmentation algorithm. Thresholds for focal deletions included a minimum of three probes per segment, a segmented DNA copy number value that was 0.85 or below and at least 0.1 lower than both nearest neighboring segments, and a segment size of less than 10 Mb. We validated this approach to aCGH-based determination of focal deletions by confirming the presence and boundaries of deletions by real-time PCR using nine different TaqMan probes (Table S7).
Deletion Metrics and Classification of Focal Deletions
The set of 10,835 focal deletions was used to develop metrics that were based on 2 Mb intervals (windows). For genes that were affected by 8 or more deletions, we constructed a set of windows that contained deletions based on the deletion start and stop positions, and assigned to the gene the values of the closest possible window (center of gene to center of the window). “Deletion Size” is the median length of all deletions that overlap the window. “Deletion Separation” is calculated by determining for each deletion how many other deletions in the window are separate (non-overlapping), then taking the average of these values, and then standardizing this score so that is independent of the number of deletions.
Other metrics were calculated on the level of individual genes. “Deletion Isolation” was developed to quantify whether deletions also affected nearby genes. For each gene, a gene-size neutral metric was determined by summing the fraction of the gene deleted in all samples. Deletion Isolation was then determined by subtracting the average of the same metric for both the nearest upstream and nearest downstream neighboring genes. “Cell Line Proportion” was determined from the fraction of deletions in a given gene that occurred in cell lines relative to the total number of deletions in all sample types. “RNA/DNA Correlation” for each gene was calculated from the Pearson correlation coefficient of the log2-transformed segmented DNA copy number value with the log2-transformed relative RNA expression level. For genes with more than one probe on the Nimblegen expression array (see Supplementary Methods), the average value was used.
PCA and Machine Learning Tools
Principal Component Analyasis was performed for the 4,859 genes using the mean-centered and variance-adjusted seven parameters with a built-in function from the ‘labDSV’ R software package. We used two classifiers, Random Forest (RF) and Support Vector Machine (SVM), to perform genome-wide classification of deleted genes with respect to their tumor suppressor-like or CFS-like properties. We used the Random Forest algorithm as implemented in the randomForest R software package (http://www.R-project.org). The algorithm was trained on a set of 24 known tumor suppressors and 11 known common fragile site genes (Table S4). We grew 10,000 trees each time we generated a classifier. Initially all seven predictor variables were used for training, resulting in correct out-of-bag classification of all tumor suppressors and all but two common fragile site genes. The importance of individual predictors was measured by mean decrease of the Gini index. We then trained the classifier again, retaining the three most important predictors: “Deletion Separation”, “Deletion Size” and “Deletion Isolation”. The quality of out-of-bag classification was identical to that with the full set of predictors. Finally, we applied both classifiers to the entire set of 4,823 genes focally deleted in more than 14 tumors each. The predicted class (tumor suppressor or CFS-like) differed for only 39 genes between the two RF classifiers (Table S8). For SVM classification, we used the Kernel-based Machine Learning Lab R software package (http://cran.r-project.org/). We used the Gaussian kernel, and set the kernel function parameter to 0.01 and the soft margin parameter C to 10, based on a grid search for the best (three-fold) cross-validation error. The final cross-validation error was 3.2% and the training error was 2.9%. To assign class probabilities, we used the ‘prob.model’ option (Table S8).
Co-deletion Values
The co-deletion values were calculated by first constructing a deletion vector for each of the 35 genes. Supposing there were only 5 samples, and gene A is deleted in sample 1 and sample 3, and gene B is deleted in sample 2 and sample 3, then the co-deletion value is the correlation between (1, 0, 1, 0, 0) and (0, 1, 1, 0, 0). Only samples that contained at least 1 deletion in the set of 35 genes were used in this analysis.
Expression Analysis
For a subset of the cancer samples, we performed whole-genome expression profiling using Nimblegen’s recommended single-color hybridization protocol and their 385,000 probe gene expression array (design ID #1877). Gene calls were generated using the Robust Multichip Average (RMA) algorithm provided with the NimbleScan software package. Subsequently, RMA expression values for a given tumor type were quantile normalized using R. Before computing the correlation between DNA copy number and expression, the normalized RMA expression values were log2-transformed and standardized with values obtained with Stratagene’s universal reference RNA.
Biological Assays
Induction of focal deletions by replicative stress was performed by treatment of Caco-2 cells with a subtoxic dose (0.3 µM) of aphidicolin (Calbiochem) for 5 days followed by 24 hours recovery. Treated cells were trypsinized and 150 cells were plated onto 10 cm plates. After two weeks, clones were selected and expanded. Genomic DNA was isolated from each clone using the Gentra Puregene Core kit (Qiagen) and used to generate probes for array CGH analysis. Microarrays were custom designed to tile the MACROD2, A2BP1, and FHIT loci with Agilent’s eArray tool (https://earray.chem.agilent.com/earray) using an 8×15K format. Arrays were hybridized and scanned as recommended by the manufacturer and following normalization the fluorescent ratios representing DNA copy number measurements segmented using the CBS segmenter.
Taqman probes were designed with ABI software and used as described for both real-time PCR analyais of DNA and RNA [10]. We constructed two A2BP1 expression vectors (pMSCV-A2BP1 and pMSCV-FlagA2BP1) by using high-fidelity PCR to amplify the coding-sequence insert from cDNA clone AF107203.1 (alternate splicing isoform 3) with primers encoding a wild-type N-terminus (for pMSCV-A2BP1) or using the insert from cDNA clone NM_018723.2 (alternate splicing isoform 4) using primers encoding a Flag-tagged N-terminus. We chose these two isoforms for functional studies as they were the most abundant based on annotation at http://genome.ucsc.edu. After validation by DNA sequencing, these plasmids were transfected into cancer cell lines and assayed for effects on tumorigenicity in nude mice as described [10]. The tumorigenicity studies were approved by CSHL’s Institutional Animal Care and Use Committee (IACUC).
Supporting Information
Average DNA segment sizes. Plotted as a function of position on chromosomes 2 through 13.
(EPS)
Tumor samples, cancer cell lines, and xenografts used in this study. This table contains four columns describing for each sample the tumor type, sample ID, array CGH ID, and sample type.
(XLS)
Properties of the 10,835 focal deletions. This table contains ten columns describing for each focal deletion the tumor type, chromosome (23 = X), chromosomal start position (hg18), chromosomal stop position, the start and stop position on an absolute genome scale, the segmented DNA copy number value, the array CGH ID, and the sample type.
(XLS)
Number of focal deletion involving individual telomeres. Focal deletions (out of the total of 10,835) that effect individual telomeres are shown.
(XLSX)
The known common fragile site genes and tumor suppressor genes affected by ≥15 focal deletions. This set of genes was used for exploring properties that distinguished the two classes and for the training sets for the machine-learning tools.
(XLS)
Differential frequency of deletions in CFS genes between breast cancer cell lines and primary breast tumors. This table show the numbers of breast cancer samples affected by focal deletions in the indicated genes, broken out by sample type (tumor or cell line). The average number of deletions affecting RefSeq genes is shown in the last row.
(XLSX)
The importance of individual predictors in the RF classifier. The mean decrease in the Gini index was used to calculate the relative important of the seven individual properties in the RF classifier.
(XLSX)
Validation of focal deletion calls by TaqMan real-time PCR. TaqMan probes were designed to nine different locations within the A2BP1 locus and used to determine DNA copy number in four different colon cancer cell lines. Shown for each cell line are two rows comparing the DNA copy number estimates based on aCGH versus real-time PCR. Note that there is good agreement except for the boundary of the hemizygous deletion in the cell line LIM2045. Real-time PCR has a greater dynamic range and can more accurately distinguish homozygous from heterozygous deletions than aCGH.
(XLSX)
Functional classification of 4,823 genes for their TSG or CFS probabilities. This table contains fourteen columns describing for each gene with >15 focal deletions the chromosome, chromosomal start position, chromosomal stop position, the seven properties that distinguish TSG from CFS genes (mean-centered and variance-adjusted), the probability of being a TSG based on Random Forest classification (using either 7 or 3 properties), and the probability of being a TSG based on SVM classification. The probability of being a CFS is 1– TSG probability.
(XLS)
DNAse I hypersensitivity for six common fragile site or CFS-like genes in four different cell types. The average DNAse I hypersensitivity for the indicated genes was taken from ENCODE data from the University of Washington (http://genome.ucsc.edu/cgi-bin/hgFileUi?db=hg19&g=wgEncodeUwDnase). Higher numbers indicate greater sensitivity and more open chromatin structure.
(DOCX)
Acknowledgments
We thank K. Nguyen, A. Bakleh, X. Xing, L. Rodgers, and J. Marchica for technical support, and J. Duffy for his help preparing figures.
Funding Statement
This work was supported by NIH grants CA124648 and RC2CA148532. The funders had no role in study design, data collection and analysis, decision to publish, or preparation of the manuscript.
References
- 1. Durkin SG, Glover TW (2007) Chromosome fragile sites. Annu Rev Genet 41: 169–192. [DOI] [PubMed] [Google Scholar]
- 2. Fungtammasan A, Walsh E, Chiaromonte F, Eckert KA, Makova KD (2012) A genome-wide analysis of common fragile sites: what features determine chromosomal instability in the human genome? Genome Res 22: 993–1005. [DOI] [PMC free article] [PubMed] [Google Scholar]
- 3. Huebner K, Croce CM (2001) FRA3B and other common fragile sites: the weakest links. Nat Rev Cancer 1: 214–221. [DOI] [PubMed] [Google Scholar]
- 4. Abdeen SK, Salah Z, Maly B, Smith Y, Tufail R, et al. (2011) Wwox inactivation enhances mammary tumorigenesis. Oncogene 30: 3900–3906. [DOI] [PubMed] [Google Scholar]
- 5. Poulogiannis G, McIntyre RE, Dimitriadi M, Apps JR, Wilson CH, et al. (2010) PARK2 deletions occur frequently in sporadic colorectal cancer and accelerate adenoma development in Apc mutant mice. Proc Natl Acad Sci U S A 107: 15145–15150. [DOI] [PMC free article] [PubMed] [Google Scholar]
- 6.Je EM, Yoo NJ, Lee SH (2012) Somatic Mutation of PARK2 Tumor Suppressor Gene is not Common in Common Solid Cancers. Pathol Oncol Res. [DOI] [PubMed] [Google Scholar]
- 7. Thiagalingam S, Lisitsyn NA, Hamaguchi M, Wigler MH, Willson JK, et al. (1996) Evaluation of the FHIT gene in colorectal cancers. Cancer Res 56: 2936–2939. [PubMed] [Google Scholar]
- 8. Watanabe A, Hippo Y, Taniguchi H, Iwanari H, Yashiro M, et al. (2003) An opposing view on WWOX protein function as a tumor suppressor. Cancer Res 63: 8629–8633. [PubMed] [Google Scholar]
- 9. Kendall J, Liu Q, Bakleh A, Krasnitz A, Nguyen KC, et al. (2007) Oncogenic cooperation and coamplification of developmental transcription factor genes in lung cancer. Proc Natl Acad Sci U S A 104: 16663–16668. [DOI] [PMC free article] [PubMed] [Google Scholar]
- 10. Mu D, Chen L, Zhang X, See LH, Koch CM, et al. (2003) Genomic amplification and oncogenic properties of the KCNK9 potassium channel gene. Cancer Cell 3: 297–302. [DOI] [PubMed] [Google Scholar]
- 11. Zender L, Spector MS, Xue W, Flemming P, Cordon-Cardo C, et al. (2006) Identification and validation of oncogenes in liver cancer using an integrative oncogenomic approach. Cell 125: 1253–1267. [DOI] [PMC free article] [PubMed] [Google Scholar]
- 12. Li J, Yang Y, Peng Y, Austin RJ, van Eyndhoven WG, et al. (2002) Oncogenic properties of PPM1D located within a breast cancer amplification epicenter at 17q23. Nat Genet 31: 133–134. [DOI] [PubMed] [Google Scholar]
- 13. van der Horst EH, Degenhardt YY, Strelow A, Slavin A, Chinn L, et al. (2005) Metastatic properties and genomic amplification of the tyrosine kinase gene ACK1. Proc Natl Acad Sci U S A 102: 15901–15906. [DOI] [PMC free article] [PubMed] [Google Scholar]
- 14. Sawey ET, Chanrion M, Cai C, Wu G, Zhang J, et al. (2011) Identification of a therapeutic strategy targeting amplified FGF19 in liver cancer by Oncogenomic screening. Cancer Cell 19: 347–358. [DOI] [PMC free article] [PubMed] [Google Scholar]
- 15. Zender L, Xue W, Zuber J, Semighini CP, Krasnitz A, et al. (2008) An oncogenomics-based in vivo RNAi screen identifies tumor suppressors in liver cancer. Cell 135: 852–864. [DOI] [PMC free article] [PubMed] [Google Scholar]
- 16. Bignell GR, Greenman CD, Davies H, Butler AP, Edkins S, et al. (2010) Signatures of mutation and selection in the cancer genome. Nature 463: 893–898. [DOI] [PMC free article] [PubMed] [Google Scholar]
- 17. Cancer Genome Atlast Network (2012) Comprehensive molecular characterization of human colon and rectal cancer. Nature 487: 330–337. [DOI] [PMC free article] [PubMed] [Google Scholar]
- 18. Andersen CL, Lamy P, Thorsen K, Kjeldsen E, Wikman F, et al. (2011) Frequent genomic loss at chr16p13.2 is associated with poor prognosis in colorectal cancer. Int J Cancer 129: 1848–1858. [DOI] [PubMed] [Google Scholar]
- 19. Kuroyanagi H (2009) Fox-1 family of RNA-binding proteins. Cell Mol Life Sci 66: 3895–3907. [DOI] [PMC free article] [PubMed] [Google Scholar]
- 20. Forbes SA, Tang G, Bindal N, Bamford S, Dawson E, et al. (2010) COSMIC (the Catalogue of Somatic Mutations in Cancer): a resource to investigate acquired mutations in human cancer. Nucleic Acids Res 38: D652–657. [DOI] [PMC free article] [PubMed] [Google Scholar]
- 21. McAvoy S, Ganapathiraju SC, Ducharme-Smith AL, Pritchett JR, Kosari F, et al. (2007) Non-random inactivation of large common fragile site genes in different cancers. Cytogenet Genome Res 118: 260–269. [DOI] [PubMed] [Google Scholar]
- 22. Arlt MF, Mulle JG, Schaibley VM, Ragland RL, Durkin SG, et al. (2009) Replication stress induces genome-wide copy number changes in human cells that resemble polymorphic and pathogenic variants. Am J Hum Genet 84: 339–350. [DOI] [PMC free article] [PubMed] [Google Scholar]
- 23. Raschke S, Balz V, Efferth T, Schulz WA, Florl AR (2005) Homozygous deletions of CDKN2A caused by alternative mechanisms in various human cancer cell lines. Genes Chromosomes Cancer 42: 58–67. [DOI] [PubMed] [Google Scholar]
- 24. Murano I, Kuwano A, Kajii T (1989) Fibroblast-specific common fragile sites induced by aphidicolin. Hum Genet 83: 45–48. [DOI] [PubMed] [Google Scholar]
- 25. Teng DH, Perry WL 3rd, Hogan JK, Baumgard M, Bell R, et al. (1997) Human mitogen-activated protein kinase kinase 4 as a candidate tumor suppressor. Cancer Res 57: 4177–4182. [PubMed] [Google Scholar]
- 26. Agarwal SK, Kester MB, Debelenko LV, Heppner C, Emmert-Buck MR, et al. (1997) Germline mutations of the MEN1 gene in familial multiple endocrine neoplasia type 1 and related states. Hum Mol Genet 6: 1169–1175. [DOI] [PubMed] [Google Scholar]
- 27. Farrell C, Crimm H, Meeh P, Croshaw R, Barbar T, et al. (2008) Somatic mutations to CSMD1 in colorectal adenocarcinomas. Cancer Biol Ther 7: 609–613. [DOI] [PubMed] [Google Scholar]
- 28. Hasan K, Cheung C, Kaul Z, Shah N, Sakaushi S, et al. (2009) CARF Is a vital dual regulator of cellular senescence and apoptosis. J Biol Chem 284: 1664–1672. [DOI] [PubMed] [Google Scholar]
- 29. Chi YH, Ward JM, Cheng LI, Yasunaga J, Jeang KT (2009) Spindle assembly checkpoint and p53 deficiencies cooperate for tumorigenesis in mice. Int J Cancer 124: 1483–1489. [DOI] [PMC free article] [PubMed] [Google Scholar]
- 30. Suzuki M, Toyooka S, Shivapurkar N, Shigematsu H, Miyajima K, et al. (2005) Aberrant methylation profile of human malignant mesotheliomas and its relationship to SV40 infection. Oncogene 24: 1302–1308. [DOI] [PubMed] [Google Scholar]
- 31. Nancarrow DJ, Handoko HY, Smithers BM, Gotley DC, Drew PA, et al. (2008) Genome-wide copy number analysis in esophageal adenocarcinoma using high-density single-nucleotide polymorphism arrays. Cancer Res 68: 4163–4172. [DOI] [PubMed] [Google Scholar]
- 32. Ding L, Getz G, Wheeler DA, Mardis ER, McLellan MD, et al. (2008) Somatic mutations affect key pathways in lung adenocarcinoma. Nature 455: 1069–1075. [DOI] [PMC free article] [PubMed] [Google Scholar]
- 33. Komuro H, Valentine MB, Rubnitz JE, Saito M, Raimondi SC, et al. (1999) p27KIP1 deletions in childhood acute lymphoblastic leukemia. Neoplasia 1: 253–261. [DOI] [PMC free article] [PubMed] [Google Scholar]
- 34. Letessier A, Millot GA, Koundrioukoff S, Lachages AM, Vogt N, et al. (2011) Cell-type-specific replication initiation programs set fragility of the FRA3B fragile site. Nature 470: 120–123. [DOI] [PubMed] [Google Scholar]
- 35. Hicks J, Krasnitz A, Lakshmi B, Navin NE, Riggs M, et al. (2006) Novel patterns of genome rearrangement and their association with survival in breast cancer. Genome Res 16: 1465–1479. [DOI] [PMC free article] [PubMed] [Google Scholar]
- 36.Chen S, Auletta T, Dovirak O, Hutter C, Kuntz K, et al.. (2008) Copy number alterations in pancreatic cancer identify recurrent PAK4 amplification. Cancer Biol Ther 7. [DOI] [PMC free article] [PubMed] [Google Scholar]
- 37. Venkatraman ES, Olshen AB (2007) A faster circular binary segmentation algorithm for the analysis of array CGH data. Bioinformatics 23: 657–663. [DOI] [PubMed] [Google Scholar]
- 38. Zhang C, Zhang Z, Castle J, Sun S, Johnson J, et al. (2008) Defining the regulatory network of the tissue-specific splicing factors Fox-1 and Fox-2. Genes Dev 22: 2550–2563. [DOI] [PMC free article] [PubMed] [Google Scholar]
Associated Data
This section collects any data citations, data availability statements, or supplementary materials included in this article.
Supplementary Materials
Average DNA segment sizes. Plotted as a function of position on chromosomes 2 through 13.
(EPS)
Tumor samples, cancer cell lines, and xenografts used in this study. This table contains four columns describing for each sample the tumor type, sample ID, array CGH ID, and sample type.
(XLS)
Properties of the 10,835 focal deletions. This table contains ten columns describing for each focal deletion the tumor type, chromosome (23 = X), chromosomal start position (hg18), chromosomal stop position, the start and stop position on an absolute genome scale, the segmented DNA copy number value, the array CGH ID, and the sample type.
(XLS)
Number of focal deletion involving individual telomeres. Focal deletions (out of the total of 10,835) that effect individual telomeres are shown.
(XLSX)
The known common fragile site genes and tumor suppressor genes affected by ≥15 focal deletions. This set of genes was used for exploring properties that distinguished the two classes and for the training sets for the machine-learning tools.
(XLS)
Differential frequency of deletions in CFS genes between breast cancer cell lines and primary breast tumors. This table show the numbers of breast cancer samples affected by focal deletions in the indicated genes, broken out by sample type (tumor or cell line). The average number of deletions affecting RefSeq genes is shown in the last row.
(XLSX)
The importance of individual predictors in the RF classifier. The mean decrease in the Gini index was used to calculate the relative important of the seven individual properties in the RF classifier.
(XLSX)
Validation of focal deletion calls by TaqMan real-time PCR. TaqMan probes were designed to nine different locations within the A2BP1 locus and used to determine DNA copy number in four different colon cancer cell lines. Shown for each cell line are two rows comparing the DNA copy number estimates based on aCGH versus real-time PCR. Note that there is good agreement except for the boundary of the hemizygous deletion in the cell line LIM2045. Real-time PCR has a greater dynamic range and can more accurately distinguish homozygous from heterozygous deletions than aCGH.
(XLSX)
Functional classification of 4,823 genes for their TSG or CFS probabilities. This table contains fourteen columns describing for each gene with >15 focal deletions the chromosome, chromosomal start position, chromosomal stop position, the seven properties that distinguish TSG from CFS genes (mean-centered and variance-adjusted), the probability of being a TSG based on Random Forest classification (using either 7 or 3 properties), and the probability of being a TSG based on SVM classification. The probability of being a CFS is 1– TSG probability.
(XLS)
DNAse I hypersensitivity for six common fragile site or CFS-like genes in four different cell types. The average DNAse I hypersensitivity for the indicated genes was taken from ENCODE data from the University of Washington (http://genome.ucsc.edu/cgi-bin/hgFileUi?db=hg19&g=wgEncodeUwDnase). Higher numbers indicate greater sensitivity and more open chromatin structure.
(DOCX)