Figure 5.
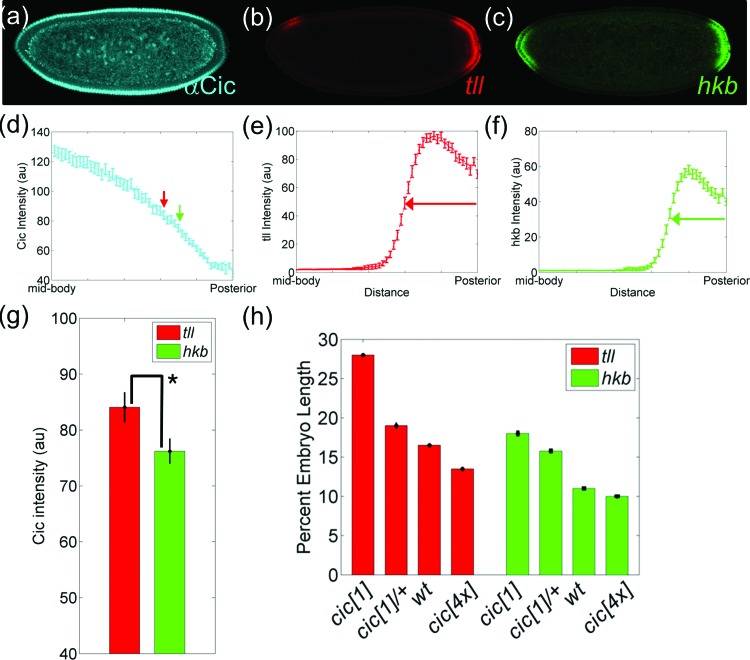
Cic-dependent control of posterior domains of tll and hkb. (a)–(c) Simultaneous detection of Cic protein (a) and tll (b) and hkb (c) mRNAs in a single embryo using FISH. (d) Quantification of nuclear Cic in the posterior half of the embryo. The boundaries of tll and hkb are indicated by red and green arrows, respectively. (e) and (f) Normalized spatial gradient of tll (e) and hkb (f) mRNAs. (g) Bar graph of average intensities of Cic at the boundaries of tll (red) and hkb (green). Each bar represents an average of 52 data with error bars indicating s.e.m. (h) Changes in the boundaries of tll and hkb in embryos with different copies of cic gene (see Sec. 2 for details on the quantification). Posterior pole is denoted as 0% embryo length, and error bars are s.e.m. The number of embryos in each background are N = 65 (cic[1]), N = 56 (cic[1]/+), N = 49 (wt), and N = 32 (cic[4x]) for tll and N = 39 (cic[1]), N = 103 (cic[1]/+), N = 52 (wt), and N = 41 (cic[4x]) for hkb.

