

Background: It is unknown whether enzyme promiscuity is achieved by induced fit or conformational selection.
Results: Pre-steady state kinetic and thermodynamic analysis of promiscuous enzymes indicates substrate-dependent conformational selection of substrate-free ensembles.
Conclusion: Catalytic promiscuity correlates with thermodynamic parameters of substrate-free enzyme conformation.
Significance: These results are the first to demonstrate that molten globule active sites facilitate conformational selection.
Keywords: Calorimetry, Drug Metabolism, Enzyme Catalysis, Glutathion, Xenobiotics, Energy Landscape, Enzyme Conformation, Promiscuity
Abstract
The role of conformational ensembles in enzymatic reactions remains unclear. Discussion concerning “induced fit” versus “conformational selection” has, however, ignored detoxication enzymes, which exhibit catalytic promiscuity. These enzymes dominate drug metabolism and determine drug-drug interactions. The detoxication enzyme glutathione transferase A1–1 (GSTA1–1), exploits a molten globule-like active site to achieve remarkable catalytic promiscuity wherein the substrate-free conformational ensemble is broad with barrierless transitions between states. A quantitative index of catalytic promiscuity is used to compare engineered variants of GSTA1–1 and the catalytic promiscuity correlates strongly with characteristics of the thermodynamic partition function, for the substrate-free enzymes. Access to chemically disparate transition states is encoded by the substrate-free conformational ensemble. Pre-steady state catalytic data confirm an extension of the conformational selection model, wherein different substrates select different starting conformations. The kinetic liability of the conformational breadth is minimized by a smooth landscape. We propose that “local” molten globule behavior optimizes detoxication enzymes.
Introduction
The role of conformational ensembles in enzyme catalysis remains elusive, despite well established models such as “induced fit” and “conformational selection.” Both of these limiting case behaviors are incorporated in textbook examples of allostery including the Monod-Wyman-Changeux model (1) and the Adair-Nemethy-Koshland model (2), which continue to provide the theoretical framework for the role of conformational change in regulatory, oligomeric enzymes. Here we clarify the role of the conformational coordinate, and its thermodynamic behavior, for a representative drug metabolizing enzyme. The ensembles that result from conformations “orthogonal” to the reaction coordinate (E+S, [E·S], [E·P], E+P) comprise the “catalytic network” as described by others (3, 4). For substrate-specific enzymes and their cognate substrate, the breadth of the free enzyme conformational ensemble and substrate concentration determine whether the enzymes utilize conformational selection of pre-existing states to bind substrate, or the “classic” device of induced fit, in which substrate drives formation of a conformation that is otherwise unpopulated. Examples of both are abundant (5–8), although conformational selection is more difficult to detect experimentally (9). However, the specific advantages and disadvantages of conformational selection and induced fit are not defined well. This uncertainty becomes more interesting for detoxication enzymes that must access chemically disparate transition states for different substrates. Models analogous to induced fit or conformational selection for promiscuous enzymes with a range of substrates are currently nonexistent. However, for these enzymes, the traditional models are reasonably extended as shown in Fig. 1.
FIGURE 1.
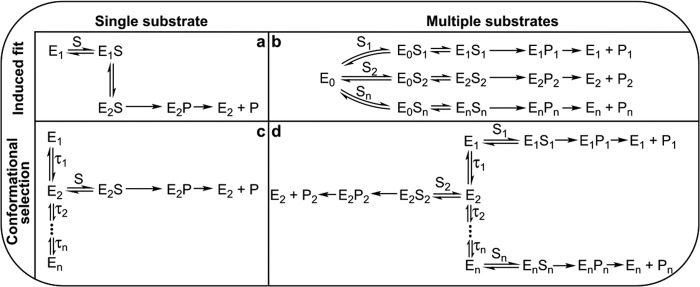
Limiting cases comprising catalytic networks. a and b, an induced fit mechanism where substrate binding to free enzyme, E0, leads to ES complexes with substrate-dependent conformations. c and d, a conformational selection mechanism consisting of pre-existing and interconverting enzyme conformers, separated by negligible (or no) energy barriers. Each substrate binds to a “preferred” conformation of enzyme.
For substrate-specific enzymes with a single well defined “saddle point” transition state en route to product, the possibility that a broad conformational landscape for ground states could have catalytic advantages is counterintuitive because “off pathway” conformations orthogonal to the reaction coordinate are expected to be nonproductive, and even inhibitory, when conformational relaxation is slow or if the conformations most populated are far in conformational space from those that bind substrate (Fig. 1, c and d). The off-pathway conformations would be a kinetic “liability” because conformational relaxation time is τ = τ1 + τ2.. + τn for a sequential series of steps from conformation 1 to conformation n; that is, either large τ's or large n could lead to slow formation of the “correct” conformation and be a kinetic liability; conformational sampling of the free enzyme comes with a catalytic cost.
Detoxication enzymes present a fascinating variation of the classic paradigms. For example, the biological function of detoxication enzymes, such as cytochrome P450s (10), UDP-glucuronosyl transferases (11), glutathione transferases (GSTs) (12, 13) and others, includes their ability to bind and metabolize an extraordinary range of chemically diverse substrates, and hence they control the elimination of most clinically used drugs and environmental toxins (10). Such enzymes contribute to many clinically defined drug-drug interactions (14). In contrast to “normal” enzymes, which may become evolutionarily optimized for rate and specificity with one substrate, detoxication enzymes are likely optimized for “diversity” and this has important implications for enzyme theories based on catalytic networks, or that attempt to merge protein folding and catalysis into a unifying paradigm. In contrast to substrate-specific enzymes, detoxication enzymes are expected to benefit from conformational diversity because it could provide access to conformationally distinct transition states en route from different substrates to their respective products, as required for catalytic diversity. Structural studies of cytochrome P450 isoform CYP3A4 illustrate this notion (15). However, mechanisms by which such enzymes could balance the advantages and disadvantages of conformational diversity are completely unexplored. Here, a detoxication glutathione transferase is shown to optimize a catalytic network that provides access to chemically disparate transition states via barrierless transitions between substrate-free enzyme ground state conformations. The results reveal how catalytic networks are advantageous to functionally promiscuous enzymes, and they provide an example wherein nature has exploited a localized fluid molten globule at an enzyme active site to minimize the kinetic liability of conformational diversity.
Glutathione transferases are a family of soluble enzymes that conjugate the tripeptide glutathione (GSH) to various types of electrophiles, thus facilitating their elimination (16, 17). The α-class GST family includes the isoforms GSTA1–1 and A4–4, which are highly promiscuous and highly substrate specific, respectively, despite their high sequence similarity and nearly superimposable structures (Fig. 2, a and b) (12, 18, 19). Whereas GSTA1–1 is an archetypal promiscuous detoxication enzyme, GSTA4–4 has great specificity for straight chain unsaturated lipid aldehydes, about nine carbons in length, that result from lipid peroxidation (20). The GSTA1–1 active site includes a C-terminal helix that is dynamic on the nanosecond-millisecond time scale in the ligand-free and GSH-bound states and it adopts different positions in varying product complexes (21–23). In contrast, GSTA4–4 is a rigid scaffold with a preformed active site that behaves according to a “lock and key” model wherein the static C-terminal helix provides one wall of the long, static, highly specific, active site (24, 25). Here, we exploit a series of GST mutants that provides a continuum of structural and catalytic characteristics between the wild-type GSTA1–1 and GSTA4–4 enzymes. Collectively, these structural variants provide an ideal model system to explore the costs and benefits of conformational ensembles in detoxication catalysis in a thermodynamic context.
FIGURE 2.

GSTA1–1 and A4–4 dimers. a and b, ribbon diagram overlay of apo-GSTA1–1 (purple) and apo-GSTA4–4 (yellow). c and d, ribbon diagram of GSTA1–1 with S-hexyl GSH (magenta) bound. The C terminus, residues 208–222, is shown in cyan, and sites of mutation are illustrated in orange. Views are with the 2-fold axis of symmetry vertical within the plane of the page (a and c), or perpendicular to the page (b and d). apo-GSTA1–1, Protein Data Bank code 1K3O; GSTA1–1 with S-hexyl Protein Data Bank code; 1K3Y, GSTA4–4 Protein Data Bank code, 1GUM.
EXPERIMENTAL PROCEDURES
Protein Expression and Purification
Cloning and expression of hGSTA1–1 (26, 27) and GSTA4–4 (20) in Escherichia coli have been described. Construction of the hGSTA1–1 W21F:F222W (12), hGST V111F:R217Y (12), and hGST GIMFhelix (28) mutants have been described previously, as have their expression and purification. SDS-PAGE was used to verify purity of all enzymes. Protein concentrations for all studies were determined using previously published molar absorptivity coefficients at 280 nm (12, 28).
Differential Scanning Calorimetry
DSC3 experiments were performed using a VP-Capillary DSC microcalorimeter (GE Healthcare). All protein samples were dialyzed against 200 × (v/v) 100 mm sodium phosphate buffer, pH 6.5, at 4 °C prior to analysis. The dialysate was used for buffer reference scans and loaded into the reference cell for protein scans. Thermograms were collected at scan rates ranging from 0.5 to 2 °C/min; no dependence on scan rate was observed and all data shown were collected at 2 °C/min. Samples were equilibrated for 10 min at 10 °C prior to scanning from 10 to 80 °C. Reversibility of the thermal transitions was evaluated by scanning to just above the highest temperature transition midpoint, cooling to 10 °C, and rescanning. Origin 7.0 (OriginLab) was used to normalize the data for protein dimer concentration and subtraction of buffer reference scans. Native state heat capacity baselines were extrapolated from the slope of the pre-transition baselines and subtracted, followed by deconvolution into two transitions using the non-two state model provided in Origin 7.0. The low temperature transitions were analyzed according to the variable-barrier model developed by Muñoz and Sanchez-Ruiz (29), using custom Octave script employing a Levenberg-Marquardt minimization algorithm.
Variable-barrier Analysis
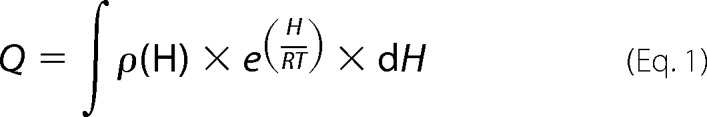
To determine the characteristics of the free energy landscape of the GSTs, a variable-barrier analysis developed by Muñoz and Sanchez-Ruiz (29, 30) was applied to the DSC data, and reflects the fundamental relationship between the density function for enthalpic states and the partition function. DSC allows experimental access to the partition function, which allows a calorimetric transition to be described in terms of a continuous distribution of enthalpic microstates (Equation 1), where Q is the partition function, H is the enthalpy scale, ρ(H) is the density of enthalpy microstates, R is the gas constant.
 |
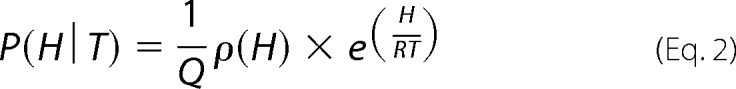
The probability, P(H|T), of finding the protein in a given enthalpic microstate, H, at temperature T, is determined by Equation 2.
 |
The relationship between the probability at temperature T and the “characteristic” temperature, T0, is shown by Equation 3, such that,
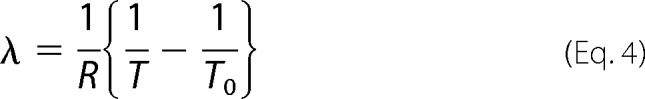
where C is a normalization constant found by setting the integral of P(H∣T)dH equal to 1 and λ is the reduced temperature (Equation 4).
 |
P(H∣T0) is the probability density at T0, as determined by Equation 5,
 |
where C′ is a normalization constant similar to C, and the free energy function, G0(H), is based on the Landau theory of critical transitions, as shown by Equation 6.
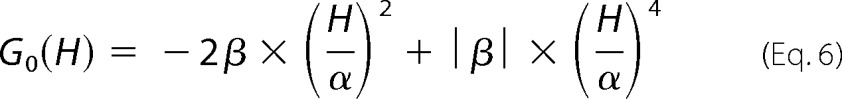 |
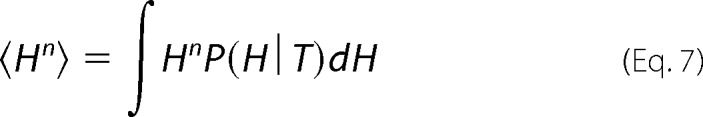
This yields a description of the distribution of states and hence the degree of “roughness” of the landscape, where the parameters α and β are the critical coefficients and enthalpy (H) is the order parameter. β > 0 corresponds to the energy barrier separating two enthalpic macrostates or populations with well defined average enthalpy, and 2α approximates the enthalpy difference between macrostates. When β is negative, there is a single macrostate in a smooth energy well, and α and β simply describe the shape of the free energy function. At this point the first and second enthalpy moments, H1 and H2, can be calculated by Equation 7,
 |
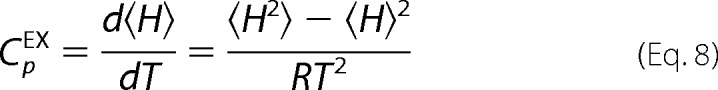
and compared with the DSC data in terms of the excess heat capacity with respect to the native state (CpEX) through Equation 8 in a least-squares fitting routine.
 |
To account for the asymmetry of protein folding, where the native (low-enthalpy macrostate) and unfolded (high-enthalpy macrostate) have differing heat capacities, one value of α is used for positive enthalpy values (αN) and one for negative enthalpy values (αP), such that,
and
and
where f is the asymmetry factor (0 < f < 1). The DSC data were fit to Equation 8 using a custom Octave script employing a Levenberg-Marquardt minimization algorithm. The least-squares fitting parameters were T0, β, Σα, and f. Goodness of fit was determined by R2 values and confidence interval analysis. The native heat capacity baseline for all data sets was extrapolated from the slope of the pre-transition baseline.
Promiscuity Quantitation
Catalytic promiscuity indices (Jcat) were calculated from the kcat/Km of each enzyme toward all substrates in the basis set, as determined by monitoring absorbance change on a dual-beam Olis Modernized Aminco DW-2 absorbance spectrophotometer (Olis Inc.). Assays were conducted with a thermostated cell compartment at 30 °C with 5-mm quartz cuvettes in 100 mm sodium phosphate buffer. The pH for each substrate was adjusted to minimize the nonenzymatic reaction. The reaction mixture contained enzyme and freshly prepared reduced GSH, and was allowed to temperature equilibrate for 5 min before the reaction was initiated with the addition of substrate. Absorbance change for each substrate concentration was monitored for 60 s, and the initial rates were determined from the slope of this line and the molar extinction coefficients at the appropriate wavelengths as follows: reduced glutathione (GSH) conjugation with 1-chloro-2,4-dinitrobenzene was monitored at 340 nm (ϵ340 = 9.6 mm−1 cm−1), a final concentration of 5 mm GSH, 5% ethanol (v/v), and a 0.025–1.6 mm substrate concentration range, at pH 6.5; addition of GSH to ethacrynic acid was monitored at 270 nm (ϵ270 = 5.0 mm−1 cm−1), a final concentration of 1 mm GSH, 2% ethanol (v/v), and a 0.025–0.8 mm substrate concentration range at pH 6.5; conjugation of GSH to phenethyl isothiocyanate was monitored at 274 nm (ϵ274 = 8.89 mm−1 cm−1), a final GSH concentration of 1 mm, 2% acetonitrile (v/v), and a 0.0125–0.4 mm substrate concentration range, at pH 6.5; p-nitrophenolate release was monitored at 400 nm (ϵ400 = 8.79 mm−1 cm−1) for the conjugation of GSH to p-nitrophenyl acetate, with a final GSH concentration of 1 mm, 2% ethanol (v/v), and a 0.05–2.4 mm concentration range, at pH 7.0; GSH addition to trans-2-nonenal was followed by depletion of trans-2-nonenal monitored at 225 nm (ϵ225 = −19.22 mm−1 cm−1), with a final GSH concentration of 0.5 mm, 2% ethanol (v/v), and a 0.00312–0.2 mm substrate concentration range, at pH 6.5; and peroxidase activity toward cumene hydroperoxide was followed by detection of NADPH oxidation monitored at 340 nm (ϵ340 = −6.5 mm−1 cm−1), with a final GSH concentration of 1 mm, 5% ethanol (v/v), and a 0.025–2.5 mm substrate concentration range, at pH 7.0. Fresh NADPH to a final concentration of 0.1 mm and 0.6 units/ml of glutathione reductase was also added for this assay. A minimum of seven substrate concentrations was used within each concentration range, and triplicate measurements were acquired for each substrate concentration. The nonenzymatic reactions were completed in the same manner, without addition of enzyme, and the resulting standard curves used to subtract the background reaction from the enzyme catalyzed one at each concentration point. The initial rates were subsequently fit to the Michaelis-Menten equation to determine kcat and Km, and the catalytic efficiencies were determined from the ratio of kcat/Km. The PubChem Substance and Compound Database (National Center for Biotechnology Information) was used to obtain an 881 bitwise descriptor keyset for each substrate. The PubChem identification numbers are as follows: 1-chloro-2,4-dinitrobenzene, CID = 6; ethacrynic acid, CID = 3278; phenethyl isothiocyante, CID = 16741; p-nitrophenylacetate, CID = 6629; trans-2-nonenal, CID = 5283335; cumene hydroperoxide, CID = 6629. Custom software was used to calculate the quantitative catalytic promiscuity values in the same manner as previously described (18).
Pre-steady State Kinetics
Fluorescence and absorbance measurements were made using a SX20 Stopped-flow spectrophotometer (Applied Photophysics). All samples were prepared and analyzed in phosphate buffer (100 mm sodium phosphate, pH 6.5). For fluorescence measurements with monobromobimane (mBBr), 2 μm GST dimer was preincubated with 1 mm reduced glutathione (GSH) in one syringe. The other syringe was loaded with varying concentrations of mBBr between 0 and 80 μm. Prior to mixing at 1:1 volume ratios the samples in the syringes were equilibrated at 4 °C for 10 min. Data acquisition consisted of at least 15 injections for each concentration. Excitation was at 390 nm and a 420-nm cutoff filter was used for detection of emission. For absorbance measurements with 1-chloro-2,4-dinitrobenzene (CDNB), 4 μm GST was preincubated with 2 mm GSH in one syringe. The other syringe contained 40 μm CDNB. Prior to mixing at a 1:1 volume ratio the samples in the syringes were equilibrated at 4 °C for 10 min. Data acquisition consisted of at least 15 injections for each concentration. Absorbance was monitored at 340 nm. Stopped-flow results exhibiting nonlinear burst/lag phases were fit to the Frieden equation (Equation 12 in text) (31, 32).
RESULTS
Relationship between the Conformational Landscape of GSTs and Catalytic Promiscuity
As pointed out by Friere (33) and exploited by others (29), DSC uniquely provides the partition function for states populated throughout a thermal phase transition. We applied this previously to the conformational landscape of the active site of GSTA1–1 and GSTA4–4 (34). The active site C-terminal helix of GSTA1–1 yields a distinct low temperature DSC transition, not observed in GSTA4–4. Assignment of the low temperature transition to the local active site including the C terminus is based on effects on the DSC by ligands known to lock the disordered C terminus into position based on crystallography, fluorescence spectroscopy, and NMR (21). In addition, a C-terminal truncation mutant of GSTA1–1 lacks the low temperature transition (34). Thus, although previous structural data demonstrate the plasticity of the C terminus, the low temperature DSC transition provides an opportunity to analyze the local energetic landscape around the C terminus and active site, the effects of mutation on this landscape, and the functional effects of the changes in landscape. Analysis of this low temperature DSC transition based on modified Landau Theory provides a surrogate for the free energy profile of the transition.
Here, the results indicate that the free energy landscape for the temperature-induced transition of the C terminus of wild-type GSTA1–1 is broad and barrierless; the local active site energy landscape is “smooth,” with a broad, unimodal distribution of enthalpic states (Fig. 3, a–c). The low temperature transition of Fig. 3a (red line) consists of a set of states with different enthalpies (H, x axis, Fig. 3b) with a smooth distribution of free energies, with no barriers separating the starting and final macrostates. Upon transformation of this free energy profile to the corresponding partition function (Fig. 3c), it is clear that the active site exists as a single unimodal distribution of states with discrete enthalpies prior to the transition (300 K) and at the final temperature of the transition (350 K).
FIGURE 3.

DSC thermograms, free energy profiles, and probability densities for GSTs. Left column, DSC data (○), overall fit from non-two state deconvolutions (black), low temperature transition used for variable-barrier analysis (red), and high temperature transition (gray). Middle column, free energy profiles recovered from variable-barrier analysis of the low temperature transitions. Right column, probability densities recovered from variable-barrier analysis of low temperature transitions prior to transition (300 K), at the “characteristic” temperature of the transition (T0, Table 1), and after thermal transition (350 K). a–c, GSTA1–1 wild-type. d–f, GSTA1–1 W21F:F222W. g–i, GSTA1–1 V111F:R217Y. j–l, GIMFhelix. m–o, GSTA4–4 wild-type. Thermograms are shown after buffer subtraction, native-state baseline analysis, and normalization for protein dimer concentration.
For the wild-type GSTA1–1 near- and far-UV circular dichroism demonstrate that the low temperature transition is due to repacking of tertiary contacts of the C-terminal helix rather than its “unfolding” per se (34). In contrast, the remainder of the GSTA1–1 subunit exhibits classic DSC behavior with two well defined macrostates corresponding to folded and unfolded states with an energy barrier between them (34). We have extended this analysis to mutants of GSTA1–1 and GSTA4–4, engineered to modify active site conformation and catalytic specificity. The mutants are GSTA1–1 W21F:F222W, GSTA1–1 V111F:R217Y, GSTA4–4 F111V:Y217R, and the “GIMFhelix” GSTA1–1 mutant, which includes 14 amino acid substitutions that transform the specificity to nearly that of wild-type GSTA4–4. The GIMFhelix has activity toward the GSTA4–4 substrate hydroxynonenal that is nearly 600-fold greater than wild-type GSTA1–1 (28). High resolution x-ray structures are available for the GIMFhelix mutant (23, 24), but it has not been characterized thermodynamically. The GIMFhelix mutant has well defined electron density for the C terminus even in the absence of ligand, in contrast to GSTA1–1. Thus, these mutants exchange or incorporate structural elements between the two wild-type isoforms to probe the relationship between the C-terminal structure and catalytic function (Fig. 2, c and d).
DSC results and corresponding free energy profiles and partition functions for wild-type and mutant GST are shown in Fig. 3. The GSTA1–1 W21F:F222W mutant has similar behavior to the wild-type except there is a modest energy barrier between initial and final macrostates (Fig. 3, b versus e), and the probability distributions are modestly sharper, indicating slightly less conformational heterogeneity of the starting and final states, compared with wild-type (Fig. 3, c versus f). For the other mutants there is an increasing energy barrier between states that correspond to the pre- and post-transition macrostates. At the extreme end of the trend, with wild-type GSTA4–4 or GIMFhelix mutant, there is a very large energy barrier between states within the lowest temperature transition (Fig. 3n) that can be reasonably fit to the data, and the two states are represented by probability distributions that are very sharp and bimodal, reflecting two populations at each temperature; the two populations correspond to the fully folded active site and the completely unfolded active site, superimposed on the fully folded protein and unfolded protein, respectively. That is, no active site conformational change can be distinguished from the global unfolding. Note that the low temperature transition of the raw thermogram (Fig. 3m) overlaps nearly completely with the major transition for unfolding of the entire protein.
In summary, this set of mutants includes active sites with partition functions that range from nearly immobile and static (GSTA4–4 and GIMFhelix, no low temperature DSC transitions, Fig. 3, m–o) to highly heterogeneous with minimal barriers between many well populated conformations (GSTA1–1 and mutant GSTA1–1 W21F:F222W, Fig. 3, a–f). The free energy barrier heights (β values) between states for the lowest temperature transition of each protein are summarized in Table 1, along with the Σα values, which represent the enthalpic distance between the energy wells of the two macrostates, or the width of the single free energy well in the case of barrierless transitions. This Σα term represents the conformational breadth of the population or the degree of similarity of two conformational minima. For proteins with no clear low temperature transition (GSTA4–4 and GIMFhelix) (Fig. 3, j–o) these values are lower limits, and reflect the energetic barriers to a transition that is part of a cooperative global unfolding, rather than a local conformational change. Note the increased H-scale (x axis) for the middle panels of Fig. 3 for the GSTA1–1 compared with the GST variants and the wider distribution of states at any single temperature in the right panels. Strikingly, GSTA1–1, GSTA1–1 V111F:R217Y, and the W21F:F222W mutant have minimal or negligible energy barriers for the local conformational change (Fig. 3, b, e, and h), and the local environment around the C terminus populates a unimodal distribution at all temperatures throughout the range (Fig. 3, c, f, and i). Collectively, the data indicate that the active sites of these three enzymes are molten globules, or nearly so. In contrast, the active sites of the other GST variants are part of a native cooperatively folded subunit and they only explore new conformational states as part of the thermal cooperative unfolding of the protein.
TABLE 1.
Low temperature transition variable-barrier analysis parameters
| Protein | Barrier height (β) | Σα | T0 | f | R2 |
|---|---|---|---|---|---|
| kJ/mol | K | ||||
| GSTA1–1 | −30.0 | 3665 | 318.8 | 1.00 | 0.9933 |
| GSTA1–1 W21F/F222W | 9.5 | 334 | 320.5 | 0.76 | 0.9925 |
| GSTA1–1 V111F/R217Y | 7.2 | 339 | 327.7 | 1.00 | 0.9931 |
| GIMFhelix | 101.6 | 334 | 332.7 | 0.20 | 0.9992 |
| GSTA4–4 | 1676.1 | 332 | 322.0 | 1.00 | 0.7800 |
In separate studies we have defined previously a quantitative index of catalytic promiscuity (Jcat), based on Shannon Entropy and distributions of kcat/Km values of a specific enzyme with a wide range of structurally distinct substrates, in which the chemical diversity of this “substrate basis set” is used to scale the promiscuity score (18). The chemical diversity within a substrate basis set 〈δset〉 is calculated from a binary keyset of 881 chemical characteristics and normalized. A 〈δset〉 value of 1 reflects the theoretical limit of chemical diversity and a score of 0 is obtained if a single point of chemical space is sampled (no diversity). The resulting promiscuity scores, scaled for the experimental sampling of chemical space, provide a metric of the probability that an enzyme will metabolize a small number of substrates from the basis set (low Jcat) versus all of the substrates in the basis set with equal probability (Jcat = 1). Here we utilized the substrate basis set in Fig. 4, for which the 〈δset〉 value = 0.9, and determined kcat and Km values for each substrate and GST isoform (Table 2). Jcat values were determined for the series of GST variants, and these measures of functional catalytic promiscuity were compared with the partition functions of their active site conformational equilibria, or lowest temperature transitions, and with the energy barriers between the different states in the DSC transitions.
FIGURE 4.

Chemical structures of GST substrates and GSH conjugates. CDNB (1), 1-chloro-2,4-dinitrobenzene; pNPA (2), p-nitrophenylacetate; nonenal (3), trans-2-nonenal; CuOOH (4), cumene hydroperoxide; PEITC (5), phenethyl isothiocyanate; EA (6), ethacrynic acid; mBBr (7), monobromobimane. Substrates 1–6 comprise the basis set used for promiscuity quantitation, and pre-steady state kinetics were examined using CDNB (1) and mBBr (7) as substrates.
TABLE 2.
Catalytic parameters recovered for GSTs
The kcat and Km values are averages of triplicate evaluations for each substrate-enzyme pair, along with the S.D. of triplicate assays.
| Enzyme | CDNB |
Ethacrynic acid |
p-Nitrophenylacetate |
pNPA |
Nonenal |
Cumene hydroperoxide |
||||||
|---|---|---|---|---|---|---|---|---|---|---|---|---|
| kcat | Km | kcat | Km | kcat | Km | kcat | Km | kcat | Km | kcat | Km | |
| s−1 | mm | s−1 s−1 | mm | s−1 | mm | s−1 | mm | s−1 | mm | s−1 | mm | |
| A1–1 WT | 65 ± 1 | 0.45 ± 0.02 | 0.51 ± 0.06 | 0.11 ± 0.04 | 1.90 ± 0.08 | 0.07 ± 0.01 | 7.5 ± 0.2 | 1.3 ± 0.1 | 0.31 ± 0.02 | 0.03 ± 0.01 | 8.2 ± 0.2 | 0.2 ± 0.1 |
| A1–1 W21F/F222W | 179 ± 20 | 1.64 ± 0.25 | 4.71 ± 0.21 | 0.012 ± 0.003 | 5.86 ± 0.31 | 0.014 ± 0.002 | 4.97 ± 0.37 | 0.24 ± 0.03 | 1.39 ± 0.09 | 1.31 ± 0.12 | 13.7 ± 0.9 | 1.35 ± 0.13 |
| A1–1 V111F/R217Y | 101 ± 13 | 1.58 ± 0.32 | 0.60 ± 0.01 | 0.17 ± 0.01 | 6.17 ± 0.18 | 0.08 ± 0.01 | 1.74 ± 0.24 | 1.04 ± 0.19 | 0.39 ± 0.05 | 0.151 ± 0.031 | 13.77 ± 0.98 | 1.386 ± 0.134 |
| A4–4 F111R/Y217R | 15.6 ± 1.8 | 4.20 ± 0.75 | 1.68 ± 0.07 | 0.09 ± 0.01 | 1.73 ± 0.28 | 0.31 ± 0.09 | 0.17 ± 0.03 | 3.15 ± 0.78 | 130 ± 17 | 0.38 ± 0.06 | 0.88 ± 0.09 | 2.40 ± 0.38 |
| GIMFhelix | 40 ± 2 | 2.01 ± 0.12 | 0.26 ± 0.08 | 0.29 ± 0.19 | 1.97 ± 0.14 | 0.20 ± 0.03 | 1.57 ± 0.44 | 3.51 ± 1.44 | 26.4 ± 0.5 | 0.020 ± 0.001 | 3.19 ± 0.24 | 1.83 ± 0.23 |
| A4–4 WT | 9.6 ± 0.6 | 2.45 ± 0.24 | 1.06 ± 0.06 | 0.12 ± 0.02 | 0.67 ± 0.11 | 0.38 ± 0.11 | 1.92 ± 0.69 | 6.11 ± 2.81 | 98 ± 3 | 0.078 ± 0.004 | 0.57 ± 0.11 | 3.28 ± 0.96 |
The results are shown in Fig. 5, and demonstrate a clear correlation between high catalytic promiscuity of detoxication enzymes, and the breadth of the active site conformational partition function of the ligand-free enzyme (Σα). Furthermore, the promiscuity values correlate inversely with the height of the energy barrier between states (β). The results reveal that access to a wide range of chemically disparate transition states is encoded within the unliganded ground states. The wild-type and W21F:F222W mutant are near the upper limit of promiscuity and they have molten globule active sites, or nearly so. In contrast, as catalytic promiscuity decreases, no DSC transitions are observed corresponding to local conformational change, and the lowest temperature transitions reflect a population shift in states with significant energy barriers. Although “flexibility” is often presumed to confer promiscuity, no experimental thermodynamic landscape properties had previously been correlated with this functional behavior.
FIGURE 5.

Correlations of promiscuity and conformational landscape. a, natural logarithm transforms of the full-width at half-maximum (FWHM) values from the probability densities at 300 K recovered from variable-barrier analysis (Fig. 3, right panels) of the low temperature transitions are plotted versus promiscuity (●), along with the linear best fit (black), R2 = 0.8619. b, natural logarithm transforms of free energy barrier heights (Fig. 3, center panels) versus promiscuity (●), with the linear best fit (black), R2 = 0.7666. A barrier height of 0.1 kJ/mol was substituted for the recovered barrier height of −30 kJ/mol for GSTA1–1 wild-type to allow for the ln transform.
Molten Globule Behavior of the Free Enzyme Yields Complex Pre-steady State Kinetic Behavior
A distinguishing feature of the conformational selection model versus induced fit for a promiscuous enzyme is the contribution that conformational equilibria of the ligand-free enzyme can make to the time-dependent rates of reaction. The conformational selection scheme uniquely superimposes the rates of conformational relaxation of the free enzyme on the catalytic reactions during the pre-steady state period, and in some cases this yields kinetic lags or bursts. In fact, conformational relaxation is a necessary condition for the observation of pre-steady state lags and a sufficient condition for pre-steady state bursts, which could also occur due to slow steps following product formation (31, 35). The extent to which a burst or lag is observable depends on [substrate] and solution conditions. Therefore we monitored by stopped-flow methods the pre-steady state behavior of each of the GSTs and variants for which DSC data were available at multiple substrate concentrations and at variable temperature.
Stopped-flow absorbance and fluorescence were used to monitor the rate of product formation with two structurally distinct substrates, with chemical structures shown in Fig. 4. CDNB yields a chromophoric glutathionyl dinitrobenzene (ϵ340 = 9.6 mm−1 cm−1) observable by absorbance, and the GSH conjugate of mBBr is fluorescent (excitation = 394 nm; emission = 490 nm). Multiple concentrations of each substrate were examined. With CDNB as substrate, the wild-type GSTA1–1 yields a pre-steady state burst. At 4 °C, each of the other variants yields linear progress curves at all [CDNB]. The raw stopped-flow data and fits to either “burst” or linear models are shown in Fig. 6. The data for wild-type GSTA1–1 required a nonlinear model and are fit to Equation 12. This relates the rate of product formation to enzyme conformational change, which includes equilibrating conformers E ↔ E′ with an equilibrium constant Keq = [E′]/[E] = kf/kr, where kf and kr are the unimolecular rate constants for the forward and reverse reactions, respectively. The burst is relatively subtle but a Michaelis-Menten model, with linear dependence of reaction progress on time, yielded poor fits at each [CDNB]. The kinetic scheme and equation for the rate of product formation for the wild-type are,
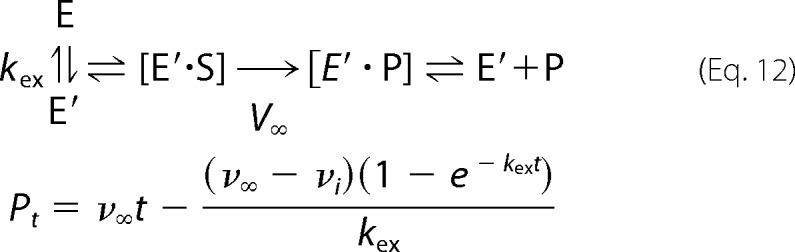 |
where Pt is the accumulation of product at time t, and kex is the substrate concentration-dependent apparent rate of exchange between the two populations (kex = kf + kr[1/1 + [S]/KS]), ν∞ is the steady state velocity, νi is the initial velocity. Here kr is the rate constant for conversion of E′ to E, kf is the constant for conversion of E to E′ and KS is the apparent binding equilibrium constant for S binding to E′. Burst kinetics may also arise when product release is rate-limiting, in the absence of conformational exchange of the free enzyme, as noted for GSTA1–1 and CDNB. Here we utilize the model described by Equation 12, for the sake of comparison to the results below that require this model. Importantly, as shown in Fig. 7, the plots of kex versus [S] demonstrate that, regardless of whether product release is rate-limiting, a pre-equilibrium between E and E′ is operative. In summary, raw data for each of the proteins except GSTA1–1 fit well to linear time dependence at all [CDNB]; only the wild-type GSTA1–1 deviates from linear kinetics and Equation 12 adequately describes the data.
FIGURE 6.

Pre-steady state kinetics of GSTs with CDNB and mBBr. Left columns, absorbance stopped-flow kinetic data for each GST or variant at multiple, representative, concentrations of CDNB. a, GSTA1–1 wild-type; b, GSTA1–1 W21F:F222W; c, GSTA1–1 V111F:R217Y; d, GIMFhelix; e, GSTA4–4. Right columns, fluorescence stopped-flow with multiple representative concentrations of mBBr. f, GSTA1–1 wild-type; g, GSTA1–1 W21F:F222W; h, GSTA1–1 V111F:R217Y; i, GIMFhelix; j, GSTA4–4. The substrate concentrations for data collected using CDNB are: 0.0125 mm (cyan), 0.025 mm (orange), 0.075 mm (purple), 0.15 mm (green), 0.3 mm (blue), and 0.5 mm (red). The substrate concentrations for data collected using mBBr are: 5 μm (cyan), 10 μm (orange), 20 μm (purple), 30 μm (green), 40 μm (blue), 80 μm (red). The black lines are the fits to a linear progress curve (b-e and h-j) or Equation 12 for A1–1 with CDNB (a), or mBBr (f), or for W21F:F222W with mBBr (g).
FIGURE 7.

kexversus substrate concentration. The recovered kex values are plotted versus the fraction of maximum substrate used, at low extent of turnover. Orange, GSTA1–1 W21F:F222W with mBBr, asymptote = 23 s−1; cyan, GSTA1–1 wild-type with mBBr, asymptote = 12 s−1; red, GSTA1–1 wild-type with CDNB, asymptote = 4 s−1. The recovered asymptotes are different for the wild-type with different substrates, indicating that CDNB and mBBr select different conformations. The decrease in kex with increasing [mBBr] for wild-type and W21F:F222W require pre-existing conformations of free enzyme, E and E′. In some cases the error of the kex value is less than the size of the data point.
In contrast to CDNB, with mBBr as substrate, the W21F:F222W mutant yields a distinct pre-steady state lag phase at all substrate concentrations, whereas the wild-type A1–1 exhibits a very pronounced burst (Fig. 6, f and g). For comparison, the substrate-specific isoform GSTA4–4 exhibits no pre-steady state lag or burst with either substrate, although both are poor substrates. Also, the GIMFhelix mutant and GSTA1–1 V111F:R217Y exhibit linear kinetics with all concentrations of mBBr, as with CDNB. The concentration dependence of representative pre-steady state progress curves are also shown in Fig. 6, for each protein with representative mBBr concentrations using Equation 12 or a simple Michaelis-Menten model to fit the data (linear with respect to time).
Notably, among the two most promiscuous enzymes (GSTA1–1 and GSTA1–1 W21F:F222W) there are substrate-dependent and isoform-dependent lags or bursts on the millisecond time scale, suggestive of kinetically discernible conformational changes. The observation of substrate-dependent and isoform-dependent pre-steady state behavior indicates equilibrating states of enzyme that have distinct substrate selectivities. The absence of a lag or burst with each of the other proteins is consistent with a narrow range of conformations but does not prove the absence of an equilibrating population. However, the fortuitous observation of lags and burst with GSTA1–1 and W21F:F222W provides an opportunity to study this equilibrium of states in greater detail. Therefore, we have performed further analysis with GSTA1–1 with CDNB and both GSTA1–1 and W21F:F222W with CDNB and mBBr.
Specifically, the model of Equation 12 used to fit the data predicts either pre-steady state lag or burst depending on the rates of exchange between enzyme conformations, the relative affinities of substrate for E versus E′, and the relative activities of the enzyme conformations. If the equilibrium of states lies far from the conformation that is most catalytically active (for example, E predominates but E′ is more active), lags are possible. The magnitude of the burst or lag is a complex function of the relative rates and equilibrium constants, but the presence of a lag requires a kinetically significant step prior to binding. The recent retrospective analysis by Vogt and Di Cera (9) of stopped-flow binding data for enzymes with varying combinations of parameters provides a thoughtful summary of the range of behavior that can be observed for kex in the case of induced fit versus conformational selection. In fact, kex provides a diagnostic marker for the two limiting cases with ligand binding.
Directly analogous to the demonstration by Vogt and Di Cera (9) and Fersht (36) for ligand binding, the dependence of kex on [S] for catalysis by a substrate-specific enzyme is also diagnostic for conformational selection versus induced fit. Specifically, if kex decreases hyperbolically with increasing [S] or if kex is independent of [S] then it must be the case that a significant fraction of enzyme populates a conformation that does not bind substrate in equilibrium with a conformation that does bind (conformational selection). Alternatively, if kex increases with [S], then either conformational selection or induced fit may be operative. Therefore, it is particularly instructive to consider kex versus [S] for the cases where Equation 12 is required to fit the raw progress curves. The recovered values for kex with wild-type GSTA1–1 at varying [CDNB] or [mBBr] are plotted in Fig. 7. The kex versus [mBBr] plot unambiguously demonstrates that conformational selection is operative for mBBr. Similarly, the decrease in kex for W21F:F222W as a function of [mBBr] indicates conformational selection (9). The increasing kex versus [CDNB] for GSTA4–4 is also consistent with, but not proof of, conformational selection with this substrate. In combination, the opposing responses of kex to the different substrates, combined with the DSC data that reveal a smooth broad conformational landscape (low β values, high Σα values), suggest that different conformations are selected by the two substrates.
In addition, the kex versus [S] plots indicate that different substrates bind to different conformations because the asymptotic kex values at high [S] are different for CDNB versus mBBr (limiting kex = ∼4 s−1 versus ∼12 s−1). Different asymptotic kex values for different substrates utilizing the same active site requires divergent enzyme conformations for binding of various ligands (9).
Activation Energy
The conformational exchange model predicts a temperature-dependent kex, with a decreasing lag phase at higher temperatures that accelerate conformational exchange. Therefore, the temperature dependence of the stopped-flow behavior for W21F:F222W was determined at a single concentration of mBBr. As predicted by the model, the lag phase became less apparent as the temperature increased, and by 10 °C it was undetectable (data not shown). The temperature dependence of the exchange reaction provides the activation energy for the conversion via transition state theory. Specifically, the slope of log kex versus 1/T is a crude estimate of the activation energy barrier to conformational exchange, Ea, from the Arrhenius equation, k = Ae−Ea/RT. Thus, without knowledge of the “frequency factor,” A, the rate constant must be measured at multiple temperatures to calculate Ea. Because the lag and burst phase were extremely sensitive to temperature and no lag phase was detectable at temperatures above 5 °C, the temperature dependence of kex was difficult to quantify. Therefore, two methods were used to estimate the Ea. In the first case we assumed A = 1, as is commonly done for the purpose of estimation, and the individual rate constants kf and kr for forward and reverse reactions of E ↔ E′ were equal and each was half of apparent kex (kex = kf + kr), or 10/s at pH 6.5 for the W21F:F222W mutant. This pH is identical to the conditions used for the DSC experiments. With these assumptions, the Ea is 5.3 kJ/mol. For the second estimate we assumed a lower limit of kex of 50/s at 10 °C, which is a conservative estimate of the fastest exchange detectable for the time resolution of the stopped-flow method. This yields Ea = 7 kJ/mol, which is an upper limit, and A = ∼1000/s. Obviously, these are rough estimates but they are in remarkable agreement with the DSC results for which the estimated energy barrier (β) for the low temperature transition of W21F:F222W is 9.5 kJ/mol. These activation energies are in the range expected for facile conformational change detectable on this time scale.
DISCUSSION
Since the 1980s the term “molten globule” has been used widely to describe improperly folded proteins resulting from “failed” protein engineering efforts, or intermediate states populated during the folding of native proteins. Molten globules are operationally defined by several criteria that, collectively, indicate structural heterogeneity with increased solvent exposure of hydrophobic patches, significant secondary and tertiary structure despite noncooperative unfolding, and decreased or absent function. Molten globules are not simply partially unfolded proteins, but rather protein ensembles with greater structural diversity than “natively folded” proteins, and they have been considered as a “third equilibrium” state that is distinct from the unfolded and folded states. Molten globule forms of enzymes were generally considered to lack significant catalytic prowess or to be suboptimal catalysts. However, the recent observation that a variant of chorismate mutase with molten globule features can be an efficient enzyme challenged our understanding of the relationship between enzyme structure and catalysis (37, 38).
The results of the current work, in contrast, demonstrate that nature exploits molten globule behavior to optimize the function of a detoxication enzyme, to the extent that the low temperature DSC transitions in wild-type GSTA1–1 and promiscuous GST mutants correspond to local conformational heterogeneity and rapidly fluctuating structures. These data are the first to provide direct thermodynamic support that a “natural” active site can behave as a molten globule incorporated into a protein core with well defined native structure. The stopped-flow and DSC experiments indicate that the partition function of the active site is optimized with GSTA1–1 by nature to allow access to chemically disparate transition states via a ground state ensemble and substrate-dependent conformational selection, whereas minimizing the kinetic cost of conformational rearrangement. The stopped-flow results demonstrate that Fig. 1d is a useful model to describe the interaction of GSTA1–1 or W21F:F222W with different substrates. In marked contrast, the substrate-specific GSTA4–4 exhibits minimal substrate-dependent conformational selection; multiple substrates are turned over slowly by a rigid scaffold enzyme.
The resulting model is an extension of the “traditional” conformational selection model with a broad, flat landscape optimized for enzymatic detoxication (Fig. 8). Although it is widely presumed that promiscuous detoxication enzymes are “flexible,” this is the first quantitative analysis that demonstrates a correlation between functional promiscuity and a thermodynamic measure of flexibility (Fig. 5). It is striking that, in particular, the width of the conformational distribution, as measured by Σα, correlates well with functional promiscuity. Based on these results, it is interesting to speculate that other drug metabolizing enzymes have molten globular active sites. Although it is intuitively easy to understand how facile conformational change could be an asset for enzymes that metabolize a wide range of substrates, the DSC results demonstrate that the ability to access variable transition states is encoded in the ground state population from which conformers are selected. The stopped-flow results further reveal the logical corollary; different ground state conformations “select” different substrates. For GSTA1–1, nature has optimized catalytic promiscuity by utilizing a localized molten globule to minimize the kinetic liability of conformational sampling, whereas providing access to a wide range of substrate space. Interestingly, the modest increase in promiscuity of the wild-type GSTA1–1 compared with the W21F:F222W mutant comes with a significant increase in the width of the energy surface (Σα) and a large decrease in barrier height (β). Speculatively, this suggests that, if promiscuity is an evolutionary end point of detoxication enzymes, then good promiscuity can be achieved without attaining localized molten globule active sites; the molten globule active site is, possibly, achieved late in the evolutionary process.
FIGURE 8.
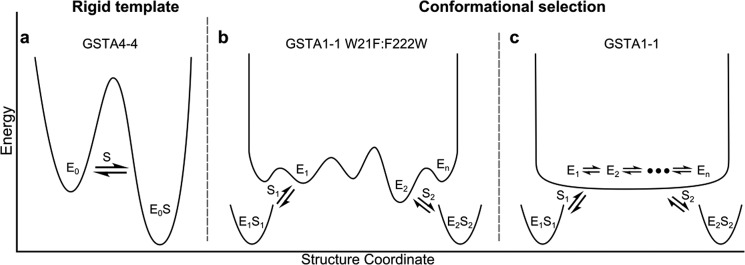
Conformational landscape for GST isoforms. a, the substrate-free enzyme exists at the bottom of a narrow energy well. The active site of a specific enzyme (GSTA4–4) forms a rigid template, enabling high catalytic efficiency for its cognate substrate, but comparatively low kinetic efficiency toward structurally diverse substrates. b, a conformational selection model with small energy barriers separating structural states. A promiscuous detoxication enzyme (GSTA1–1 W21F:F222W) exhibits a range of pre-existing conformers to accommodate a variety of structurally diverse substrates, but is not kinetically optimized for promiscuity; a substrate-dependent lag phase is observed in pre-steady state kinetically analysis. c, a conformational selection model with barrierless transitions between states. A highly promiscuous enzyme (GSTA1–1) is optimized for detoxication of a wide array of substrates, without an energetic cost for conformational shifts of the active site. No lag phase is observed in pre-steady state kinetic analysis; however, the overall catalytic efficiency is reduced when compared with a structurally similar specific enzyme metabolizing its preferred substrate.
It is important to emphasize that the model in Fig. 1d, schematized in terms of an energy coordinate in Fig. 8, b and c panels, is a minimal model. It is unlikely that each substrate binds to a single conformation within the ensemble, but rather to several related conformations. However, we cannot distinguish each of the exchange processes between each of the conformations that bind substrate with the current methods. Thus several conformations within the landscape may participate in binding and catalysis for each different substrate, but the important point is that they are not identical sets of conformations for the different substrates. There is not necessarily a unique conformation that binds to each substrate and some substrates may bind to similar sets of conformations. Finally, although the results suggest that an extension of the conformational selection model is consistent with the behavior of GSTA1–1, this does not mean that all detoxication enzymes exploit this behavior to achieve catalytic promiscuity. Substrate-dependent induced fit could be operative for other enzymes, and it is possible that some use both induced fit and conformational selection.
Acknowledgment
We thank the Center for Intracellular Delivery of Biologics Bioanalytical Core facility at the University of Washington, Department of Medicinal Chemistry.
This work was supported, in whole or in part, by National Institutes of Health Grant GM862284 (to W. M. A.) and the Swedish Research Council and Swedish Cancer Society (to B. M.).
- DSC
- differential scanning calorimetry
- GSH
- glutathione
- CDNB
- 1-chloro-2,4-dinitrobenzene
- mBBr
- monobromobimane pNPA, p-nitrophenylacetate.
REFERENCES
- 1. Monod J., Wyman J., Changeux J. P. (1965) On the nature of allosteric transitions. A plausible model. J. Mol. Biol. 12, 88–118 [DOI] [PubMed] [Google Scholar]
- 2. Koshland D. E., Jr., Némethy G., Filmer D. (1966) Comparison of experimental binding data and theoretical models in proteins containing subunits. Biochemistry 5, 365–385 [DOI] [PubMed] [Google Scholar]
- 3. Ma B., Nussinov R. (2010) Enzyme dynamics point to stepwise conformational selection in catalysis. Curr. Opin. Chem. Biol. 14, 652–659 [DOI] [PMC free article] [PubMed] [Google Scholar]
- 4. Benkovic S. J., Hammes G. G., Hammes-Schiffer S. (2008) Free-energy landscape of enzyme catalysis. Biochemistry 47, 3317–3321 [DOI] [PubMed] [Google Scholar]
- 5. Hammes G. G., Chang Y. C., Oas T. G. (2009) Conformational selection or induced fit. A flux description of reaction mechanism. Proc. Natl. Acad. Sci. U.S.A. 106, 13737–13741 [DOI] [PMC free article] [PubMed] [Google Scholar]
- 6. Weikl T. R., von Deuster C. (2009) Selected-fit versus induced-fit protein binding. Kinetic differences and mutational analysis. Proteins 75, 104–110 [DOI] [PubMed] [Google Scholar]
- 7. Ekonomiuk D., Caflisch A. (2009) Activation of the West Nile virus NS3 protease. Molecular dynamics evidence for a conformational selection mechanism. Protein Sci. 18, 1003–1011 [DOI] [PMC free article] [PubMed] [Google Scholar]
- 8. Jackson C. J., Foo J. L., Tokuriki N., Afriat L., Carr P. D., Kim H. K., Schenk G., Tawfik D. S., Ollis D. L. (2009) Conformational sampling, catalysis, and evolution of the bacterial phosphotriesterase. Proc. Natl. Acad. Sci. U.S.A. 106, 21631–21636 [DOI] [PMC free article] [PubMed] [Google Scholar]
- 9. Vogt A. D., Di Cera E. (2012) Conformational selection or induced fit? A critical appraisal of the kinetic mechanism. Biochemistry 51, 5894–5902 [DOI] [PMC free article] [PubMed] [Google Scholar]
- 10. Guengerich F. P. (2006) Cytochrome P450s and other enzymes in drug metabolism and toxicity. AAPS J. 8, E101–111 [DOI] [PMC free article] [PubMed] [Google Scholar]
- 11. Dong D., Ako R., Hu M., Wu B. (2012) Understanding substrate selectivity of human UDP-glucuronosyltransferases through QSAR modeling and analysis of homologous enzymes. Xenobiotica 42, 808–820 [DOI] [PMC free article] [PubMed] [Google Scholar]
- 12. Hou L., Honaker M. T., Shireman L. M., Balogh L. M., Roberts A. G., Ng K. C., Nath A., Atkins W. M. (2007) Functional promiscuity correlates with conformational heterogeneity in A-class glutathione S-transferases. J. Biol. Chem. 282, 23264–23274 [DOI] [PubMed] [Google Scholar]
- 13. Zhang W., Dourado D. F., Fernandes P. A., Ramos M. J., Mannervik B. (2012) Multidimensional epistasis and fitness landscapes in enzyme evolution. Biochem. J. 445, 39–46 [DOI] [PubMed] [Google Scholar]
- 14. Thummel K. E., Wilkinson G. R. (1998) In vitro and in vivo drug interactions involving human CYP3A. Annu. Rev. Pharmacol. Toxicol. 38, 389–430 [DOI] [PubMed] [Google Scholar]
- 15. Ekroos M., Sjögren T. (2006) Structural basis for ligand promiscuity in cytochrome P450 3A4. Proc. Natl. Acad. Sci. U.S.A. 103, 13682–13687 [DOI] [PMC free article] [PubMed] [Google Scholar]
- 16. Armstrong R. N. (1997) Structure, catalytic mechanism, and evolution of the glutathione transferases. Chem. Res. Toxicol. 10, 2–18 [DOI] [PubMed] [Google Scholar]
- 17. Mannervik B., Danielson U. H. (1988) Glutathione transferases. Structure and catalytic activity. CRC Crit. Rev. Biochem. 23, 283–337 [DOI] [PubMed] [Google Scholar]
- 18. Nath A., Atkins W. M. (2008) A quantitative index of substrate promiscuity. Biochemistry 47, 157–166 [DOI] [PubMed] [Google Scholar]
- 19. Blikstad C., Shokeer A., Kurtovic S., Mannervik B. (2008) Emergence of a novel highly specific and catalytically efficient enzyme from a naturally promiscuous glutathione transferase. Biochim. Biophys. Acta 1780, 1458–1463 [DOI] [PubMed] [Google Scholar]
- 20. Hubatsch I., Ridderström M., Mannervik B. (1998) Human glutathione transferase A4–4. An α class enzyme with high catalytic efficiency in the conjugation of 4-hydroxynonenal and other genotoxic products of lipid peroxidation. Biochem. J. 330, 175–179 [DOI] [PMC free article] [PubMed] [Google Scholar]
- 21. Zhan Y., Rule G. S. (2004) Glutathione induces helical formation in the carboxyl terminus of human glutathione transferase A1–1. Biochemistry 43, 7244–7254 [DOI] [PubMed] [Google Scholar]
- 22. Le Trong I., Stenkamp R. E., Ibarra C., Atkins W. M., Adman E. T. (2002) 1.3-Å resolution structure of human glutathione S-transferase with S-hexyl glutathione bound reveals possible extended ligandin binding site. Proteins 48, 618–627 [DOI] [PubMed] [Google Scholar]
- 23. Grahn E., Novotny M., Jakobsson E., Gustafsson A., Grehn L., Olin B., Madsen D., Wahlberg M., Mannervik B., Kleywegt G. J. (2006) New crystal structures of human glutathione transferase A1–1 shed light on glutathione binding and the conformation of the C-terminal helix. Acta Crystallogr. D Biol. Crystallogr. 62, 197–207 [DOI] [PubMed] [Google Scholar]
- 24. Balogh L. M., Le Trong I., Kripps K. A., Tars K., Stenkamp R. E., Mannervik B., Atkins W. M. (2009) Structural analysis of a glutathione transferase A1–1 mutant tailored for high catalytic efficiency with toxic alkenals. Biochemistry 48, 7698–7704 [DOI] [PMC free article] [PubMed] [Google Scholar]
- 25. Bruns C. M., Hubatsch I., Ridderström M., Mannervik B., Tainer J. A. (1999) Human glutathione transferase A4–4 crystal structures and mutagenesis reveal the basis of high catalytic efficiency with toxic lipid peroxidation products. J. Mol. Biol. 288, 427–439 [DOI] [PubMed] [Google Scholar]
- 26. Ibarra C., Nieslanik B. S., Atkins W. M. (2001) Contribution of aromatic-aromatic interactions to the anomalous pKa of tyrosine-9 and the C-terminal dynamics of glutathione S-transferase A1–1. Biochemistry 40, 10614–10624 [DOI] [PMC free article] [PubMed] [Google Scholar]
- 27. Wang R. W., Pickett C. B., Lu A. Y. (1989) Expression of a cDNA encoding a rat liver glutathione S-transferase Ya subunit in Escherichia coli. Arch. Biochem. Biophys. 269, 536–543 [DOI] [PubMed] [Google Scholar]
- 28. Nilsson L. O., Gustafsson A., Mannervik B. (2000) Redesign of substrate-selectivity determining modules of glutathione transferase A1–1 installs high catalytic efficiency with toxic alkenal products of lipid peroxidation. Proc. Natl. Acad. Sci. U.S.A. 97, 9408–9412 [DOI] [PMC free article] [PubMed] [Google Scholar]
- 29. Muñoz V., Sanchez-Ruiz J. M. (2004) Exploring protein-folding ensembles. A variable-barrier model for the analysis of equilibrium unfolding experiments. Proc. Natl. Acad. Sci. U.S.A. 101, 17646–17651 [DOI] [PMC free article] [PubMed] [Google Scholar]
- 30. Naganathan A. N., Sanchez-Ruiz J. M., Muñoz V. (2005) Direct measurement of barrier heights in protein folding. J. Am. Chem. Soc. 127, 17970–17971 [DOI] [PubMed] [Google Scholar]
- 31. Frieden C. (1979) Slow transitions and hysteretic behavior in enzymes. Annu. Rev. Biochem. 48, 471–489 [DOI] [PubMed] [Google Scholar]
- 32. Frieden C. (1970) Kinetic aspects of regulation of metabolic processes. The hysteretic enzyme concept. J. Biol. Chem. 245, 5788–5799 [PubMed] [Google Scholar]
- 33. Freire E. (1995) Differential scanning calorimetry. Methods Mol. Biol. 40, 191–218 [DOI] [PubMed] [Google Scholar]
- 34. Honaker M. T., Acchione M., Sumida J. P., Atkins W. M. (2011) Ensemble perspective for catalytic promiscuity. Calorimetric analysis of the active site conformational landscape of a detoxification enzyme. J. Biol. Chem. 286, 42770–42776 [DOI] [PMC free article] [PubMed] [Google Scholar]
- 35. Ainslie G. R., Jr., Shill J. P., Neet K. E. (1972) Transients and cooperativity. A slow transition model for relating transients and cooperative kinetics of enzymes. J. Biol. Chem. 247, 7088–7096 [PubMed] [Google Scholar]
- 36. Fersht A. (2002) Structure and Mechanism in Protein Science: A Guide to Enzyme Catalysis and Protein Folding, pp. 139–158, W.H. Freeman, New York [Google Scholar]
- 37. Vamvaca K., Vögeli B., Kast P., Pervushin K., Hilvert D. (2004) An enzymatic molten globule. Efficient coupling of folding and catalysis. Proc. Natl. Acad. Sci. U.S.A. 101, 12860–12864 [DOI] [PMC free article] [PubMed] [Google Scholar]
- 38. Pervushin K., Vamvaca K., Vögeli B., Hilvert D. (2007) Structure and dynamics of a molten globular enzyme. Nat. Struct. Mol. Biol. 14, 1202–1206 [DOI] [PubMed] [Google Scholar]