

Abstract
Feedback connections are prevalent throughout the cerebral cortex, yet their function remains poorly understood. Previous studies in anesthetized monkeys found that inactivating feedback from extrastriate visual cortex produced effects in striate cortex that were relatively weak, generally suppressive, largest for visual stimuli confined to the receptive field center, and detectable only at low stimulus contrast. We studied the influence of corticocortical feedback in alert monkeys using cortical cooling to reversibly inactivate visual areas 2 (V2) and 3 (V3) while characterizing receptive field properties in primary visual cortex (V1). We show that inactivation of feedback from areas V2 and V3 results in both response suppression and facilitation for stimuli restricted to the receptive field center, in most cases leading to a small reduction in the degree of orientation selectivity but no change in orientation preference. For larger-diameter stimuli that engage regions beyond the center of the receptive field, eliminating feedback from V2 and V3 results in strong and consistent response facilitation, effectively reducing the strength of surround suppression in V1 for stimuli of both low and high contrast. For extended contours, eliminating feedback had the effect of reducing end stopping. Inactivation effects were largest for neurons that exhibited strong surround suppression before inactivation, and their timing matched the dynamics of surround suppression under control conditions. Our results provide direct evidence that feedback contributes to surround suppression, which is an important source of contextual influences essential to vision.
Introduction
A critical function of the visual system is to interpret locally detected features within the broader context of the image. Such contextual interactions are thought to inform many perceptual phenomena ranging from lightness and color constancy (Paradiso et al., 2006) to figure–ground segregation (Lamme, 1995). In the context provided by natural images, it has been shown that stimulus encoding in the cortex becomes sparser and more informative (Vinje and Gallant, 2000) and that “top-down” signals related to attention are important (Gilbert and Sigman, 2007).
One of the best-characterized forms of contextual modulation is “surround suppression,” whereby a neuron's response to a stimulus in its receptive field center is suppressed when that stimulus is made larger (Sceniak et al., 1999). In primary visual cortex (V1), a neuron's receptive field is thought to be comprised of a center mechanism sufficient for driving responses and establishing basic stimulus selectivity and a surround mechanism that incorporates inputs from a broader pool of neurons and modifies responses by divisive normalization (Carandini et al., 1997; Cavanaugh et al., 2002).
While the center mechanism in V1 is thought to be mediated primarily by feedforward inputs, such as those from the LGN that are responsible for establishing orientation preference (Hubel and Wiesel, 1962; Reid and Alonso, 1995), the circuits mediating normalization from the surround are not as well understood. Horizontal connections intrinsic to V1 are likely a key component of the circuit mediating surround suppression, especially given the long distances their axons traverse across cortex and their selective targeting of like-orientation domains (Stettler et al., 2002). Feedback connections, on the other hand, have typically been assigned a supportive role in surround suppression that compensates where horizontal connections appear inadequate. For instance, the larger receptive fields and faster conduction velocities of feedback neurons seem particularly well suited for mediating suppression from distant regions of the surround that are beyond the visuotopic extent covered by horizontal connections (Angelucci and Bressloff, 2006).
Previous studies in anesthetized monkeys have reported that only a minority of V1 neurons are affected by inactivation of feedback from visual area 2 (V2) or MT (Sandell and Schiller, 1982; Hupé et al., 1998, 2001b). When effects were observed, inactivation almost always reduced responses in V1, typically did so most for visual stimuli confined to the receptive field center, and only when those stimuli were of low contrast. Overall, the results of these studies have been taken as evidence that corticocortical feedback provides a weak, predominantly excitatory influence on the receptive field center that is particularly important for processing objects of low visual salience. Here we describe studies where we have reversibly inactivated V2 and V3 of alert macaque monkeys while recording visual response properties in V1. Our results differ from those of previous studies in important ways, and provide strong evidence that feedback directly contributes to surround suppression in V1.
Materials and Methods
Training and setup.
Two male macaques (Macaca mulatta, 7–10 kg) were each implanted with a custom titanium head post and a scleral search coil for monitoring eye position. The monkeys were then seated comfortably in custom chairs (Crist Instrument) and trained to fixate a central cross within a 1–1.5° window for 2–3 s to receive a juice reward. Eye position and velocity (analog differentiator, low-pass, −3 dB at 50 Hz) were digitized and stored to disk at 250 Hz for off-line analysis. Before electrophysiological recordings, each animal was implanted with a recording cylinder (Crist Instrument) anterior (Monkey M) or posterior (Monkey R) to three cryoloops implanted in the lunate sulcus of the right hemisphere. For the cylinder placed anterior to the lunate sulcus, electrodes (epoxy-insulated tungsten microelectrodes; FHC) penetrated at a shallow angle relative to the cortical surface at the site of entry and passed through the prelunate gyrus and lunate sulcus before reaching the dorsal half of V1 on the operculum. For the cylinder placed posterior to the lunate sulcus, electrodes penetrated approximately perpendicular to the cortical surface of V1 on the operculum. All animal procedures complied with the National Institutes of Health Guide for Care and Use of Laboratory Animals and were approved by the Harvard Medical Area Standing Committee on Animals.
Stimulus protocol and electrophysiology.
Stimuli were displayed on a ViewSonic P225f monitor at a refresh rate of 100 Hz. The screen measured 29 cm high by 38 cm wide and was viewed at a distance of 90 cm. The screen resolution was 768 by 1024 pixels. The analog voltage signals from the extracellular recordings were digitized at 25 kHz and saved to computer disk using a Cambridge Electronic Design 1401 data acquisition system. Spike2 software was used to confirm single-unit isolation and ensure uniform signal composition.
After isolating a single-unit or multiunit cluster, we manually located the approximate borders of the receptive field [minimum response field (RF)] and determined the optimal spatial and temporal frequencies by using a small (diameter, 0.15°) circular grating patch. RFs were located at eccentricities between 2 and 6°, which were targeted so as to match the approximate retinotopy of regions in the lunate sulcus (V2/V3) in close proximity to the cryoloops. All subsequent tuning data were obtained using circular patches of drifting sinusoidal gratings of mean luminance matching the surround at the optimal spatial and temporal frequencies, centered in the RF, with a 0.04° graded-contrast perimeter to reduce edge effects. Outside the circular patch, the rest of the screen (18 by 24°, visual angle) was kept at the mean luminance of 42 cd · m−2. Each stimulus presentation had a motion-onset delay of 250 ms (Monkey M) or 300 ms (Monkey R) after appearance and then moved for either 750 ms (Monkey M) or 500 ms (Monkey R). Tuning curves for our electrophysiology data were calculated from spike counts collected in the first 500 ms after motion onset, unless stated otherwise. Between successive stimuli, we interposed 500 ms blanks at the mean luminance to determine the spontaneous firing rate. Each stimulus condition was presented at least five times. The values of the parameter being varied in each experiment were always presented in blockwise random order.
Direction/orientation tuning data were obtained by using sinusoidal gratings restricted to the high-contrast summation field (SFhc; defined in Analysis) moving in eight directions (0 to 315° in 45° steps) at high (99%) contrast; contrast-tuning data were obtained with sinusoidal gratings restricted to the SFhc moving in the preferred direction at luminance contrasts ranging from 1–99% in logarithmic steps. Area summation data were obtained with sinusoidal gratings ranging in diameter from 0.125 to 8° (Monkey M) or from 0.16 to 6.3° (Monkey R) of visual angle in logarithmic steps. For Monkey M, diameters sometimes ranged only from 0.125 to 4° or from 0.25 to 8°, depending on an initial qualitative assessment regarding the size of the receptive field and at which diameter suppression appeared to plateau. In one case, the range was extended to 16° to accommodate a slightly larger receptive field (see Fig. 8A). For recordings from the calcarine sulcus in Monkey M, the range of diameters presented was always extended to include diameters of 12 or 16°. In a subset of experiments (n = 7, Monkey M), one half of the grating extending beyond the borders of the receptive field center was masked out. We alternated between masking the half closest to the vertical meridian and that farthest from the vertical meridian. The full range of diameters was each presented at two different contrast levels, either in “block” design (Monkey M) or randomly interleaved (Monkey R). The two contrast levels were chosen online from the linear region of the contrast response function. Low contrasts (mean, 11%; minimum, 2%; maximum, 35%) were chosen such that they were near the low end of the contrast response function, but elicited responses that were significantly greater than the spontaneous firing rate. High contrasts (mean, 53%; minimum, 12%; maximum, 99%) were chosen such that they elicited responses that were <90% of the saturation response for each cell. Length-tuning data were obtained with black or white high-contrast bars ranging in length from 0.10 to 12.8° (Monkey M) or from 0.16 to 6.3° (Monkey R) of visual angle in logarithmic steps. Cell clusters were not always tested for all tuning responses.
Figure 8.

Correlation between the strength of surround suppression and the magnitude of feedback inactivation effects. A, B, Area summation curves measured in V1 before (red) and during (blue) cooling. Mean ± SEM responses are presented. Dashed lines indicate spontaneous activity. A, Example unit that is weakly surround suppressed and is only marginally affected by inactivation of feedback. B, Example unit that is strongly surround suppressed and facilitated in its response to large-diameter gratings. C, Correlation of percentage surround suppression and effect magnitude index (Rcool − Rcontrol/Rcool + Rcontrol) for each unit from Monkey M (orange squares) and Monkey R (magenta crosses). Effect magnitude indices were calculated from responses to grating diameters (RF units) of 6.3 (Monkey R) and 8 (Monkey M). Dashed lines are linear fits to data for Monkey M (orange; r = 0.83, p < 0.001) and Monkey R (magenta; r = 0.50, p = 0.004). Arrows in C indicate the examples in A and B.
Cooling protocol.
After collecting a set of control (precooling) tuning data, we started the cooling process by pumping chilled methanol through the cryoloops until they reached temperatures between 1 and 5°C, which brings cortical temperature down to 20°C within a range of ∼1.6 mm (Lomber et al., 1999). We obtained a new set of tuning curves ∼5 min after the cooled temperature stabilized and measured postcooling tuning curves if the units remained properly isolated. The complete data cycle usually lasted between 40 and 60 min. We rarely obtained postcooling orientation tuning curves (n = 7) because of time constraints and the observation early on in the study that cooling had little, if any, effect on orientation tuning (see Fig. 2). We therefore focused on trying to obtain postcooling area summation curves when possible (n = 19). Previous work has shown that daily sessions over a 10 month time span of cooling cortex to temperatures of 3–5°C for up to 2 h at a time causes minimal neuropathology in the neocortex and hippocampus of rodents and cats (Yang et al., 2006). To test for any permanent damage produced by repeated daily cooling sessions in our study, we analyzed the strength of surround suppression during control and cool conditions as a function of session number separately in each monkey. Feedback inactivation effects (increases or decreases in percentage surround suppression during cooling) were observed for early and late sessions in both monkeys, and we observed no decrease in the precooling percentage surround suppression over multiple sessions. We take this as evidence that repeated cooling sessions did not cause permanent cortical damage in V1 or the lunate sulcus, and we await postmortem histological analysis for confirmation.
Figure 2.

Effects of feedback inactivation on V1 orientation tuning. A, Direction tuning curves measured for two units in V1 before (red) and during (blue) cooling. Mean ± SEM responses are presented in polar coordinates. B, Direction tuning curve for the population of orientation-selective (left) and direction-selective (right) units before (red) and during (blue) cooling. Mean ± SEM responses are presented relative to preferred direction. All values were normalized to the range observed in the control responses. C, Preferred orientations before and during cooling. Error bars indicate SEM from parametric bootstrap. Filled symbols indicate statistically significant changes in preferred orientation (parametric bootstrap, p < 0.05). Triangles, Single units; circles, multiunit recordings. D, Tuning bandwidth (half-width at half height of the Gaussian fit) before and during cooling. Triangles, Single units; circles, multiunit recordings. E, Circular variance before and during cooling. Conventions are the same as in C. Arrows in C–E indicate the single-unit examples in A. T, Top; B, bottom.
Measurements of cortical temperature.
To confirm that the observed effects of cooling were due to inactivation of feedback from V2 and V3 and not due to direct cooling of V1, we directly recorded the cortical temperature in V1 at the site of our recordings and in the calcarine sulcus. To do this, we advanced a fine temperature probe (175 μm diam. attached to a microelectrode; see Fig. 9A, inset) into V1 and, after confirming the location with multiunit RF maps, recorded the temperature when the cryoloops were cooled to the same temperature (1–5°C) used in all of our experiments. It is important to realize that the temperature measured at the apex of the cryoloop is considerably colder than that achieved in the adjacent cortex. For example, at a cryoloop temperature of 3°C, the underlying cortex was cooled from a baseline temperature of ∼38°C to a cooled temperature just below 20°C, which is a reduction of 18°C. Under these same conditions, the temperature near the electrode tip in opercular and calcarine V1 was reduced by <2°C.
Figure 9.

Feedback inactivation effects were not due to direct cooling of V1. A, Computed tomography (CT) scan of Monkey M showing approximate locations of cryoloops in the lunate sulcus (blue line), the site of V2 control recordings as in B (yellow dot), the site of V1 control recordings in the calcarine sulcus as in C and D (green dot), and the site of V1 recordings where inactivation effects were observed (magenta dot). Inset, Temperature probe (TP) attached to an extracellular metal electrode (E), which we used to measure cortical temperature from V1 on the operculum and in the calcarine sulcus. Scale bar, 200 μm. B, Area summation curves measured from a single site in V2, directly adjacent to the cryoloops, before (36.5°C; red) and during (blue) cooling at six different temperatures (35.5, 34.4, 32.3, 30.1, 25.4, and 18.0°C). Colder temperatures are indicated by darker blue shading. Mean ± SEM responses are presented. C, Area summation curves measured in V1 in the calcarine sulcus before (red) and during (blue) cooling. Mean ± SEM responses are presented. D, Maximum mean normalized difference value according to the retinotopic location of each unit's receptive field. The color of the circles indicates the magnitude of the inactivation effect at that site (expressed according to color scale to the right). The sizes of the circles are not drawn exactly to scale. Dashed lines indicate the approximate borders of the visual field region cooled in V2/V3 based on the locations of cryoloop placement in the lunate sulcus and the known retinotopy of areas V2 and V3. Arrowheads indicate units with receptive fields located beyond the expected feedback scotoma. Elevations and azimuths in the monkey's lower left visual quadrant are indicated in degrees.
According to the temperatures measured in opercular and calcarine V1, it is extremely unlikely that axons of the geniculostriate pathway were directly affected by cooling. Previous studies have shown that synaptic transmission is blocked when cortex is cooled to temperatures below 20°C (Bénita and Condé, 1972; Adey, 1974). Stimulus-evoked activity throughout the full thickness of cortex beneath a cryoloop is eliminated by maintaining the cooling loop at 3°C. This temperature reliably places the 20°C thermocline at the base of layer 6 (Lomber and Payne, 2000; Lomber et al., 2007). At these temperatures, activity in fibers of passage is not compromised (Jasper et al., 1970; Bénita and Condé, 1972). To affect axonal transmission, and particularly transmission in myelinated fibers such as the axons of the geniculostriate pathway, nervous tissue must be cooled below 5°C (Bénita and Condé, 1972). With a 3°C cooling loop, no portion of the cortex or underlying white mater has been found to be <11°C (Lomber and Payne, 2000; Lomber et al., 2007). This is entirely consistent with our own temperature measurements made in the animals used in this study: In two penetrations made 2 months apart, during which a temperature probe was passed along an anterior–posterior trajectory through the lunate sulcus, minimum recorded temperatures were 11.4°C and 13.9°C. Moreover, the lowest temperatures were recorded immediately adjacent to the loop, not in the white matter where axons of the geniculostriate pathway are located.
Analysis.
All analyses were performed using custom software written in MATLAB (MathWorks). All orientation/direction tuning analysis was performed on the subset of cells that were significantly tuned to orientation or direction (single-factor ANOVA, p < 0.05). Direction selectivity was assessed by calculating a directional index defined as 1 − Rmin/Rmax, where Rmax is the maximum mean response, and Rmin is the response in the null direction. Neurons were classified as direction selective if their directional index was greater than or equal to 0.5. The direction tuning curves for the orientation- and direction-selective populations (see Fig. 2B) were calculated by normalizing the mean responses of each unit to the range observed in the control responses (mean response − minimum divided by maximum − minimum), aligning all responses to the preferred direction, and taking the average across all units. To determine preferred orientation, we calculated the vector average of the mean responses. To measure tuning bandwidth, we fit each unit's data with a Gaussian function and only significant fits (28 of 36 units; χ2 test; p < 0.05) were included in further analysis. Bandwidth was measured as the half-width at half-height of the Gaussian fits. To determine a unit's orientation tuning strength, we calculated the circular variance (CV) of the mean responses (Ringach et al., 2002). To eliminate any influence that changes in spontaneous activity could have on measurements of CV, the mean spontaneous activity rate for each unit was subtracted from stimulus response rates before calculating the mean responses. To test for significant shifts in the vector average and CV during cooling, we estimated the variability in these metrics using a parametric bootstrap (Efron and Tibshirani, 1993). We chose to use a parametric bootstrap instead of resampling directly from the observed responses because our low condition-repetition counts limited the number of possible recombinations of the data such that the underlying distribution might no longer be well estimated (Schenker, 1985). Nevertheless, similar results were also obtained with paired-bootstrap resampling directly from the observed responses. For each unit, we calculated the mean and SD for each condition and randomly selected new response values from the normal distribution with matching mean and SD. We used normal assumptions, instead of Poisson, because the variance in our data was generally larger than the mean. This process generated a resampled, or “bootstrap,” data set with the same number of observations as in the original. We generated 1000 resampled control and cool data sets for each unit and, for each set, calculated the difference (cool minus control) in vector average and CV. The resultant distribution of difference values for each metric was used to calculate the 95% confidence interval for the observed difference value. An experimentally measured shift was deemed significant if it was outside of the 95% confidence interval of the corresponding bootstrap distribution. Significance testing for shifts in CV was performed similarly, but with spontaneous activity subtracted from the mean responses.
All area summation tuning analysis was performed on the subset of cells that were significantly tuned to the diameter of the stimulus (single-factor ANOVA, p < 0.05). From each area summation curve, we determined the size of the unit's SFhc as the grating diameter that produced the maximum mean response under control conditions. The size of the receptive field center was defined as the size of the SFhc for the purposes of this study. The region beyond the SFhc was considered to be the receptive field surround. This is a purely operational definition of center size and is not intended to imply any mechanistic meaning to the center and surround regions of the receptive field. Instead, it allows us to remain agnostic regarding underlying mechanisms and provides a relatively conservative (i.e., small) estimate of center size. Mean normalized difference-tuning responses (see Fig. 3B) were calculated by subtracting the mean control responses from the mean cool responses and dividing by the maximum mean response across both control and cool conditions. Responses were aligned to the size of the SFhc for each unit and diameter values were converted to RF units by dividing each diameter by the size of the SFhc. Therefore, a diameter in RF units of 1 refers to the size of the SFhc and a diameter in RF units of 2 refers to a grating twice the size of the SFhc.
Figure 3.
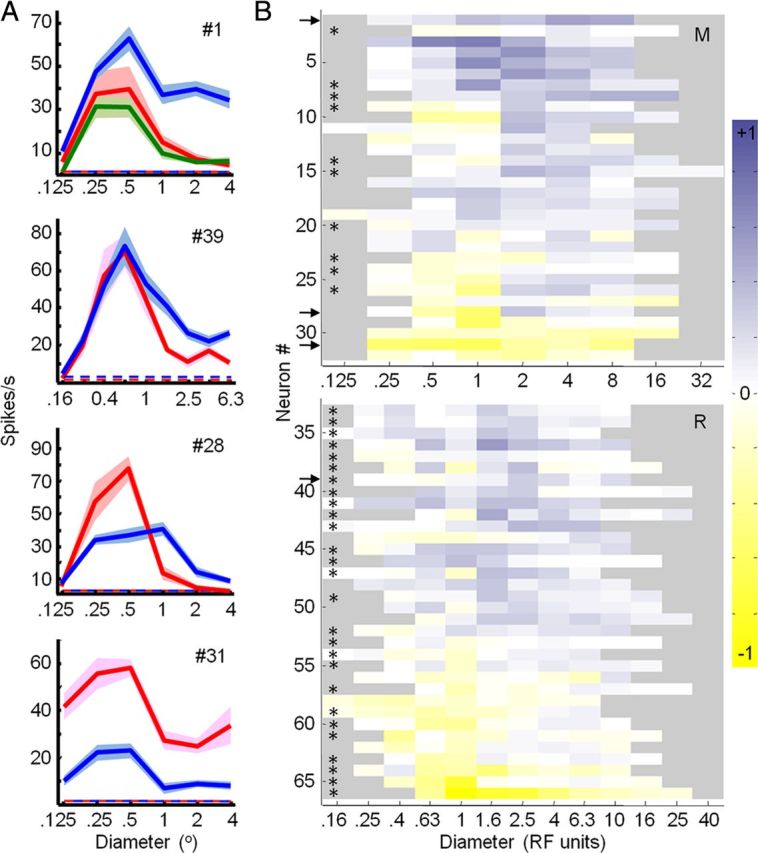
Effects of feedback inactivation on area summation curves in V1. A, Area summation curves measured in V1 before (red), during (blue) and after (green) cooling. Mean ± SEM responses are presented. Dashed lines indicate spontaneous activity. The number in top right corner of each plot indicates the number of the unit in B. B, Mean normalized difference responses (cool minus control divided by maximum response) expressed according to the color scale to the right. Diameters are presented in receptive field units (see Materials and Methods). Monkeys M (top) and R (bottom) presented separately. Asterisks indicate single units; otherwise multiunit responses are shown.
Surround-suppression percentage was calculated by subtracting the mean response to the largest grating diameter presented from the maximum mean response and dividing by the maximum mean response. Similarly, length-suppression percentage was calculated by subtracting the mean response to the longest bar stimulus presented from the maximum mean response and dividing by the maximum mean response. Values for both metrics could vary from 0 to 100%, with higher values indicating stronger surround suppression. To test for significant shifts in percentage surround suppression during cooling, we used the same parametric bootstrap analysis described previously for the orientation/direction tuning analysis. The area summation curve for the population (see Fig. 5B) was calculated by normalizing the mean responses of each unit to the control response (mean response − minimum divided by maximum − minimum), aligning all responses to the size of the SFhc, and taking the average across all units. All diameter values were converted to RF units (as described above) and binned to combine data from both monkeys.
Figure 5.

Effects of feedback inactivation on V1 surround suppression. A, Percentage surround suppression before and during cooling. Error bars indicate SEM from parametric bootstrap. Percentage surround suppression is calculated as (Rmax − Rlargest grating/Rmax) × 100. Filled symbols indicate statistically significant changes in percentage surround suppression (parametric bootstrap, p < 0.05). Triangles, Single units; circles, multiunit recordings. B, Normalized area summation curve for the population before (red) and during (blue) cooling. Mean ± SEM responses for different diameters (binned RF units) are shown. A frequency histogram of significant effects during cooling (paired t tests, p < 0.05) at each binned diameter condition is shown. Purple, Response increases; yellow, response decreases. Numbers in parentheses indicate number of units tested at that diameter condition. C, Population histograms of the effect magnitude index (Rcool − Rcontrol)/(Rcool + Rcontrol) for all stimulus conditions confined to the receptive field center (orange) and all stimulus conditions that engaged the surround (purple). Arrows indicate the median effect magnitude index for within-center conditions (median, 0.10; orange) and surround conditions (median, 0.23; purple).
For the surround-suppression time course analysis, only units for which cooling significantly increased response magnitude for at least one stimulus diameter larger than the SFhc were included (44 of 66 units). Paired t tests were performed at each diameter, and a criterion of p < 0.05 was used to assign significance. For the orientation-tuned time course analysis, only units for which cooling increased response magnitude for stimuli oriented orthogonal to the preferred orientation were included (21 of 36 units). The time courses of the population responses (see Fig. 7B,C) were constructed by first binning each unit's response with a 10 ms bin width and normalizing the binned responses to the control response (mean response − minimum divided by maximum − minimum). The center response was calculated by taking the binned and normalized control response to the SFhc diameter for each unit and taking the mean across all units. The control and cool surround responses were calculated by taking the mean across three different surround conditions for each unit (diameters in RF units, Monkey M, 2, 4, and 8; Monkey R, 1.6, 4, and 6.3) and across all units. Similar procedures were performed for calculating the population response time courses for preferred and orthogonal orientation stimuli. The latencies of divergence for surround suppression and effect of feedback were determined by performing two-phase linear regression (minimizing the total sum of squared deviations) on cumulative spike count histograms with 1 ms bin width (Sugihara et al., 2011). In the case of surround suppression, cumulative difference histograms were calculated by subtracting the response to the surround conditions from the response to the center condition. In the case of feedback effect, cumulative difference histograms were calculated by subtracting the cool response to the surround conditions from the control response to the surround conditions. The average difference histograms were calculated for all units that showed significant response enhancement during cooling (44 of 66 units). The two-phase regression was performed on the time window from 30 to 130 ms after stimulus onset, with the first leg forced to zero.
Figure 7.
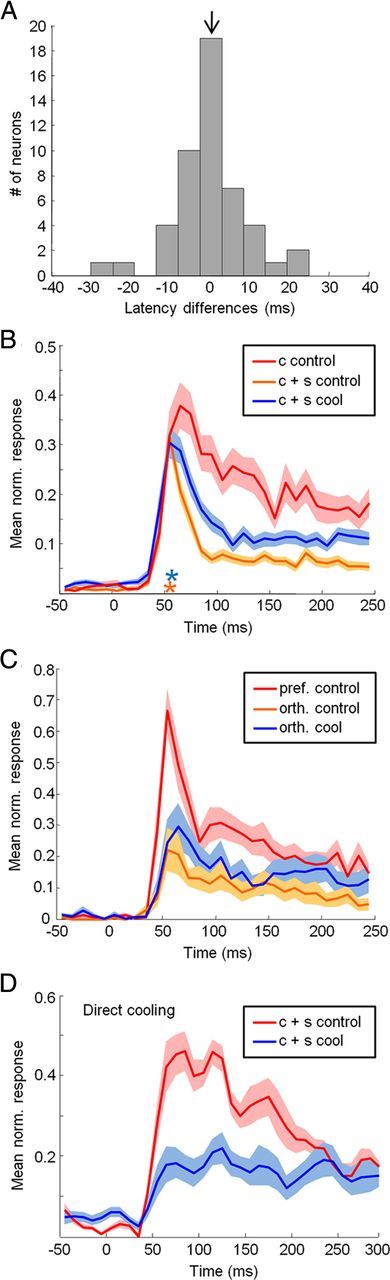
Temporal dynamics of feedback inactivation effects. A, Population histogram of visual response latency differences (cool minus control). Arrow indicates population mean latency difference (equal to 0). B, Population response time courses relative to stimulus onset. Mean ± SEM responses are presented for the center-only stimulus during control conditions (c control; red), center-plus-surround stimulus during control conditions (c + s control; orange), and center-plus-surround stimulus during cool conditions (c + s cool; blue). Only units for which cooling significantly increased response magnitude for at least one stimulus diameter larger than the SFhc were included (44 of 66 units). Orange and blue asterisks indicate the onset latency of surround suppression and feedback-inactivation facilitation respectively. C, Population response time courses relative to stimulus onset. Mean ± SEM responses are presented for the preferred-orientation center-only stimulus during control conditions (pref control; red), orthogonal-orientation center-only stimulus during control conditions (orth control; orange), and orthogonal-orientation center-only stimulus during cool conditions (orth cool; blue). Only units for which cooling increased response magnitude for the orthogonal-orientation condition were included (21 of 36 units). D, Population response time courses relative to stimulus onset for recordings obtained from the lunate sulcus (V2/V3) adjacent to the cryoloops (direct cooling). Mean ± SEM responses are presented for the center-plus-surround stimulus during control (c control; red) and cool (c cool; blue) conditions.
The effect magnitude index (EMI) (see Figs. 5C, 6B, 8C) was calculated by subtracting the control response from the cool response and dividing by their sum. Responses to grating diameters (RF units) of 6.3 (Monkey R) and 8 (Monkey M) were used for this analysis. To account for control firing rates, we calculated the partial correlation between surround-suppression strength and effect magnitude index. The partial correlation was calculated as follows: RSS,EMI|R = (rSS,EMI − rSS,RrEMI,R)/, where RSS,EMI|R is the partial correlation of the EMI and SS% accounting for control firing rate, rSS,EMI is the raw correlation between SS% and EMI, rSS,R is the raw correlation between surround-suppression strength and control firing rate, and rEMI,R is the raw correlation between effect magnitude index and control firing rates.
Figure 6.
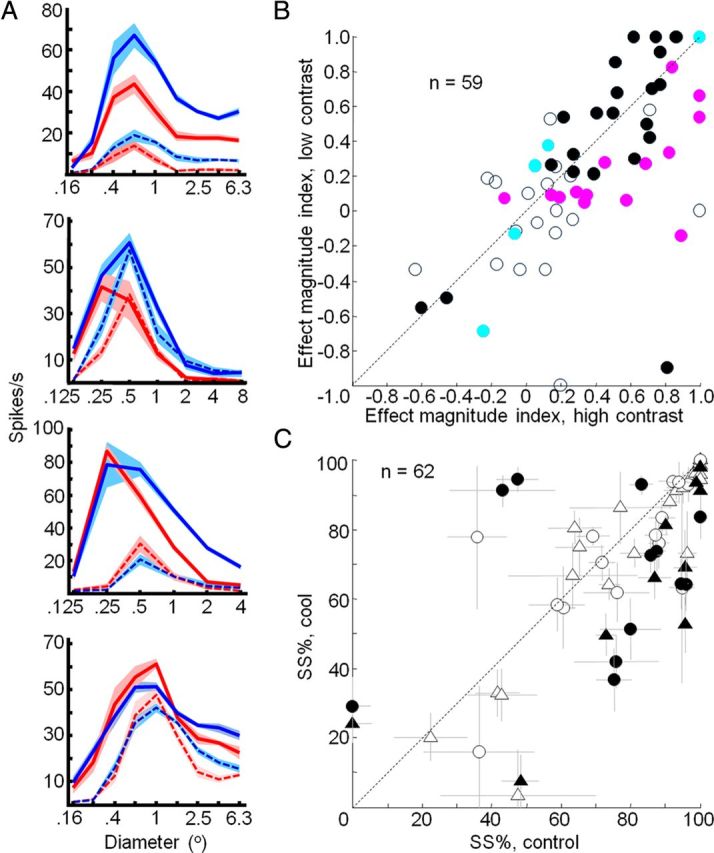
Effects of feedback inactivation on V1 area summation curves at low contrast. A, Area summation curves measured in V1 before (red) and during (blue) cooling for high (solid lines) and low (dashed lines) contrast gratings. Mean ± SEM responses are presented. B, Effect magnitude index (Rcool − Rcontrol/Rcool + Rcontrol) for low- and high-contrast gratings. Filled symbols indicate statistically significant changes in response magnitude during inactivation of feedback (t test, p < 0.05). Cyan, Significant effect at low contrast only; pink, significant effect at high contrast only; black, significant effect at both low and high contrast. C, Percentage surround suppression before and during cooling for low-contrast gratings. Error bars indicate SEM from parametric bootstrap. Percentage surround suppression is calculated as (Rmax − Rlargest grating/Rmax) × 100. Filled symbols indicate statistically significant changes in percentage surround suppression (parametric bootstrap, p < 0.05). Triangles, Single units; circles, multiunit recordings.
Results
We set out to determine whether and how corticocortical feedback contributes to receptive field properties in the alert primate. To do this, we reversibly inactivated parts of V2 and V3 using “cryoloops” chronically implanted in the right lunate sulcus in each of two macaque monkeys (Lomber et al., 1999; Ponce et al., 2008) (M and R) (Fig. 1A,B). Pumping chilled methanol through these loops cooled cortex down to temperatures below 20°C within a range of ∼1.6 mm (Lomber et al., 1999) and allowed us to temporarily eliminate visually evoked activity throughout the full thickness of an ∼9 × 18 mm swath of cortex. Based on the exact placement of the loops in the lunate sulcus and the known retinotopy of V2 and V3 (Gattass et al., 1981, 1988), we estimated that cooling would produce a feedback “scotoma” extending approximately from 2 to 10° in the lower half of the monkey's left visual field (Fig. 1B) (Ponce et al., 2008, their Fig. 2). This was confirmed by recording visually evoked activity (by sweeping a bar through the receptive field) from multiunits and single units in upper and lower layers of the lunate sulcus at various distances away from the loops (Fig. 1C,D). In all instances, visually evoked activity ceased within 2–3 min of initiating cooling, leaving only reduced spontaneous activity; visually evoked activity returned within minutes of discontinuing cooling.
Figure 1.

Reversible inactivation of V2 and V3 by cooling. A, Principal feedback projections to primate V1. Blue indicates areas inactivated during cooling. B, Three cryoloops were implanted in the lunate sulcus of the right hemisphere in each of two monkeys. Chilled methanol was pumped through the cryoloops to cool cortex down to temperatures of 1–5°C. Recordings were made from V1 at eccentricities between 2 and 10° (within the expected feedback scotoma) (Ponce et al., 2008) in the monkey's lower left visual field. C, Raster plot showing multiunit spontaneous and evoked responses from neurons located in the lunate sulcus adjacent to the cryoloops. The receptive field for this site was ∼1.5° in diameter and positioned within the lower left visual quadrant 0.6° to the left of fixation and 2.5° below. Each row shows a single trial of the response to an oriented bar moving into the receptive field. Red, Before cooling; blue, during cooling; green, after cessation of cooling. D, Mean multiunit response from the same site as in C. Each point is the running average of three trials. Arrows in C and D indicate the time points when cooling pumps were turned on and off. C and D were reproduced with minor modifications from Ponce et al. (2008).
Tuning for orientation and direction
We measured the response properties of V1 neurons (Monkey M, 32 recording sites; Monkey R, 34 recording sites) with and without feedback from V2 and V3 using sinusoidal gratings of optimal spatial and temporal frequency centered within each neuron's receptive field (see Materials and Methods). We first wanted to determine whether basic response properties of the receptive field center, such as orientation tuning, could be affected by inactivation of feedback. To this end, we obtained tuning curves for high-contrast gratings restricted roughly to the center of the receptive field (see Materials and Methods) that drifted in eight different directions. Only units that were significantly tuned for orientation or direction before cooling were analyzed further (36 of 47, single-factor ANOVA, p < 0.05) (Fig. 2A). Of these 36 units, 20 were direction selective, according to a directional index greater than or equal to 0.5 (see Materials and Methods). Inactivation of feedback resulted in response magnitude changes in two-thirds of the population (24 of 36 units, 10 of 21 single units, 14 of 15 multiunits; two-factor ANOVA, p < 0.05), with both response increases and decreases that sometimes depended on the orientation or direction of the presented stimulus (10 of 24 units, 4 single units, 6 multiunits; two-factor ANOVA, interaction effect, p < 0.05). This was particularly the case for orientation-selective neurons, and a close inspection of the direction-tuning curve for this subset of the population indicates that responses to orthogonal orientations tended to increase more than responses to preferred orientations (Fig. 2B, left). No such effect can be found in the population tuning curve for direction-selective neurons (Fig. 2B, right). These changes in response magnitude had little effect on preferred orientation, with the vast majority of the population maintaining the same preference (31 of 36 units, parametric bootstrap, p > 0.05; median orientation shift, 7.1°) (Fig. 2A,C). Orientation selectivity as measured by tuning bandwidth (see Materials and Methods) was also unaffected (median bandwidth difference, 2.6°; paired t test, p = 0.37) (Fig. 2D). Together, these results suggest that responses at or near the preferred orientation remained intact and relatively unchanged during inactivation of feedback.
Response magnitude changes during cooling did reduce orientation selectivity in V1 as measured by CV. Cooling led to a significant increase in CV for 9 of 36 units (three single units, six multiunits; parametric bootstrap, p < 0.05) as well as a significant increase in the population median for the entire population combined (median CV difference, 0.0442; Wilcoxon signed rank test, p = 0.0125) (Fig. 2A, bottom, E). A similar trend was evident in each monkey's data analyzed individually (Monkey M, median, 0.0548; p = 0.1934; Monkey R, median, 0.0354; p = 0.0361), but only reached significance for Monkey R. A small sample size (n = 10) for Monkey M was the most likely reason for the lack of significance. This increase in CV was not due to changes in spontaneous firing rates during inactivation, as spontaneous activity was subtracted from stimulus responses before the CV calculation (see Materials and Methods). Furthermore, we found no systematic effect of feedback inactivation on spontaneous activity rates (mean spontaneous rate difference, 0.8085; paired t test, p = 0.08). Neurons became less selective for orientation without feedback, primarily due to increased responses to nonpreferred orientations (Fig. 2B). Despite these effects, selectivity was rarely completely abolished and the majority of units remained significantly tuned for orientation (32 of 36; single-factor ANOVA, p < 0.05). For the neurons that were direction selective (n = 20), we calculated a “directional CV” as 1 − r, where r is the length of the mean vector. For this metric, we found no significant shift in the population (median difference, 0.0048; Wilcoxon signed rank test, p = 0.4781), and only 2 units of 20 shifted significantly during cooling (parametric bootstrap, p < 0.05). This result is consistent with our previous observation that response increases during feedback inactivation were greatest at orthogonal orientations and not at the opposite direction. Together, our results indicate that feedback from V2 and V3 plays little or no role in generating preferred orientation in V1, but does have a measurable effect on the sharpening of that preference.
Surround suppression and end stopping
Given relatively intact tuning properties of the center, we next assessed whether inactivation of feedback from V2 and V3 affects center-surround interactions in V1 by obtaining area summation curves for high-contrast gratings that drifted in the preferred direction and varied in diameter. As expected from previous work (Sceniak et al., 1999), under control conditions all neurons increased their response as the diameter of the grating increased from the smallest presented size (Fig. 3A, red curves). The diameter that produced the peak response was defined as the size of the receptive field center for the purposes of this study. Beyond this peak response, almost all neurons showed response suppression. Inactivating feedback significantly altered these area summation curves for 44 of 66 units (22 of 37 single units, 22 of 29 multiunits; two-factor ANOVA, p < 0.05) (Fig. 3A, blue curves). The effects observed were variable as seen in four example units (Fig. 3A) and in the difference-tuning responses for the entire population (Fig. 3B) (see Materials and Methods). The most common effect of inactivation was an increase in response magnitude, particularly for grating diameters that extended beyond the borders of the receptive field center (n = 35) (Fig. 3A,B). This was also the case for single bar stimuli of varying length (Fig. 4A). For a subset of neurons, the sign of the effect depended on the size of the stimulus, almost always characterized by response decreases for small stimuli and response increases for large stimuli (12 of 66 units, 6 single units and 6 multiunits; two-factor ANOVA, interaction effect, p < 0.05) (Fig. 3A, unit #28). Only rarely did we observe reduced responses for both small and large-diameter stimuli (Fig. 3A, unit #31).
Figure 4.
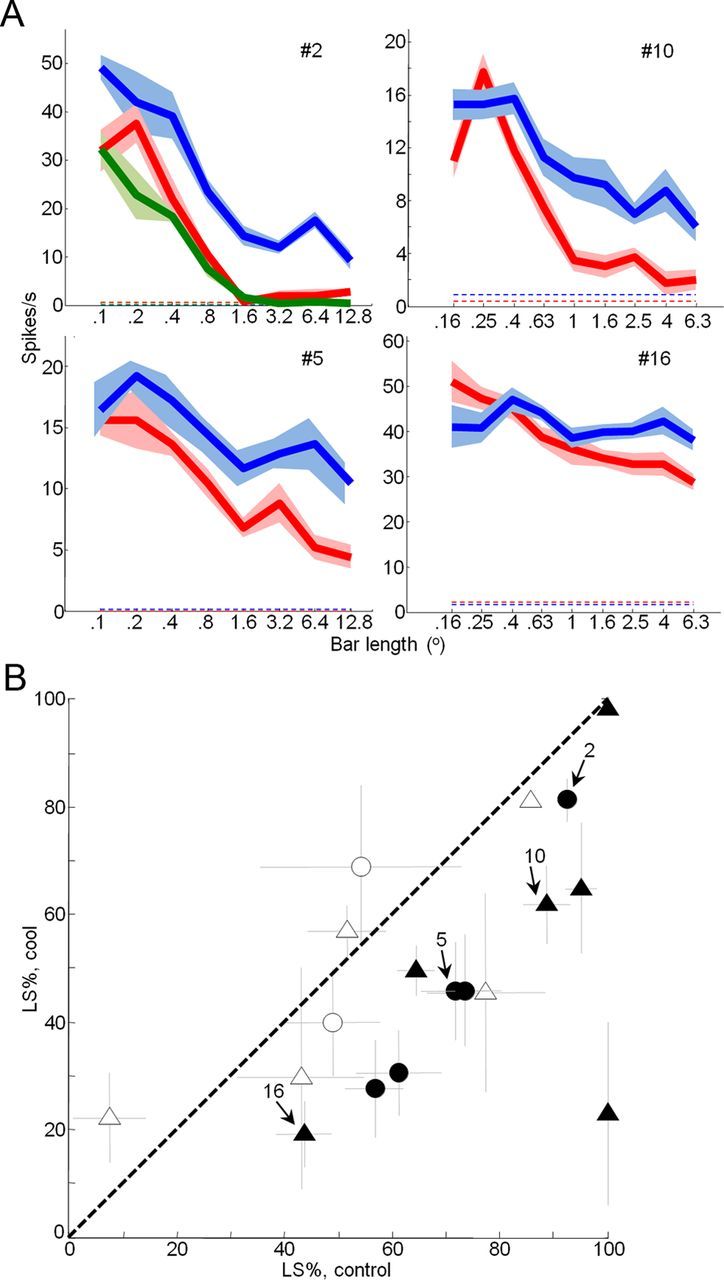
Effects of feedback inactivation on V1 length suppression. A, Length-tuning curves measured in V1 before (red), during (blue) and after (green) cooling. Two example units from Monkey M (left) and Monkey R (right) are shown. Mean ± SEM responses are presented. Dashed lines indicate spontaneous activity. B, Percentage length suppression (LS%) before and during cooling for 18 units. Error bars indicate SEM from parametric bootstrap. Percentage length suppression is calculated as (Rmax − Rlongest bar/Rmax) × 100. Filled symbols indicate statistically significant changes in percent length suppression (parametric bootstrap, p < 0.05). Triangles, Single units; circles, multiunit recordings.
The size-dependent effects observed during inactivation of feedback led to a significant reduction in surround-suppression strength (Rmax − Rlargest grating/Rmax × 100) across the entire population (median difference, −6.5%; Wilcoxon signed rank test, p < 0.0001) (Fig. 5A). This reduction was also significant for each animal individually (Monkey M, median, −8.2%; p = 0.01; Monkey R, median, −5.6%; p < 0.0001) and for both single units (median, −5.9%; p < 0.0001) and multiunits (median, −8.0%; p = 0.0201) separately. Surround-suppression strength significantly decreased during cooling for 22 of 66 units (9 single units, 13 multiunits; parametric bootstrap, p < 0.05) and only rarely significantly increased in strength (3 of 66 units; parametric bootstrap, p < 0.05). For 19 of 66 units we were able to repeat area summation tuning experiments after cooling, after allowing V2/V3 cortex to return to baseline temperature. Surround-suppression strength was significantly reduced during cooling for 6 of these 19 units (parametric bootstrap, p < 0.05; two single units, four multiunits) and for the subpopulation combined (median difference, −8.7%; Wilcoxon signed rank test, p < 0.01). Upon cessation of cooling, surround-suppression strength was no longer significantly reduced for any of the 19 units (parametric bootstrap, p > 0.05) or for the population (median difference, −0.4%; Wilcoxon signed rank test, p = 0.4074). These results indicate that effects of feedback inactivation on surround-suppression strength were reversible. We also presented single bar stimuli of varying length, in which case we observed a reduction in length suppression for the entire population combined (median difference, −19.7%; Wilcoxon signed rank test, p = 0.0036) and for 11 of 18 individual units (six single units, five multiunits; parametric bootstrap, p < 0.05) (Fig. 4B). The area summation curve for the population confirmed that the observed reduction in surround suppression strength was primarily due to consistent increases in response magnitude when the diameter of the grating extended beyond the borders of the receptive field center and into the surround (Fig. 5B). When the stimulus was confined to the center, cooling effects were much less frequent and were typically smaller in magnitude and variable in sign (Figs. 3B, 5B). To further investigate these observations, we calculated an effect magnitude index (Rcool − Rcontrol/Rcool + Rcontrol) that could vary from −1 for strong reductions in response during cooling to +1 for strong increases in response during cooling (see Materials and Methods). The population median of this index (Rcool − Rcontrol)/(Rcool + Rcontrol) for all stimulus conditions confined to the receptive field center was not significantly different from zero (median, 0.10; Wilcoxon signed rank test, p = 0.43) (Fig. 5C). For stimuli that engaged the surround, however, the population median effect was significantly larger (median, 0.23; Wilcoxon signed rank test, p < 0.001). This is further evidence that inactivation of feedback had little effect on responses to stimuli confined to the receptive field center, but led to consistent and sometimes large facilitation of responses to stimuli that engaged the receptive field surround. These results suggest that under normal conditions feedback tends to suppress responses to large stimuli, thereby contributing to surround suppression in V1.
Effect of stimulus contrast
Previous studies in anesthetized monkeys found that inactivation of feedback resulted in the largest effects when presenting stimuli of low contrast (Hupé et al., 1998), suggesting that feedback may play a particularly important role in processing objects of low visual salience. We investigated this possibility by obtaining area summation curves for low-contrast gratings (see Materials and Methods). Under control conditions, lowering the contrast of the gratings resulted in reduced responses, but the shapes of the resultant area summation curves were similar to those obtained at high contrast (Fig. 6A, red dashed curves). Inactivating feedback significantly altered these area summation curves for 44 of 64 units (20 of 37 single units, 24 of 27 multiunits; two-factor ANOVA, p < 0.05) (Fig. 6A, blue dashed curves). The effects observed were variable as seen in four example units (Fig. 6A), but the most common effect of inactivation at low contrast continued to be an increase in response magnitude, particularly for grating diameters that extended beyond the borders of the receptive field center. This response facilitation was similar to that observed at high contrast, though there was a small but significant reduction in magnitude across the population (median difference, −0.05; Wilcoxon signed rank test, p = 0.0488) and a similar trend for each animal individually (Monkey M, median, −0.14; p = 0.0451; Monkey R, median, −0.05; p = 0.3389) (Fig. 6B). Likewise, a similar but smaller reduction in surround-suppression strength was observed for low-contrast gratings for the entire population combined (median difference, −3.4%, Wilcoxon signed rank test, p = 0.0018) and when restricted to single-units only (−3.1%, p = 0.0025) (Fig. 6C). This reduction was significant for Monkey R (median, −3.0%; p = 0.0098), but not for Monkey M (median, −5.3%; p = 0.0651), further indication that effects were weaker at low contrast. Thus, contrary to previous studies in anesthetized animals in which low-contrast stimuli revealed the strongest effects of feedback inactivation (Hupé et al., 1998), we found that effects were similar or even stronger at high contrast. These results suggest that feedback from V2 and V3 makes an important contribution to surround suppression in V1 for visual stimuli of both low and high contrast.
Temporal dynamics
The consistent reduction of surround suppression observed during inactivation of V2 and V3 led us to investigate in more detail the relationship between feedback inactivation effects and surround suppression. Previous studies have found that surround suppression is typically delayed relative to the initial visual response (Bair et al., 2003) (but see Briggs and Usrey, 2011b), whereas feedback inactivation effects have been reported previously to appear without such a delay (Hupé et al., 2001a), suggesting that feedback and surround suppression may operate through different mechanisms. Our results, however, indicate that feedback may in fact contribute directly to the suppressive surround, in which case one might expect the temporal dynamics of surround suppression and feedback inactivation effects to be similar. By comparing the time course of the population response to a center-only stimulus with that to a large stimulus (both flashed on and stationary for at least 250 ms), we observed that surround suppression was first evident ∼20 ms after the initial visual response (54 ms relative to stimulus onset; Fig. 7B, compare red, orange curves), in agreement with previous studies (Bair et al., 2003). Our V1 population thus resembled the “fast” cells reported by Briggs and Usrey (2011b); however, our inability to classify V1 neurons according to antidromic conduction velocities (from LGN) likely obscured any differences that may have existed in our population. Interestingly, the response to a large stimulus during feedback inactivation first diverged from the control response with approximately the same 20 ms delay (58 ms relative to stimulus onset; Fig. 7B, compare orange, blue curves). This is in contrast to previous studies in anesthetized animals in which no such delay was observed (Hupé et al., 2001a). Importantly, we found that inactivation of V2 and V3 had a negligible effect on the latency of the initial visual response (mean difference, 0; paired t test, p = 0.25) (Fig. 7A). Our results are consistent with the idea that the very earliest component of the visual response is mediated by feedforward mechanisms that are largely independent of signals conveyed by feedback circuitry. The matching time courses of both surround suppression and feedback inactivation effects suggests that feedback contributes directly to surround suppression in V1.
The temporal dynamics of feedback inactivation effects observed for large stimuli that engage the receptive field surround suggest that additional time is necessary for signals to ascend forward into V2/V3 and back into V1. An alternative interpretation, however, would be that feedback itself is actually fast (Hupé et al., 2001a), but that it relies on slow, long-range horizontal connections intrinsic to V1 to mediate suppression from the surround. To distinguish between these two possibilities, we investigated whether the facilitation observed during feedback inactivation for orthogonally oriented stimuli restricted to the receptive field center might also be delayed in its onset. If this were to be the case, it would strongly argue against the involvement of long-range horizontal connections in producing the observed delay, as these connections are unlikely to be active for small, center-only stimuli. By comparing the time course of the population response to a preferred orientation stimulus with that to an orthogonal orientation stimulus, we observed that orientation tuning was first evident with little or no delay relative to the initial visual response (Fig. 7C, compare red, orange curves). However, the response facilitation observed for orthogonal orientations during feedback inactivation was first evident with a delay similar to that observed for surround suppression (Fig. 7C, compare orange, blue curves). This is consistent with the idea that orientation tuning is initially established through feedforward pathways, but that tuning is sharpened over time through cortical circuit mechanisms that involve feedback. These results also suggest that the inactivation effects observed for large stimuli that engage the receptive field surround are mediated through feedback pathways that are relatively independent of long-range horizontal connections, and that the delay in effect onset is primarily due to the time it takes for signals to propagate forward to V2/V3 and then back to V1.
Correlation of effect size with magnitude of surround suppression
A second, stronger prediction of the notion that feedback contributes directly to the suppressive surround is that the strength of surround suppression should correlate with the magnitude of inactivation effects. We found that weakly surround-suppressed neurons were often only marginally affected by inactivation of feedback (Fig. 8A), whereas strongly surround-suppressed neurons were often greatly facilitated in their response to large-diameter gratings (Fig. 8B). This relationship between the strength of surround suppression and the magnitude of inactivation effects resulted in a significant correlation between the two measures across the population (Fig. 8C; r = 0.67, p < 0.001; single units, r = 0.54, p < 0.001; multiunits, r = 0.84, p < 0.001) and for each animal individually (Monkey M, r = 0.83, p < 0.001; Monkey R, r = 0.50, p = 0.004). One confound in measuring the correlation between surround-suppression strength and the magnitude of inactivation effects is that neurons with strong surround suppression will tend to have lower control firing rates to a large stimulus, and this will itself produce larger inactivation indices. Indeed, there was a positive correlation between control firing rate and effect magnitude index (r = 0.29, p < 0.001). We therefore controlled for baseline firing rates using partial correlation (see Materials and Methods) and found that the strength of surround suppression and the magnitude of inactivation effects were significantly correlated for the entire population combined (r = 0.47, p < 0.001) and Monkey M individually (r = 0.71, p < 0.001), while approaching significance for Monkey R (r = 0.31, p < 0.1). The largest facilitation effects during feedback inactivation occurred for the neurons that were the most strongly surround suppressed; weakly surround-suppressed neurons were not as strongly affected (Fig. 8C). This correlation in magnitude is the best evidence to date that feedback is an integral component of the cortical circuit mediating surround suppression in V1.
Controls: effects not due to direct cooling of V1
Our recording sites in V1 were located on the opercular surface in relatively close proximity (∼8–10 mm posterior) to the cryoloops implanted in the lunate sulcus (Fig. 9A). Direct measurements of cortical temperature at these sites (see Materials and Methods) confirmed that there was likely a small reduction in temperature (by no more than 2°C) in V1 during our recordings. To confirm that the observed effects of cooling were due to inactivation of feedback from V2 and V3 and not due to direct cooling of V1, we first recorded from neurons in the lunate sulcus (directly adjacent to the cryoloops) while only slightly reducing the temperature to bracket the likely temperature range experienced by neurons in V1 during our main experiments. We repeatedly obtained area summation curves at each, stabilized temperature (Fig. 9B). The result was that small degrees of cooling (down to 32°C) produced minimal changes in the area summation curves, while larger temperature drops (below 32°C) produced decreases in neural responses that were roughly proportional across different stimulus sizes. Importantly, in no case (n = 7) did we find that direct cooling led to an increase in neural responsiveness, nor was surround suppression ever affected. Furthermore, the temporal dynamics of the direct cooling effects observed in the lunate (response decreases) (Fig. 7D) were completely different from those observed in V1, lacking the characteristic delay in onset of feedback effects (Fig. 7B,C).
In a second set of control experiments, we recorded from V1 neurons in the calcarine sulcus at sites that were roughly the same distance from the cryoloops as our recordings on the operculum (Fig. 9A,C). We directly recorded the temperature from these sites in the calcarine sulcus and found similar decrements in temperature during cooling (∼2°C) as those measured on the operculum. Recordings from these sites serve as a strong control since any direct cooling effects on the operculum and in the calcarine should be very similar, but the receptive field locations are widely separated in the visual field, with eccentricities of 2–6° on the operculum and >18° in the calcarine. Since the latter receptive fields are well outside the location of the feedback scotoma (Ponce et al., 2008), we would not expect them to be affected by cooling if inactivating feedback is the cause, but we would expect to see similar effects if direct cooling is the cause. Consistent with the feedback explanation, in nine separate experiments within the upper bank of the calcarine sulcus, we found no effects of cooling (two-factor ANOVA, p > 0.05) (Fig. 9C,D).
Given the proximity of the cryoloops to the V1/V2 border (∼2 mm), a remaining concern was that the observed effects could have been produced by direct cooling of regions in V1 near this border where neurons might be contributing to the surrounds of recorded neurons via long-range horizontal connections. We used the precise retinotopy of V1 and the fact that the V1/V2 border corresponds to the representation of the vertical meridian of the visual field (Tootell et al. 1988) to perform two tests of this possibility. First, if direct cooling of horizontal inputs to the surround was contributory, one would expect effects of inactivation to be largest for neurons with receptive fields near the vertical meridian and smallest for neurons with receptive fields farther away. We did not find this to be the case (Fig. 10A) (linear regression, p > 0.10 for each monkey). Second, we performed separate control experiments in one monkey during which we presented gratings of different diameters, as before, except that one half of the grating extending beyond the receptive field center was masked out; we alternated between masking the half closest to the vertical meridian and the half farthest from the vertical meridian (Fig. 10B). We reasoned that if the reported facilitation during inactivation was due to direct cooling of V1 neurons near the vertical meridian, we would expect cooling effects to be large when the stimulus engaged the part of the surround nearer to the vertical meridian, and small or absent when the stimulus engaged the part of the surround farther from the vertical meridian. Contrary to this prediction, we found that cooling effects were similar for both versions of the masked surround (Fig. 10C,D). We performed this control experiment for seven units in Monkey M and found similar results for all units. There was no significant difference in effect magnitude index for the population when comparing surround stimulation nearer to versus farther from the vertical meridian (median difference, 0.053; Wilcoxon signed rank test, p = 0.58) (Fig. 10D). These two tests provide strong evidence against the possibility that regions of V1 near the vertical meridian were directly cooled and produced the reported effects during inactivation.
Figure 10.
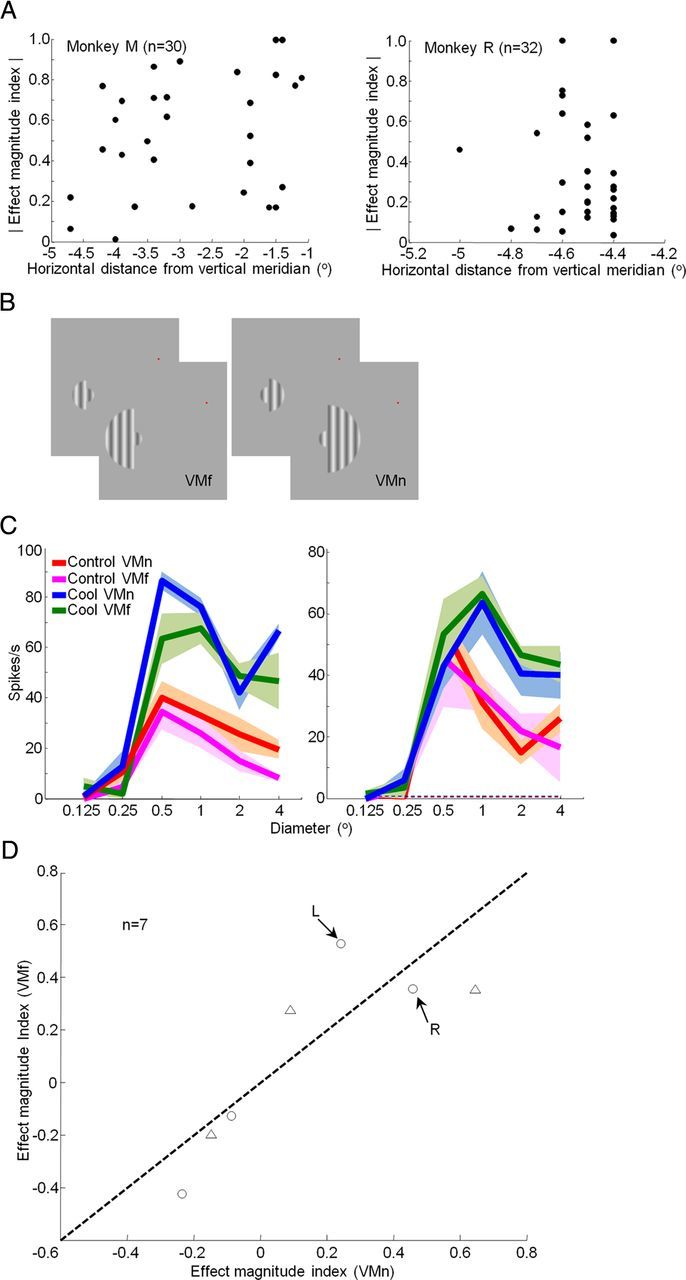
Feedback inactivation effects not due to direct cooling of V1 near its border with V2. A, Absolute value of effect magnitude index (Rcool − Rcontrol/Rcool + Rcontrol) as a function of recording site distance from the vertical meridian for Monkey M (left; n = 30) and Monkey R (right; n = 32). Effect magnitude indices were calculated from responses to grating diameters (RF units) of 6.3 (Monkey R) and 8 (Monkey M). The correlation between these two metrics was not significant for either monkey. B, In separate control experiments, sinusoidal gratings of different diameters were presented with half of the receptive field surround masked out. The resultant gratings stimulated the receptive field surround near to (VMn) or far from (VMf) the vertical meridian. C, Area summation curves measured in V1 before (VMn, red; VMf, magenta) and during (VMn, blue; VMf, green) cooling. Mean ± SEM responses are presented. Dashed lines indicate spontaneous activity. D, Effect magnitude index (Rcool − Rcontrol/Rcool + Rcontrol) for gratings that stimulated the receptive field surround near to and far from the vertical meridian. Effect magnitude indices were calculated from responses to grating diameters (RF units) of 4. Triangles, Single units; circles, multiunit recordings. Arrows indicate the examples in C. L, Left; R, right. Data were obtained from seven (n = 7) recording sites in V1 of Monkey M.
Together, these control experiments rule out the direct cooling of V1 as an explanation of our results. Direct temperature measurements revealed that any direct effects of cooling in V1 are likely to be small, and recordings from directly cooled neurons showed that their responses were altered in a completely different way (scaled reduction as in Fig. 9B; no temporal delay, Fig. 7D) from those on the V1 operculum (enhancement, loss of surround suppression as in Figs. 4, 5; temporal delay, Fig. 7B,C). Furthermore, the absence of cooling effects in the calcarine sulcus (Fig. 9C,D), where neurons have receptive fields outside of the feedback scotoma, argues that the main effects we have observed are indeed the result of eliminating feedback. Finally, the lack of a relationship between cooling effect size and proximity of V1 neurons to the V1/V2 border (Fig. 10A) and failure to find any spatial asymmetry in the surrounds (Fig. 10C,D) argues against a contribution of direct cooling of V1 neurons contributing to the surrounds via long-range horizontal connections.
Eye movements
Last, our findings cannot be explained by changes in fixational eye movements, as we did not find any relationship between changes in eye position variance and the magnitude of observed effects (Monkey M, r = 0.14, p = 0.45; Monkey R, r = 0.16, p = 0.48). Moreover, we observed the strongest effects of cooling in response to large gratings and not to small stimuli, the responses to which are the most sensitive to exact eye position.
Discussion
Our results differ from studies in anesthetized monkeys in a number of ways (Sandell and Schiller, 1982; Hupé et al., 1998, 2001b) (Table 1), the most striking of which is that we observed predominantly response increases (due to a release from suppression) when we inactivated V2 and V3, whereas previous studies found mainly decreases in visual responsiveness. Similar response decreases have been reported following inactivation of feedback in anesthetized cats (Wang et al., 2010) (but see Murphy and Sillito, 1987). Together, these previous studies suggested that the main role of feedback is to weakly excite the center of a V1 neuron's receptive field with little or no effect on the surround. We also observed rare response reductions, mainly for stimuli restricted to the receptive field center, but the most common result of feedback inactivation in our experiments was an increase in response magnitude for large stimuli (Figs. 3–5). These size-dependent effects resulted in a significant reduction in surround-suppression strength across the V1 population (Figs. 4B, 5A, 6C). Furthermore, we found a close relationship in timing and magnitude between inactivation effects and control surround suppression (Figs. 7, 8). Our findings, therefore, fail to support the idea that feedback's primary function is to excite the receptive field center, and rather argue that feedback contributes to suppression mediated by the surround.
Table 1.
Experimental design differences between the current study and previous studies
| Study | Species | Anesthetic | Inactivation method | Pathway | Stimulus | CRF-only stimulation |
CRF + surround stimulation |
||||
|---|---|---|---|---|---|---|---|---|---|---|---|
| % affected | % less activitya | % more activitya | % affected | % less activitya | % more activitya | ||||||
| This study | Macaque | None | Cooling | V2/V3 → V1 | Sinusoidal grating | 32% (21 of 66) | 48% (10 of 21) | 52% (11 of 21) | 67% (44 of 66) | 11% (5 of 44) | 89% (39 of 44) |
| Sandell and Schiller (1982) | Saimiri | N20 + halothane thiopental | Cooling | V2 → V1 | Single bar | 32%b (21 of 66) | 86%b (18 of 21) | 14%b (3 of 21) | Not tested | ||
| Hupé et al. (2001a) | Macaque | N20 + sufentanil | GABA | V2 → V1 | Array of bars | 10% (6 of 61) | 100% (6 of 6) | 0% (0 of 6) | No effect on surround modulation Specific breakdown not reported | ||
| Hupé et al. (1998) | Macaque | N20 + sufentanil | Cooling | MT → V1/V2/V3 | Array of bars | 40% (61 of 154) | 84% (51 of 61) | 16% (10 of 61) | Population response increasec Specific breakdown not reported | ||
| Wang et al. (2010) | Cat | N20 + halothane | Cooling | PTV → V1 | Sinusoidal grating | 39% (16 of 41) | 81% (13 of 16) | 19% (3 of 16) | 76%b (31 of 41) | 81%b (25 of 31) | 19%b (6 of 31) |
a“Less” and “more” indicate changes in V1 response during inactivation of feedback.
bValues were not tested for statistical significance.
cObserved for V3 and low-contrast stimuli only.
Previous studies in anesthetized monkeys also found that effects of feedback inactivation were strongest for low-contrast stimuli (Hupé et al., 1998), leading to the proposal that feedback is particularly important for processing objects of low salience. However, we found that effects of feedback inactivation were, if anything, larger and more consistent at high contrast (Fig. 6B). This is likely due to the fact that increasing contrast typically increases the strength of surround suppression, and is consistent with our finding that the magnitude of inactivation effects correlated with the strength of surround suppression (Fig. 8C). Given the high contrast sensitivity found in MT (Sclar et al., 1990), it remains possible that the contrast-dependent effects of feedback described previously (Hupé et al., 1998) are a unique property of feedback from MT and not from V2 or V3. Nevertheless, our results indicate that feedback can exert its influence across a wide range of contrasts and, therefore, may play a more extensive role in visual processing than previously thought.
A number of differences exist between previous studies and our study that could account for the different results, including species, inactivation method, visual area inactivated, and visual stimuli used (Sandell and Schiller, 1982; Hupé et al., 1998, 2001b; Wang et al., 2010) (Table 1). Nevertheless, there is very little evidence across the previous studies that these particular elements had a significant impact on the outcome. These studies were conducted in a range of species (cat, squirrel monkey, macaque monkey), with various methods of inactivation (cooling, GABA) that targeted a number of different visual areas (primate, V2 and MT; cat, PTV). The stimuli used in previous studies were all different in their details, but, importantly, in many cases they stimulated the receptive field surround (Sandell and Schiller, 1982; Hupé et al., 2001b; Wang et al., 2010), a condition our study has identified to be critical. We therefore think it is unlikely that the differences described above account for the different results we obtained.
One common feature of previous studies is that they were all conducted in anesthetized animals; ours is the first to inactivate corticocortical feedback in alert animals (Table 1). Anesthesia has been reported to strongly affect feedback signals from V1 to the LGN (Briggs and Usrey, 2011a), and similar issues are likely to pertain to corticocortical feedback. For one thing, cortical neurons are known to be in a lower conductance state under anesthesia, which can affect the balance of excitation and inhibition underlying center-surround interactions and has a major effect on how cortical neurons integrate their inputs (Destexhe et al., 2003; Ichida et al., 2007). Interestingly, modeling studies have indicated that distal synaptic inputs may have a relatively greater impact on “alert” cortical neurons in high conductance states (Destexhe et al., 2003). This could have a profound effect on the influence of corticocortical feedback, as feedback axons make synapses predominantly on the distal apical dendrites of pyramidal neurons (Rockland and Virga, 1989; Anderson and Martin, 2006). Consistent with this idea, certain forms of contextual modulation in V1, such as signals related to figure–ground segregation, are weak or absent in anesthetized monkeys (Lamme et al., 1998).
We also examined how inactivation of feedback affects the orientation tuning of the receptive field center. Previous work has provided strong evidence in favor of a feedforward model for the generation of preferred orientation in V1 (Hubel and Wiesel, 1962; Reid and Alonso, 1995). Consistent with this, we found that orientation-tuned neurons generally maintained their orientation preference during inactivation of feedback (Fig. 2C). One caveat in interpreting this negative result is that it is limited by our sampling resolution and the intrinsic noisiness of the neurons, which is manifest as rather large SEs for the preferred orientation of some neurons (Fig. 2C). Nevertheless, even for neurons with very small SEs, we often found no significant shift in preferred orientation. This provides further support to the idea that orientation preference in V1 is established by feedforward mechanisms and, therefore, does not rely on feedback signals from other cortical areas. We did, however, find that selectivity for orientation was often reduced during inactivation, primarily due to response facilitation for stimuli of non-preferred orientations (Figs. 2B,E), suggesting that feedback may normally contribute to the sharpening of a neuron's orientation tuning. The onset of this response facilitation was temporally delayed relative to the initial visual response (Fig. 7C), consistent with the known dynamics of orientation tuning and the temporal evolution of responses from broadly to sharply tuned (Ringach et al., 1997). It has long been thought that local circuits within V1 serve this function (Ben-Yishai et al., 1995; Somers et al., 1995; Troyer et al., 1998), though our results support previous findings in cats (Alonso et al., 1993; Wang et al., 2000), indicating that feedback is likely involved as well.
Together, our results support a direct contribution of feedback from V2 and V3 to the suppressive surrounds observed in V1. This function is most likely mediated through direct projections from V2 and V3 to V1 (Felleman and Van Essen, 1991), though we cannot reject the possibility that other cortical areas (Felleman and Van Essen, 1991), or even subcortical structures (Ogren and Hendrickson, 1977; Lund et al., 1981), are indirectly involved. It is important to note that while surround suppression was significantly weakened during inactivation of feedback, it was not completely eliminated (Figs. 4B, 5A,B). This is likely an indication that horizontal connections intrinsic to V1 also contribute to surround suppression (Angelucci and Bressloff, 2006; Adesnik et al., 2012), though previous studies have raised some doubts in this regard (Ozeki et al., 2004). Other cortical areas that provide feedback to V1, such as MT, likely also contribute to surround suppression, and, importantly, these areas remained largely intact during our inactivation experiments (Ponce et al., 2008). Previous anatomical studies have shown that feedback from MT can cover an aggregate visual field up to 27 times the size of the receptive field center in V1, which is well beyond that covered by V2 (5×) or V3 (10×) (Angelucci and Bressloff, 2006). This may explain why feedback inactivation effects were strongest for stimulus diameters approximately two to eight times the size of the receptive field center and relatively weak and uncommon for the largest stimulus diameters tested (Figs. 3B, 5B).
Our results are consistent with models that may be collectively referred to as “predictive coding” (Mumford, 1992; Rao and Ballard, 1999). The central idea is that neurons in higher visual areas are able to “recognize” more complex patterns by virtue of their feedforward circuitry (Riesenhuber and Poggio, 1999). Once they have done so, they send this information back to the lower area to selectively inhibit the distributed neural elements that constitute the lower area's representation of that pattern. After several iterations of the feedback and feedforward loops, the signal is essentially what is left after the prediction has been subtracted—an “error signal” or “residuals.” One notable prediction of such models is that the suppression commonly observed in V1 for extended bars, known as “end stopping,” arises as the result of feedback from higher visual areas (Mumford, 1992; Rao and Ballard, 1999). Our results with both extended gratings (Fig. 3) and single bars (Fig. 4) are consistent with this prediction. The temporal dynamics of the effects we observed (Fig. 7) are also consistent with the iterative nature of predictive coding models and with the known dynamics of end stopping in V1 (Pack et al., 2003). In the future, more selective manipulation of feedback circuitry, at the level of cortical columns or even single neurons, will be required to provide more stringent tests of such models.
Footnotes
This work was supported by National Eye Institute Grant EY018982, a grant from the Harvard Mahoney Neuroscience Institute, and National Research Service Award Training Grant NS007484 (to J.J.N.), grants from the Natural Sciences and Engineering Research Council of Canada and the Canadian Institutes of Health Research (to S.G.L.), National Institutes of Health RO1 Grant EY11379 (to R.T.B.), and Vision Core Grant EY12196. We thank C. Ponce, M. Livingstone, A. Smith, and A. Zaharia for technical assistance; G. Kreiman, J. Assad, and A. Smolyanskaya for comments on this manuscript; and M. Carandini and A. Ayaz for helpful discussions.
The authors declare no competing financial interests.
References
- Adesnik H, Bruns W, Taniguchi H, Huang ZJ, Scanziani M. A neural circuit for spatial summation in visual cortex. Nature. 2012;490:226–231. doi: 10.1038/nature11526. [DOI] [PMC free article] [PubMed] [Google Scholar]
- Adey WR. Biophysical and metabolic bases of cooling effects on cortical membrane potentials in the cat. Exp Neurol. 1974;42:113–140. doi: 10.1016/0014-4886(74)90011-9. [DOI] [PubMed] [Google Scholar]
- Alonso JM, Cudeiro J, Pérez R, Gonzalez F, Acuña C. Orientation influences of layer V of visual area 18 upon cells in layer V of area 17 in the cat cortex. Exp Brain Res. 1993;96:212–220. doi: 10.1007/BF00227101. [DOI] [PubMed] [Google Scholar]
- Anderson JC, Martin KA. Synaptic connection from cortical area V4 to V2 in macaque monkey. J Comp Neurol. 2006;495:709–721. doi: 10.1002/cne.20914. [DOI] [PubMed] [Google Scholar]
- Angelucci A, Bressloff PC. Contribution of feedforward, lateral and feedback connections to the classical receptive field center and extra-classical receptive field surround of primate V1 neurons. Prog Brain Res. 2006;154:93–120. doi: 10.1016/S0079-6123(06)54005-1. [DOI] [PubMed] [Google Scholar]
- Bair W, Cavanaugh JR, Movshon JA. Time course and time-distance relationships for surround suppression in macaque V1 neurons. J Neurosci. 2003;23:7690–7701. doi: 10.1523/JNEUROSCI.23-20-07690.2003. [DOI] [PMC free article] [PubMed] [Google Scholar]
- Bénita M, Condé H. Effects of local cooling upon conduction and synaptic transmission. Brain Res. 1972;36:133–151. doi: 10.1016/0006-8993(72)90771-8. [DOI] [PubMed] [Google Scholar]
- Ben-Yishai R, Bar-Or RL, Sompolinsky H. Theory of orientation tuning in visual cortex. Proc Natl Acad Sci U S A. 1995;92:3844–3848. doi: 10.1073/pnas.92.9.3844. [DOI] [PMC free article] [PubMed] [Google Scholar]
- Briggs F, Usrey WM. Corticogeniculate feedback and visual processing in the primate. J Physiol. 2011a;589:33–40. doi: 10.1113/jphysiol.2010.193599. [DOI] [PMC free article] [PubMed] [Google Scholar]
- Briggs F, Usrey WM. Distinct mechanisms for size tuning in primate visual cortex. J Neurosci. 2011b;31:12644–12649. doi: 10.1523/JNEUROSCI.2268-11.2011. [DOI] [PMC free article] [PubMed] [Google Scholar]
- Carandini M, Heeger DJ, Movshon JA. Linearity and normalization in simple cells of the macaque primary visual cortex. J Neurosci. 1997;17:8621–8644. doi: 10.1523/JNEUROSCI.17-21-08621.1997. [DOI] [PMC free article] [PubMed] [Google Scholar]
- Cavanaugh JR, Bair W, Movshon JA. Nature and interaction of signals from the receptive field center and surround in macaque V1 neurons. J Neurophysiol. 2002;88:2530–2546. doi: 10.1152/jn.00692.2001. [DOI] [PubMed] [Google Scholar]
- Destexhe A, Rudolph M, Paré D. The high-conductance state of neocortical neurons in vivo. Nat Rev Neurosci. 2003;4:739–751. doi: 10.1038/nrn1198. [DOI] [PubMed] [Google Scholar]
- Efron B, Tibshirani RJ. An introduction to the bootstrap. London: Chapman and Hall; 1993. [Google Scholar]
- Felleman DJ, Van Essen DC. Distribute hierarchical processing in the primate cerebral cortex. Cereb Cortex. 1991;1:1–47. doi: 10.1093/cercor/1.1.1. [DOI] [PubMed] [Google Scholar]
- Gattass R, Gross CG, Sandell JH. Visual topography of V2 in the macaque. J Comp Neurol. 1981;201:519–539. doi: 10.1002/cne.902010405. [DOI] [PubMed] [Google Scholar]
- Gattass R, Sousa AP, Gross CG. Visuotopic organization and extent of V3 and V4 of the macaque. J Neurosci. 1988;8:1831–1845. doi: 10.1523/JNEUROSCI.08-06-01831.1988. [DOI] [PMC free article] [PubMed] [Google Scholar]
- Gilbert CD, Sigman M. Brain states: top-down influences in sensory processing. Neuron. 2007;54:677–696. doi: 10.1016/j.neuron.2007.05.019. [DOI] [PubMed] [Google Scholar]
- Hubel DH, Wiesel TN. Receptive fields, binocular interaction and functional architecture in the cat's visual cortex. J Physiol. 1962;160:106–154. doi: 10.1113/jphysiol.1962.sp006837. [DOI] [PMC free article] [PubMed] [Google Scholar]
- Hupé JM, James AC, Payne BR, Lomber SG, Girard P, Bullier J. Cortical feedback improves discrimination between figure and background by V1, V2 and V3 neurons. Nature. 1998;394:784–787. doi: 10.1038/29537. [DOI] [PubMed] [Google Scholar]
- Hupé JM, James AC, Girard P, Lomber SG, Payne BR, Bullier J. Feedback connections act on the early part of the responses in monkey visual cortex. J Neurophysiol. 2001a;85:134–145. doi: 10.1152/jn.2001.85.1.134. [DOI] [PubMed] [Google Scholar]
- Hupé JM, James AC, Girard P, Bullier J. Response modulations by static texture surround in area V1 of the macaque monkey do not depend on feedback connections from V2. J Neurophysiol. 2001b;85:146–163. doi: 10.1152/jn.2001.85.1.146. [DOI] [PubMed] [Google Scholar]
- Ichida JM, Schwabe L, Bressloff PC, Angelucci A. Response facilitation from the ”suppressive“ receptive field surround of macaque V1 neurons. J Neurophysiol. 2007;98:2168–2181. doi: 10.1152/jn.00298.2007. [DOI] [PubMed] [Google Scholar]
- Jasper HH, Shacter DG, Montplaisir J. The effect of local cooling upon spontaneous and evoked electrical activity of cerebral cortex. Can J Physiol Pharmacol. 1970;48:640–652. doi: 10.1139/y70-094. [DOI] [PubMed] [Google Scholar]
- Lamme VA. The neurophysiology of figure-ground segregation in primary visual cortex. J Neurosci. 1995;15:1605–1615. doi: 10.1523/JNEUROSCI.15-02-01605.1995. [DOI] [PMC free article] [PubMed] [Google Scholar]
- Lamme VA, Zipser K, Spekreijse H. Figure-ground activity in primary visual cortex is suppressed by anesthesia. Proc Natl Acad Sci U S A. 1998;95:3263–3268. doi: 10.1073/pnas.95.6.3263. [DOI] [PMC free article] [PubMed] [Google Scholar]
- Lomber SG, Payne BR. Translaminar differentiation of visually guided behaviors revealed by restricted cerebral cooling deactivation. Cereb Cortex. 2000;10:1066–1077. doi: 10.1093/cercor/10.11.1066. [DOI] [PubMed] [Google Scholar]
- Lomber SG, Payne BR, Horel JA. The cryoloop: an adaptable reversible cooling deactivation method for behavioral or electrophysiological assessment of neural function. J Neurosci Methods. 1999;86:179–194. doi: 10.1016/S0165-0270(98)00165-4. [DOI] [PubMed] [Google Scholar]
- Lomber SG, Malhotra S, Hall AJ. Functional specialization in non-primary auditory cortex of the cat: areal and laminar contributions to sound localization. Hear Res. 2007;229:31–45. doi: 10.1016/j.heares.2007.01.013. [DOI] [PubMed] [Google Scholar]
- Lund JS, Hendrickson AE, Ogren MP, Tobin EA. Anatomical organization of primate visual cortex area VII. J Comp Neurol. 1981;202:19–45. doi: 10.1002/cne.902020104. [DOI] [PubMed] [Google Scholar]
- Mumford D. On the computational architecture of the neocortex. II. The role of cortico-cortical loops. Biol Cybern. 1992;66:241–251. doi: 10.1007/BF00198477. [DOI] [PubMed] [Google Scholar]
- Murphy PC, Sillito AM. Corticofugal feedback influences the generation of length tuning in the visual pathway. Nature. 1987;329:727–729. doi: 10.1038/329727a0. [DOI] [PubMed] [Google Scholar]
- Ogren MP, Hendrickson AE. The distribution of pulvinar terminals in visual areas 17 and 18 of the monkey. Brain Res. 1977;137:343–350. doi: 10.1016/0006-8993(77)90344-4. [DOI] [PubMed] [Google Scholar]
- Ozeki H, Sadakane O, Akasaki T, Naito T, Shimegi S, Sato H. Relationship between excitation and inhibition underlying size tuning and contextual response modulation in the cat primary visual cortex. J Neurosci. 2004;24:1428–1438. doi: 10.1523/JNEUROSCI.3852-03.2004. [DOI] [PMC free article] [PubMed] [Google Scholar]
- Pack CC, Livingstone MS, Duffy KR, Born RT. End-stopping and the aperture problem: two-dimensional motion signals in macaque V1. Neuron. 2003;39:671–680. doi: 10.1016/S0896-6273(03)00439-2. [DOI] [PubMed] [Google Scholar]
- Paradiso MA, Blau S, Huang X, MacEvoy SP, Rossi AF, Shalev G. Lightness, filling-in, and the fundamental role of context in visual perception. Prog Brain Res. 2006;155:109–123. doi: 10.1016/S0079-6123(06)55007-1. [DOI] [PubMed] [Google Scholar]
- Ponce CR, Lomber SG, Born RT. Integrating motion and depth via parallel pathways. Nat Neurosci. 2008;11:216–223. doi: 10.1038/nn2039. [DOI] [PMC free article] [PubMed] [Google Scholar]
- Rao RP, Ballard DH. Predictive coding in the visual cortex: a functional interpretation of some extra-classical receptive-field effects. Nat Neurosci. 1999;2:79–87. doi: 10.1038/4580. [DOI] [PubMed] [Google Scholar]
- Reid RC, Alonso JM. Specificity of monosynaptic connections from thalamus to visual cortex. Nature. 1995;378:281–284. doi: 10.1038/378281a0. [DOI] [PubMed] [Google Scholar]
- Riesenhuber M, Poggio T. Hierarchical models of object recognition in cortex. Nat Neurosci. 1999;2:1019–1025. doi: 10.1038/14819. [DOI] [PubMed] [Google Scholar]
- Ringach DL, Hawken MJ, Shapley R. Dynamics of orientation tuning in macaque primary visual cortex. Nature. 1997;387:281–284. doi: 10.1038/387281a0. [DOI] [PubMed] [Google Scholar]
- Ringach DL, Shapley RM, Hawken MJ. Orientation selectivity in macaque V1: diversity and laminar dependence. J Neurosci. 2002;22:5539–5551. doi: 10.1523/JNEUROSCI.22-13-05639.2002. [DOI] [PMC free article] [PubMed] [Google Scholar]
- Rockland KS, Virga A. Terminal arbors of individual “feedback” axons projecting from area V2 to V1 in the macaque monkey: a study using immunohistochemistry of anterogradely transported phaseolus vulgaris-leucoagglutinin. J Comp Neurol. 1989;285:54–72. doi: 10.1002/cne.902850106. [DOI] [PubMed] [Google Scholar]
- Sandell JH, Schiller PH. Effect of cooling area 18 on striate cortex cells in the squirrel monkey. J Neurophysiol. 1982;48:38–48. doi: 10.1152/jn.1982.48.1.38. [DOI] [PubMed] [Google Scholar]
- Sceniak MP, Ringach DL, Hawken MJ, Shapley R. Contrast's effect on spatial summation by macaque V1 neurons. Nat Neurosci. 1999;8:733–739. doi: 10.1038/11197. [DOI] [PubMed] [Google Scholar]
- Schenker N. Qualms about bootstrap confidence intervals. J Am Statist Assoc. 1985;80:360–361. doi: 10.1080/01621459.1985.10478123. [DOI] [Google Scholar]
- Sclar G, Maunsell JH, Lennie P. Coding of image contrast in central visual pathways of the macaque monkey. Vision Res. 1990;30:1–10. doi: 10.1016/0042-6989(90)90123-3. [DOI] [PubMed] [Google Scholar]
- Somers DC, Nelson SB, Sur M. An emergent model of orientation selectivity in cat visual cortical simple cells. J Neurosci. 1995;15:5448–5465. doi: 10.1523/JNEUROSCI.15-08-05448.1995. [DOI] [PMC free article] [PubMed] [Google Scholar]
- Stettler DD, Das A, Bennett J, Gilbert CD. Lateral connectivity and contextual interactions in macaque primary visual cortex. Neuron. 2002;36:739–750. doi: 10.1016/S0896-6273(02)01029-2. [DOI] [PubMed] [Google Scholar]
- Sugihara T, Qiu FT, von der Heydt R. The speed of context integration in the visual cortex. J Neurophysiol. 2011;106:374–385. doi: 10.1152/jn.00928.2010. [DOI] [PMC free article] [PubMed] [Google Scholar]
- Tootell RB, Switkes E, Silverman MS, Hamilton SL. Functional anatomy of macaque striate cortex. II. Retinotopic organization. J Neurosci. 1988;8:1531–1568. doi: 10.1523/JNEUROSCI.08-05-01531.1988. [DOI] [PMC free article] [PubMed] [Google Scholar]
- Troyer TW, Krukowski AE, Priebe NJ, Miller KD. Contrast-invariant orientation tuning in cat visual cortex: thalamocortical input tuning and correlation-based intracortical connectivity. J Neurosci. 1998;18:5908–5927. doi: 10.1523/JNEUROSCI.18-15-05908.1998. [DOI] [PMC free article] [PubMed] [Google Scholar]
- Vinje WE, Gallant JL. Sparse coding and decorrelation in primary visual cortex during natural vision. Science. 2000;287:1273–1276. doi: 10.1126/science.287.5456.1273. [DOI] [PubMed] [Google Scholar]
- Wang C, Waleszczyk WJ, Burke W, Dreher B. Modulatory influence of feedback projections from area 21a on neuronal activities in striate cortex of the cat. Cereb Cortex. 2000;10:1217–1232. doi: 10.1093/cercor/10.12.1217. [DOI] [PubMed] [Google Scholar]
- Wang C, Huang JY, Bardy C, FitzGibbon T, Dreher B. Influence of ‘feedback’ signals on spatial integration in receptive fields of cat area 17 neurons. Brain Res. 2010;1328:34–48. doi: 10.1016/j.brainres.2010.02.069. [DOI] [PubMed] [Google Scholar]
- Yang XF, Kennedy BR, Lomber SG, Schmidt RE, Rothman SM. Cooling produces minimal neuropathology in neocortex and hippocampus. Neurobiol Dis. 2006;23:637–643. doi: 10.1016/j.nbd.2006.05.006. [DOI] [PubMed] [Google Scholar]