

Abstract
Purpose
To assess the feasibility of using fat-fraction imaging for measuring marrow composition changes over large regions in patients undergoing cancer therapy.
Materials and Methods
Thirteen women with gynecologic malignancies who were to receive radiation and/or chemotherapy were recruited for this study. Subjects were imaged on a 3T MR scanner at baseline (after surgery but before radiation or chemotherapy), 6 months, and 12 months after treatment. Water-fat imaging was used to generate high-resolution, 3D signal fat fraction (sFF) maps extending from mid-femur to L3. Treatment changes were assessed by measuring marrow sFF in the L4 vertebra, femoral necks, and control tissues.
Results
Pre-treatment and 6-month scans were compared in nine women. sFF increased significantly in both the L4 vertebral marrow (p=0.04) and the femoral necks (p=0.03), while no significant change was observed in control regions. Qualitatively, chemotherapy changes were more uniform in space, whereas the radiation-induced changes were largest in marrow regions inside and close to the target radiation field.
Conclusion
Water-Fat MR imaging is sensitive to changes in red/yellow marrow composition, and can be used for quantitative and qualitative assessment of treatment-induced marrow damage.
Keywords: Bone marrow, water-fat imaging, Dixon MRI
INTRODUCTION
Damage to bone marrow is caused by the common cancer therapies of radiation and chemotherapy (1–3). Marrow is a heterogeneous admixture of hematopoietic red marrow and fatty yellow marrow. Both myelosuppressive chemotherapy and radiation treatment suppress the hematopoietic function of the red marrow and reduce the number of hematopoietic cells, and also increase differentiation of mesenchymal stem cells toward adiposis, leading to increased yellow marrow and thus higher fat fractions. This marrow composition change, which reportedly recovers over time (3), is associated with reduced hematopoietic capacity and may contribute to bone mineral loss and increased fracture risk in cancer patients (4).
Both MRI and MRS have been used for measuring the relative fat content of bone marrow. MRS has been extensively used, and is considered a non-invasive standard for measuring marrow fat fraction in studies of aging (5,6), osteoporosis (7,8), and body adiposity (9,10). While conventional T1-weighted spin-echo imaging can give a qualitative impression of relative fat content in the marrow, water-fat imaging techniques such as the Dixon method (11) or IDEAL (12) can be used to create parametric maps of the fat fraction, thus providing both quantitative and spatially-resolved information on marrow composition (13–16). Water-fat imaging of bone marrow has predominantly been performed with 2-dimensional acquisitions and limited spatial coverage, but using 3-dimensional gradient echo acquisitions, it is possible to acquire fat fraction data with high spatial resolution and coverage, as shown recently by Liang et al. for use in radiation therapy planning (17).
The goal of this study was to assess the feasibility of acquiring high-resolution, volumetric signal fat fraction maps across multiple marrow regions and determine if they were sensitive to radiation- and chemotherapy-induced marrow composition changes. Such a technique could provide a non-invasive biomarker for monitoring bone health during cancer treatment and help guide marrow-related therapeutic interventions such as bone anti-resorptive therapy. The results presented here are initial findings from an ongoing study aiming to develop biomarkers of bone health in gynecologic cancer patients.
MATERIALS AND METHODS
Approval for this study was obtained from our Institutional Review Board. Patients who had a gynecologic malignancy who were receiving either radiation or chemotherapy were recruited for scanning prior to treatment, and at 6 and 12 months after initiating therapy. A total of 13 women aged 35–63 years were enrolled in the study after giving informed consent and were scanned prior to beginning therapy. Five subjects had cervical or endometrial cancer and received radiation therapy (high-dose rate brachytherapy and/or external beam radiation). Eight subjects had ovarian or peritoneal cancer and received only platinum-based chemotherapy with Paclitaxel. Three subjects also received a granulocyte colony-stimulating factor (filgrastim or pegfilgrastim) to treat neutropenia.
Water-fat Imaging
All MRI scans were performed using a 3 Tesla MR scanner (TIM Trio, Siemens, Erlangen, Germany). The images were acquired with subject in the supine position using the standard spine array receive coil and two standard body array coils placed anteriorly, providing coil coverage from mid-thigh to mid-abdomen. After localizer scans and T2-weighted anatomical images, water-fat source images were acquired using a 3D gradient echo (Siemens’ fl3d_vibe), TR=9 ms, flip angle=10°, matrix 320×320, square field of view 300–370 mm (typ. 350mm), slice thickness 2.45 mm, 176 axial slices (interpolated on the scanner to 288 1.5 mm slices), readout bandwidth 600 Hz/pixel, partial Fourier 6/8 in both phase encode directions, and GRAPPA acceleration R=2 (anterior-posterior) and R=3 (head-foot) with 24 integrated reference lines in each dimension, giving a total acceleration of R=6 and acquisition time of 57 s. Three consecutive images were acquired with TE=2, 3, and 4 ms, giving a total water-fat acquisition time under 3 minutes with nominal resolution of 1.1 × 1.1 × 2.45 mm. No respiratory triggering or breath-holds were used. Three initial subjects were scanned with no GRAPPA and spatial coverage restricted to the lumbar spine.
These three complex, multi-coil datasets were then exported from the scanner for offline reconstruction using software written in Matlab (Mathworks, Natick MA). A complex image for each of the 3 echo times was calculated using 2D GRAPPA with multiple readout points (18), and a SENSE (R=1) phase-sensitive complex-valued reconstruction (19) using sensitivity profiles estimated from the data itself. The slice direction was zero-filled to 288 points before Fourier transform to match the images reconstructed by the scanner, giving an interpolated slice thickness of 1.5mm for improved multiplanar reformatting. The water-fat reconstruction was performed using the method of Berglund et al. (20), as implemented in the ISMRM Fat-Water Toolbox (version 1) (21). The fat model consisted of 9 peaks with frequencies 5.29, 5.19, 4.20, 2.75, 2.24, 1.6, 1.3, 0.9 ppm plus water at 4.7 ppm, as proposed by Hamilton et al. (22). The region-growing parameters c1 and c2 (defined in Ref (20)) were 0.75 and 0.25, respectively. The reconstructed fat image was shifted in the readout direction to correct for chemical shift, and the signal fat fraction image was calculated as sFF = fat/(fat+water) and exported in DICOM format for analysis. Note that with these parameters there is moderate T1 and T2* weighting that was not corrected, so these sFF measurements give somewhat higher values than an unbiased proton density fat fraction (23).
ROI Analysis
To determine if a treatment effect could be measured, we compared pre-treatment sFF values to values at 6-months in the L4 vertebral body and the femoral neck, and also in control regions in adipose tissue and skeletal muscle. Two-dimensional regions of interest (ROIs) were drawn using the Osirix dicom viewer (version 4.1)(24) on representative slices from each 3D sFF dataset. The ROIs were drawn using multi-planar reformatted images that gave the best visualization of the target regions: for the L4 vertebral body a quadrilateral ROI was drawn on the central sagittal slice, for the femoral neck a quadrilateral ROI was drawn on a representative coronal slice. For the control tissues, an axial slice at the level of mid-L4 was selected, and elliptical ROIs were drawn the right psoas major muscle, and the right posterior subcutaneous adipose tissue. The mean value of each ROI was used as a measure of the tissue sFF. The Wilcoxon signed-rank test was used to determine significance of the changes in sFF values between baseline and 6-month post treatment for each ROI.
RESULTS
All 13 subjects received a baseline (pre-treatment) MRI scan, 10 subjects received a 6-month follow-up scan, and 6 subjects received a 12-month follow-up scan. One subject was excluded from analysis due to motion between acquisitions in the baseline scan. Respiratory motion was visible in the anterior abdomen in all subjects, but did not produce discernible artifacts in the spine or pelvis.
A representative pre-treatment 3D image dataset, showing water, fat, and sFF images, is provided in Figure 1. The coronal reformatted slices (a–d) demonstrate the typical extent of coverage in the superior-inferior direction, which extends from the L3 vertebral body to mid-femur, allowing for assessment of marrow within the proximal femur, pelvic bones, sacral spine, and the L3–L5 vertebrae. With the color map used (Matlab’s “jet”) for the sFF images, high-fat regions are shown in red and low-fat regions in blue. There is a large variation in marrow sFF within and between these structures, with relative low sFF in the vertebral bodies, high sFF in the femoral heads, and variable sFF throughout the femoral necks and pelvic bones. The “marrow map” (Fig. 1 d, h) shows the sFF data, manually segmented to select the marrow regions, overlaid on the anatomical water image. The color lookup table used in these images shows the high-sFF regions (sFF>60%) as yellow, low sFF regions (sFF<20%) as red, and midrange values (20%<sFF<60%) with interpolated colors, to provide a more intuitive interpretation of the spatial distribution of red and yellow marrow.
Figure 1.

Representative pre-treatment water-fat imaging dataset. Coronal slice of the a) water, b) fat, and c) signal fat fraction (sFF) images show extent of coverage in the head-foot direction and heterogeneous distribution of fat in the femurs, pelvis, and lumbar vertebrae. An axial slice through the femoral necks is shown in the bottom row (e–g). The color map for the sFF images shows high-fat regions in red and low fat regions in blue. Coronal and axial marrow maps (d, h) show manually segmented regions of marrow with a color map corresponding to red and yellow marrow overlaid on the water image.
Qualitative Findings
An example showing sagittal reformatted slices of sFF in a patient undergoing chemotherapy is given in Figure 2. The pre-treatment study (Fig. 2 a) shows low sFF throughout the marrow of the lumbar bodies, sacrum, and pelvic bone near the pubic symphysis, with a small focus of yellow marrow in L3. At 6 months and 12 months post therapy, the sFF shows a progressive increase in sFF throughout all marrow regions, suggesting a systemic conversion of hematopoietic red marrow to more fatty yellow marrow.
Figure 2.
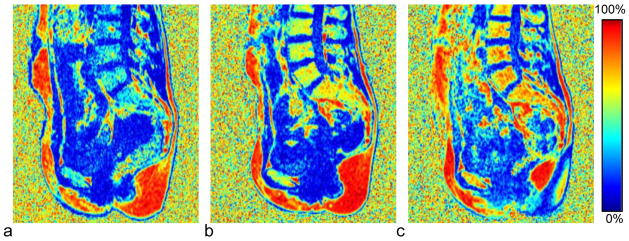
Effect of chemotherapy on marrow sFF in a 35-year old subject with stage IIIc ovarian cancer. The color map for the sFF images shows high-fat regions in red and low fat regions in blue. The baseline study (a), acquired 2 weeks after surgery and prior to initiating chemotherapy, shows uniformly low sFF in all marrow regions. At b) six months and c) twelve months after starting therapy the sFF has increased progressively and with a uniform spatial distribution.
Figure 3 shows sagittal reformatted sFF images in a patient receiving focal radiation therapy at baseline and at 6 months post treatment. The target radiation field was focused on the pelvic region, with approximately 50% of the sacrum receiving >50 Gy. Outside the target radiation field, the radiation dose delivered decreases rapidly, with the L4 vertebral body receiving approximately 2.5 Gy. The increase in marrow fat corresponds with the higher radiation doses within the target field: the sFF values in both L4 and S1 are similar before therapy, but at 6 months the increase of marrow fat in S1 is much greater than that in L4.
Figure 3.

Effect of local therapeutic radiation on marrow sFF in a 52-year old subject with endometrial adenocarcinoma. The baseline sFF image (a) shows spatially uniform moderate fat content in the marrow. The target radiation field was centered on the sacrum, with the upper field border (the extent of the target radiation field) indicated by a black line. At 6-months post-treatment the sFF image (b) shows a greater increase of sFF in the sacral vertebrae, where the dose was highest (≥ 50 Gy), compared to the L4 lumbar vertebral body, which is outside the target radiation field but still received approximately 2.5 Gy. Histograms of the sFF distribution from ROIs in the c) L4 and d) S1 vertebral bodies (drawn in black on a,b) show a baseline fat fraction centered at 40–50% fat, and with higher and more uniform fat fractions in both regions post-treatment.
ROI Analysis
The ROI analysis compared the sFF between baseline and 6-month post-treatment in the L4 vertebral body, the femoral neck, and two control regions, skeletal muscle and subcutaneous adipose tissue. Nine subjects were scanned at both time points, although two subjects were scanned with the small field of view and did not have femoral neck measurements available. The two treatment groups, radiation (n=3) and chemotherapy (n=6), were too small for separate analysis and were thus analyzed together. The results, summarized in Table 1, show a statistically significant increase of fat content in the L4 vertebral body and the femoral neck, but no significant change measured in the control regions (i.e., muscle and adipose tissue).
Table 1.
Signal Fat Fraction values by region at baseline and 6 months
| ROI location | Subjects (n) | median sFF baseline | median sFF 6-months | median difference | p-value |
|---|---|---|---|---|---|
| L4 vertebrae | 9 | 46.9 % | 63.0 % | 16.2 % | 0.039 * |
| femoral neck | 7 | 77.9 % | 88.4 % | 4.5 % | 0.031 * |
| muscle | 9 | 16.6 % | 16.1 % | −0.2 % | 0.734 |
| adipose tissue | 9 | 92.5 % | 93.8 % | 0.1 % | 0.250 |
Statistically significant at p<0.05
sFF – signal fat fraction
ROI – region of interest
The time course of treatment changes over 12 months can be seen in Figure 4. While the sFF values in reference tissues appear stable over time, the sFF in the L4 vertebral body and the femoral necks indicates progressively increasing fat content at 6 and 12 months. Note that statistical tests were not performed at the 12 month time point due to insufficient data.
Figure 4.

Time course of treatment effect in 11 subjects at three time points, shown as individual profile plots overlaid with box plots indicating median and quartile (25 and 75%) values at each time point. Plots show ROI mean values from the a) L4 vertebral body and b) femoral neck (FN) regions, as well as reference ROIs from c) skeletal muscle (psoas major) and d) subcutaneous adipose tissue. Insets in each plot show the ROI placement for a representative subject. Subjects receiving radiation are shown in red; those receiving chemotherapy are shown in black. A progressive increase in the L4 vertebral body and femoral neck is apparent at 6 and 12 months, while no substantial changes are seen in the reference tissues.
DISCUSSION
Water-fat imaging was found to be sensitive to marrow composition changes due to chemotherapy and radiation therapy. In both the femoral necks and L4 vertebrae, there was a statistically significant increase in sFF at 6 months with a trend of increasing sFF at 12 months. While increased sFF was seen on average, there was one subject undergoing chemotherapy who showed decreased sFF in L4 and FN at 6 months, but net increase in both regions at 12 months. The magnitude of the effect appeared similar with both treatment regimens, but there was insufficient data to test the radiation and chemotherapy groups separately. One clear distinction was the spatial variation of the effect, in which the increased sFF in chemotherapy was relatively uniform across marrow regions, whereas in radiation therapy the changes appeared to coincide with higher radiation doses delivered within and close to the target radiation field.
We observed substantial spatial heterogeneity of sFF in the different bone regions. The lumbar vertebrae tended to have low sFF and were more uniform, whereas in the pelvis and femurs there were typically regions dominated by either red or yellow marrow. The use of mean values over a 2D ROI to characterize the marrow composition may not be appropriate for these heterogeneous regions; histogram analysis or finer region segmentation may provide better characterization. This also suggests that pelvic marrow biopsies may be prone to sampling errors, and therefore image-guided biopsies may provide a better characterization of the pelvic marrow composition.
While Liang et al. showed how pre-treatment fat-fraction imaging can be used to plan radiation therapy (17), measuring marrow composition changes over the course of radiation and chemotherapy may have several valuable applications. The relationships between marrow composition and both bone mineral density and hematopoietic function are not well understood, and water-fat imaging would be valuable in research studies that aim to address comprehensive bone and marrow health. In immediate clinical applications, there are several therapeutic interventions, such as anti-resorptive agents and modulator of mesenchymal stem cell differentiation which can potentially reduce marrow adiposis (25,26). Fat-fraction imaging could be used to select patients and monitor the effects of such interventions. In patients receiving bone marrow transplant, fat-fraction imaging may be useful in guiding biopsy procedures and would provide more spatially complete information about the marrow engraftment process.
This study had several limitations. Firstly, the sample size was relatively small, and while a significant effect was measured across the entire population, subgroup analyses were not possible. The study is ongoing, and such analyses will be possible on the final data.
Secondly, this study did not control for age and menopausal status, which are known to impact marrow composition and may confound these results. However, the magnitude of age-related increase in marrow fat is substantially smaller than the treatment effect size seen here. Kugel et al. performed MRS measurements in the vertebral marrow and showed that marrow fat fraction increased by <1% per year between ages 30–60 in women (6), compared to the treatment effects reported here of +13% (L4) and +7.5% (FN) over a 6 month time period.
Thirdly, the signal fat fraction used in this study includes some bias from T1 and T2*, and thus differs from the unbiased proton density fat fraction (pdFF) (23). The moderate T1 bias gives sFF values that are higher than the true pdFF; e.g., with a pdFF=50% and T1water=1100ms and T1fat=365ms (27), the sFF would be 63.9%. For known T1 values the difference between sFF and pdFF is a non-linear scaling and could potentially be corrected retrospectively (28–30). T2* effects may be substantial due to the short T2* in trabecular bone, which produces signal losses between the echoes and before the first echo. Separate acquisitions were used to enable close echo spacing and reduce signal loss between echoes, but T2* bias is still present. Correcting the T2* bias is possible but requires additional echoes and alternate reconstruction techniques (29,31,32).
Noise bias correction (28) was not performed, as this bias is prominent in regions with very low or high fat fractions. Measurement of an unbiased pdFF and validation with either ex vivo data or independent MRS measurements (33–35) would make the results more generalizable, and will be explored in future work.
In conclusion, we have demonstrated that it is feasible to rapidly acquire high-resolution 3-dimensional sFF maps from mid-femur to the L3 lumbar vertebra, and that the sFF can detect and characterize marrow composition changes induced by chemotherapy and radiation therapy. The marrow fat fraction is potentially an imaging biomarker of bone marrow health and may be useful in planning and monitoring treatment of cancer patients.
Acknowledgments
Grant Support
This work was supported partly by the National Institute of Health grants (1R03AR055333, 1K12-HD055887, and 1R01CA154491), PHS Cancer Center Support Grant P30 CA77598, and by Biotechnology Research Center (BTRC) grant P41 RR008079 (NCRR) and P41 EB015894 (NIBIB). This work is also supported by the Clinical and Translational Science Institute (CTSI) of University of Minnesota (through NIH grant 8UL1TR0001114) and the Minnesota Medical Foundation (MMF). Susanta K Hui and Rahel Ghebre are scholars of the BIRCWH (Building Interdisciplinary Careers in Women’s Health) program.
References
- 1.Georgiou KR, Foster BK, Xian CJ. Damage and recovery of the bone marrow microenvironment induced by cancer chemotherapy - potential regulatory role of chemokine CXCL12/receptor CXCR4 signalling. Curr Mol Med. 2010;10:440–453. doi: 10.2174/156652410791608243. [DOI] [PubMed] [Google Scholar]
- 2.Li J, Law HKW, Lau YL, Chan GCF. Differential damage and recovery of human mesenchymal stem cells after exposure to chemotherapeutic agents. Br J Haematol. 2004;127:326–334. doi: 10.1111/j.1365-2141.2004.05200.x. [DOI] [PubMed] [Google Scholar]
- 3.Sacks EL, Goris ML, Glatstein E, Gilbert E, Kaplan HS. Bone marrow regeneration following large field radiation: influence of volume, age, dose, and time. Cancer. 1978;42:1057–1065. doi: 10.1002/1097-0142(197809)42:3<1057::aid-cncr2820420304>3.0.co;2-p. [DOI] [PubMed] [Google Scholar]
- 4.Rosen CJ, Ackert-Bicknell C, Rodriguez JP, Pino AM. Marrow fat and the bone microenvironment: developmental, functional, and pathological implications. Crit Rev Eukaryot Gene Expr. 2009;19:109–124. doi: 10.1615/critreveukargeneexpr.v19.i2.20. [DOI] [PMC free article] [PubMed] [Google Scholar]
- 5.Schick F, Bongers H, Jung WI, Skalej M, Lutz O, Claussen CD. Volume-selective proton MRS in vertebral bodies. Magn Reson Med. 1992;26:207–217. doi: 10.1002/mrm.1910260203. [DOI] [PubMed] [Google Scholar]
- 6.Kugel H, Jung C, Schulte O, Heindel W. Age- and sex-specific differences in the 1H-spectrum of vertebral bone marrow. J Magn Reson Imaging. 2001;13:263–268. doi: 10.1002/1522-2586(200102)13:2<263::aid-jmri1038>3.0.co;2-m. [DOI] [PubMed] [Google Scholar]
- 7.Yeung DKW, Griffith JF, Antonio GE, Lee FKH, Woo J, Leung PC. Osteoporosis is associated with increased marrow fat content and decreased marrow fat unsaturation: a proton MR spectroscopy study. J Magn Reson Imaging. 2005;22:279–285. doi: 10.1002/jmri.20367. [DOI] [PubMed] [Google Scholar]
- 8.Li X, Kuo D, Schafer AL, et al. Quantification of vertebral bone marrow fat content using 3 tesla MR spectroscopy: Reproducibility, vertebral variation, and applications in osteoporosis. J Magn Reson Imaging. 2011;33:974–979. doi: 10.1002/jmri.22489. [DOI] [PMC free article] [PubMed] [Google Scholar]
- 9.Bredella MA, Torriani M, Ghomi RH, et al. Vertebral bone marrow fat is positively associated with visceral fat and inversely associated with IGF-1 in obese women. Obesity (Silver Spring) 2011;19:49–53. doi: 10.1038/oby.2010.106. [DOI] [PMC free article] [PubMed] [Google Scholar]
- 10.Baum T, Yap SP, Karampinos DC, et al. Does vertebral bone marrow fat content correlate with abdominal adipose tissue, lumbar spine bone mineral density, and blood biomarkers in women with type 2 diabetes mellitus? J Magn Reson Imaging. 2012;35:117–124. doi: 10.1002/jmri.22757. [DOI] [PMC free article] [PubMed] [Google Scholar]
- 11.Dixon WT. Simple proton spectroscopic imaging. Radiology. 1984;153:189–194. doi: 10.1148/radiology.153.1.6089263. [DOI] [PubMed] [Google Scholar]
- 12.Reeder SB, Pineda AR, Wen Z, et al. Iterative decomposition of water and fat with echo asymmetry and least-squares estimation (IDEAL): application with fast spin-echo imaging. Magn Reson Med. 2005;54:636–644. doi: 10.1002/mrm.20624. [DOI] [PubMed] [Google Scholar]
- 13.Rosen BR, Fleming DM, Kushner DC, et al. Hematologic bone marrow disorders: quantitative chemical shift MR imaging. Radiology. 1988;169:799–804. doi: 10.1148/radiology.169.3.3187003. [DOI] [PubMed] [Google Scholar]
- 14.Johnson LA, Hoppel BE, Gerard EL, et al. Quantitative chemical shift imaging of vertebral bone marrow in patients with Gaucher disease. Radiology. 1992;182:451–455. doi: 10.1148/radiology.182.2.1732964. [DOI] [PubMed] [Google Scholar]
- 15.Brix G, Heiland S, Bellemann ME, Koch T, Lorenz WJ. MR imaging of fat-containing tissues: valuation of two quantitative imaging techniques in comparison with localized proton spectroscopy. Magn Reson Imaging. 1993;11:977–991. doi: 10.1016/0730-725x(93)90217-2. [DOI] [PubMed] [Google Scholar]
- 16.Liney GP, Bernard CP, Manton DJ, Turnbull LW, Langton CM. Age, gender, and skeletal variation in bone marrow composition: a preliminary study at 3. 0 Tesla. J Magn Reson Imaging. 2007;26:787–793. doi: 10.1002/jmri.21072. [DOI] [PubMed] [Google Scholar]
- 17.Liang Y, Bydder M, Yashar CM, et al. Prospective Study of Functional Bone Marrow-Sparing Intensity Modulated Radiation Therapy With Concurrent Chemotherapy for Pelvic Malignancies. International Journal of Radiation Oncology, Biology, Physics. 2012 doi: 10.1016/j.ijrobp.2012.04.044. Epub ahead of print. [DOI] [PubMed] [Google Scholar]
- 18.Blaimer M, Breuer FA, Mueller M, et al. 2D-GRAPPA-operator for faster 3D parallel MRI. Magn Reson Med. 2006;56:1359–1364. doi: 10.1002/mrm.21071. [DOI] [PubMed] [Google Scholar]
- 19.Robson PM, Grant AK, Madhuranthakam AJ, Lattanzi R, Sodickson DK, McKenzie CA. Comprehensive quantification of signal-to-noise ratio and g-factor for image-based and k-space-based parallel imaging reconstructions. Magn Reson Med. 2008;60:895–907. doi: 10.1002/mrm.21728. [DOI] [PMC free article] [PubMed] [Google Scholar]
- 20.Berglund J, Johansson L, Ahlström H, Kullberg J. Three-point dixon method enables whole-body water and fat imaging of obese subjects. Magn Reson Med. 2010;63:1659–1668. doi: 10.1002/mrm.22385. [DOI] [PubMed] [Google Scholar]
- 21.Hu HH, Börnert P, Hernando D, Kellman P, Ma J, Reeder S, Sirlin C. ISMRM workshop on fat water separation: Insights, applications and progress in MRI. Magn Reson Med. 2012;68:378–388. doi: 10.1002/mrm.24369. [DOI] [PMC free article] [PubMed] [Google Scholar]
- 22.Hamilton G, Yokoo T, Bydder M, et al. In vivo characterization of the liver fat–1H MR spectrum. NMR Biomed. 2011;24:784–790. doi: 10.1002/nbm.1622. [DOI] [PMC free article] [PubMed] [Google Scholar]
- 23.Reeder SB, Cruite I, Hamilton G, Sirlin CB. Quantitative assessment of liver fat with magnetic resonance imaging and spectroscopy. J Magn Reson Imaging. 2011;34:729–749. doi: 10.1002/jmri.22580. [DOI] [PMC free article] [PubMed] [Google Scholar]
- 24.Rosset A, Spadola L, Ratib O. OsiriX: An Open-Source Software for Navigating in Multidimensional DICOM Images. J Digital Imaging. 2004;17:205–216. doi: 10.1007/s10278-004-1014-6. [DOI] [PMC free article] [PubMed] [Google Scholar]
- 25.Duque G, Li W, Adams M, Xu S, Phipps R. Effects of risedronate on bone marrow adipocytes in postmenopausal women. Osteoporos Int. 2011;22:1547–1553. doi: 10.1007/s00198-010-1353-8. [DOI] [PubMed] [Google Scholar]
- 26.Hong J-H, Hwang ES, McManus MT, et al. TAZ, a transcriptional modulator of mesenchymal stem cell differentiation. Science. 2005;309:1074–1078. doi: 10.1126/science.1110955. [DOI] [PubMed] [Google Scholar]
- 27.Gold GE, Han E, Stainsby J, Wright G, Brittain J, Beaulieu C. Musculoskeletal MRI at 3. 0 T: relaxation times and image contrast. AJR Am J Roentgenol. 2004;183:343–351. doi: 10.2214/ajr.183.2.1830343. [DOI] [PubMed] [Google Scholar]
- 28.Liu C-Y, McKenzie CA, Yu H, Brittain JH, Reeder SB. Fat quantification with IDEAL gradient echo imaging: correction of bias from T(1) and noise. Magn Reson Med. 2007;58:354–364. doi: 10.1002/mrm.21301. [DOI] [PubMed] [Google Scholar]
- 29.Bydder M, Yokoo T, Hamilton G, et al. Relaxation effects in the quantification of fat using gradient echo imaging. Magn Reson Imaging. 2008;26:347–359. doi: 10.1016/j.mri.2007.08.012. [DOI] [PMC free article] [PubMed] [Google Scholar]
- 30.Karampinos DC, Yu H, Shimakawa A, Link TM, Majumdar S. T1-corrected fat quantification using chemical shift-based water/fat separation: Application to skeletal muscle. Magn Reson Med. 2011;66:1312–1326. doi: 10.1002/mrm.22925. [DOI] [PMC free article] [PubMed] [Google Scholar]
- 31.Chebrolu VV, Hines CDG, Yu H, et al. Independent estimation of T*2 for water and fat for improved accuracy of fat quantification. Magn Reson Med. 2010;63:849–857. doi: 10.1002/mrm.22300. [DOI] [PMC free article] [PubMed] [Google Scholar]
- 32.Yu H, McKenzie CA, Shimakawa A, et al. Multiecho reconstruction for simultaneous water-fat decomposition and T2* estimation. J Magn Reson Imaging. 2007;26:1153–1161. doi: 10.1002/jmri.21090. [DOI] [PubMed] [Google Scholar]
- 33.Pichardo JC, Milner RJ, Bolch WE. MRI measurement of bone marrow cellularity for radiation dosimetry. J Nucl Med. 2011;52:1482–1489. doi: 10.2967/jnumed.111.087957. [DOI] [PubMed] [Google Scholar]
- 34.Meisamy S, Hines CDG, Hamilton G, et al. Quantification of Hepatic Steatosis with T1-independent, T2*-corrected MR Imaging with Spectral Modeling of Fat: Blinded Comparison with MR Spectroscopy. Radiology. 2011;258:767–775. doi: 10.1148/radiol.10100708. [DOI] [PMC free article] [PubMed] [Google Scholar]
- 35.Yokoo T, Shiehmorteza M, Hamilton G, et al. Estimation of Hepatic Proton-Density Fat Fraction by Using MR Imaging at 3. 0 T. Radiology. 2011;258:749–759. doi: 10.1148/radiol.10100659. [DOI] [PMC free article] [PubMed] [Google Scholar]