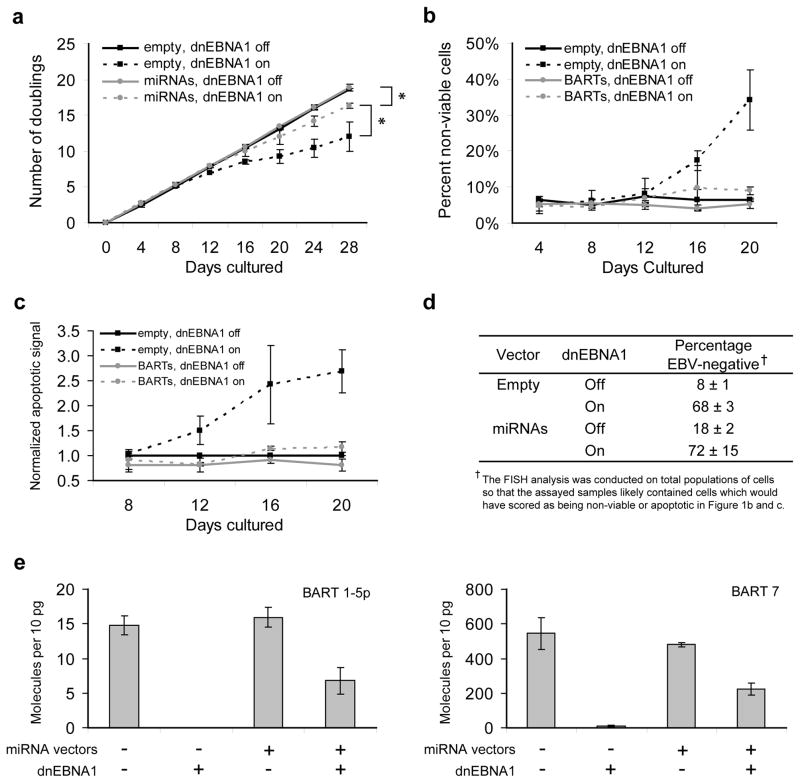
Figure 1. Ectopic expression of BART miRNAs partially complements the loss of EBV in BL cells.
(a) The population growth of S1-1 cells was measured over time as EBV was evicted following induction of dominant negative EBNA1 (dnEBNA1) at day 0 with doxycycline. The average of three independent experiments, each with one technical replicate ± SD is shown. * p=0.05, one-sided Wilcoxon signed rank test, comparing total number of cell doublings. (b) Cells with or without exogenously introduced BART miRNAs plus or minus induction of dnEBNA1 to evict EBV were assayed for global cell death by staining cells with trypan blue and examining cell morphology. For each data point at least 600 cells were analyzed. The average of three independent experiments ± SD (at least 200 cells per experiment) is shown. (c) Cells as treated in B were assayed for the induction of apoptosis by detecting the activation of caspases (Caspase-Glo 3/7, Promega). Signals were normalized to homeostatic levels (cells transduced with an empty vector in which dnEBNA1 is not induced) which were arbitrarily set to one. The average of three independent experiments ± SD is shown. (d) Cells were cultured for 20 days with or without induction of dnEBNA1 and then scored for the presence of viral DNA by FISH analysis. For each experiment, at least 200 cells were counted per condition. The average percentage of EBV-negative cells ± SD from three independent experiments is shown. (e) Real-time PCR measurements of the levels of two BART miRNAs, BART 1-5p (left graph) and BART 7 (right graph), were made 20 days after induction of dnEBNA1 in S1-1 cells. The average number of miRNA molecules per 10 picograms of total RNA ± SD is shown from three independent experiments.

