



Abstract

Although biomarkers exist for a range of disease diagnostics, a single low-cost platform exhibiting the required sensitivity, a large dynamic-range and multiplexing capability, and zero sample preparation remains in high demand for a variety of clinical applications. The Interferometric Reflectance Imaging Sensor (IRIS) was utilized to digitally detect and size single gold nanoparticles to identify protein biomarkers in unprocessed serum and blood samples. IRIS is a simple, inexpensive, multiplexed, high-throughput, and label-free optical biosensor that was originally used to quantify biomass captured on a surface with moderate sensitivity. Here we demonstrate detection of β-lactoglobulin, a cow’s milk whey protein spiked in serum (>10 orders of magnitude) and whole blood (>5 orders of magnitude), at attomolar sensitivity. The clinical utility of IRIS was demonstrated by detecting allergen-specific IgE from microliters of characterized human serum and unprocessed whole blood samples by using secondary antibodies against human IgE labeled with 40 nm gold nanoparticles. To the best of our knowledge, this level of sensitivity over a large dynamic range has not been previously demonstrated.
IRIS offers four main advantages compared to existing technologies: it (i) detects proteins from attomolar to nanomolar concentrations in unprocessed biological samples, (ii) unambiguously discriminates nanoparticles tags on a robust and physically large sensor area, (iii) detects protein targets with conjugated very small nanoparticle tags (~40 nm diameter), which minimally affect assay kinetics compared to conventional microparticle tagging methods, and (iv) utilizes components that make the instrument inexpensive, robust, and portable. These features make IRIS an ideal candidate for clinical and diagnostic applications.
Highly sensitive, quantitative, and multiplexed biomarker detection is a crucial focus for the technological development of next generation diagnostics.1 Biomarkers are successful identifiers of diagnosis and prognosis in a variety of diseases from cancer to allergy. For example, nearly an 80% total decrease in cancer mortalities for colorectal, female breast, and prostate cancer have been largely due to improvements in early detection and treatment.2 Likewise, determination of systemic sensitization to specific allergens has been established as the primary method to guide trigger avoidance.3,4 Although protein biomarkers are known for a range of diseases, current multiplexed protein biosensors are subject to limitations: (i) the absence of a large dynamic range assay to accurately detect all clinically relevant concentrations of a variety of biomarkers5 (See Table S1 of the Supporting Information for a partial list which expands over 5 orders of magnitude), (ii) the inability to screen for a panel of biomarkers, versus a single biomarker, for reliable disease detection and monitoring,6,7 (iii) the challenge of maintaining sensitivity and specificity in unprocessed whole blood or minimally prepared serum samples,8 and (iv) the need for the biosensor platform to be robust, portable, and versatile.9
Biomarkers in serum have been detected using a variety of transduction and amplification mechanisms, such as electrochemical,10,11 mechanical,12,13 or optical14,15 techniques; micro/nanoparticle tagging and single molecule detection methods are often used to achieve very high sensitivity. One particular sensing approach termed the biobarcode assay developed by Stoeva et al. uses AuNPs as secondary probes to detect protein targets. Once bound, the tags are additionally stained with silver to amplify the signal to achieve high sensitivity from the attomolar to picomolar range in a multiplexed format.15,16 Furthermore, single molecule quantification has been demonstrated by detecting binary events to achieve digital sensing.17,18 For example, Rissin et al. have developed a single-molecule ELISA method to detect proteins at subfemtomolar concentrations over 4 orders of magnitude in serum.18 These techniques require that the biomarkers of interest be within the dynamic range of the platform and that whole blood samples must be processed prior to testing. Moreover, nanoscale and complex sensing elements used in these single particle detection techniques may limit clinical applicability such as point of care testing.19,20
Protein detection at the attomolar sensitivity in serum has also been achieved by using microparticles with diameters between 1 and 200 μm attached to secondary antibodies.21 While the large size of these microparticles allows for visibility in a conventionally acquired image, they are known to severely reduce the diffusivity [~3–4 orders of magnitude (Figure S1 of the Supporting Information)] and thus require external force fields.22 Moreover, once the microparticle tag exceeds 3 μm in diameter, the particle will settle out of solution and only undergo two-dimensional (2D) diffusion and may cause the assay outcome to be inaccurate.21,22 To maintain native kinetics of the particle-probe complex, it is crucial that the particle tag be on a similar size scale as the target.
While highly sensitive protein detection methods have been achieved in serum samples, biomarker detection in unprocessed whole blood remains very challenging, due to nonspecific binding of cells and particulates to the sensor surface. One approach to perform biosensing in whole blood samples has been demonstrated by Stern et al., who have developed a microfabricated microfluidic purification chip to process 10 μL of whole blood in 20 min.23 However, this technique only achieves 500 pM sensitivity, which is 106 times less sensitive than the techniques established for detection in serum. Moreover, this level of sensitivity is not pertinent to most protein biomarkers, whose serum concentrations in healthy individuals range between 0.01 and 100 pM (Table S1 of the Supporting Information).
Here, we demonstrate the ability of IRIS to perform discrete detection of allergen-specific IgE, a biomarker of allergy, in unprocessed whole blood samples, with negligible nonspecific binding from the attomolar to picomolar range by discriminating 40 nm AuNP tags, with negligible effects on binding kinetics, functionalized to secondary antibodies over a physically large and robust sensor surface. The IRIS technique has been first-demonstrated for label-free and quantitative measurements of biomass captured on the sensor surface24,25 and recently modified to detect single nanoparticles across a large sensor surface using only basic optical components: a simple, inexpensive, silicon–silicon oxide (Si–SiO2) substrate, commercially available LEDs, and a CCD detector.26 Typical optical sensors designed to detect single nanoparticles utilize microfabricated devices with small surface areas.27,28 IRIS uses a simple planar surface that is easy to multiplex and does not require microfabricated features. Instead, IRIS benefits from enhanced visibility due to the interference of the optical field scattered from captured nanoparticles interfering with the reference reflection from the layered surface. In this imaging sensor modality, each diffraction-limited spot creates the opportunity to detect a single binding event on the IRIS substrate, effectively yielding as many as 106 parallel sensing elements with discrete detection capability.29
The primary differences in the total biomass quantification and single nanoparticle counting modalities of IRIS are the magnification of the objective, the oxide spacer on the substrate, and the resulting information of the image acquired by the CCD array (Figure S2 of the Supporting Information). The first modality (low magnification) of IRIS quantifies biomass on a surface by converting the intensity value of each pixel in the CCD array into an average optical height measurement. The second modality (high magnification) of IRIS detects, size discriminates, and counts individual AuNP. The resulting discrete detection of nanoparticle tags provides the ability to distinguish the specific binding events in complex solutions, allowing for detection in serum and whole blood with high sensitivity. However, discrete detection requires that the density of nanoparticles on the surface is no more than one per diffraction limited spot and thus has an upper limit in detection concentration. In practice, for unambiguous discrimination of individual AuNP tags from the background, a relatively low density on the surface, less than 104 particles/mm2, is desirable thus imposing a limit on the dynamic range. While the discrete detection saturates at the high-target protein concentration, the sensitivity of the low-magnification modality of IRIS would become sufficient and thus provide label-free total biomass quantification. These complementary modalities may be achieved in a single instrument by changing the optical magnification, similar to different objectives on a microscope turret, and result in a high sensing capability.
We utilize IRIS technology to detect allergen-specific IgE in finger-prick volumes of characterized patient serum and whole blood samples. Allergy is a disorder of the immune system caused by an immune response to otherwise harmless environmental allergens. Currently, 20% of the U.S. population is allergic, and 90% of pediatric patients and 60% of adult patients with asthma have allergies. These percentages are predicted to increase by 18.5%, in the next decade.30–32 While a variety of commercialized assays (ImmunoCAP, Siemens, Hycor Biomedical, Hitachi Chemical Diagnostics, Luminex Corporation) have been developed for allergy diagnostics in the laboratory setting, the ImmunoCAP Rapid System (Thermo-Fisher Scientific) is the only commercialized allergen-specific IgE test that can operate with unprocessed blood samples. This assay uses a capillary blood draw of 100 μL and totals 25 min of testing, while other commercialized assays take 1 h of sample preparation in addition to over 4 h of assay time.33,34 However, the Rapid System is limited to aeroallergens, has a narrow dynamic range, and requires professional interpretation of results because it is not quantitative. IRIS is a combined label and label-free platform that offers the ability to detect biomarkers in small volumes of unprocessed whole blood over 5 orders of magnitude and in serum over 10 orders of magnitude, with high accuracy and reproducibility.
RESULTS AND DISCUSSION
This report focuses on the single nanoparticle counting modality of the IRIS platform. The novel, yet straightforward, features of this modality have facilitated the design of a highly sensitive (attomolar), large dynamic range (attomolar to nanomolar), quantifiable, and multiplexed immunoassay in both serum and whole blood using 40 nm AuNP-functionalized secondary antibodies (Figure 1). The unique ability to detect single nanoparticles over a large sensor area with the IRIS platform allows the use of nanoparticle tags that are in the size regime of the target molecules, without sacrificing the kinetics of the reaction (Figure S1 of the Supporting Information). Moreover, the platform maintains the ability to detect target at attomolar quantities in unprocessed whole blood. Discrimination of nanoparticle tags29,35 and a large sensor size contribute to the low limit of detection (LOD) of the assay. Finally, large multiplexing capability and clinical applicability of the IRIS platform is demonstrated by testing characterized serum and whole blood samples with documented allergen-specific IgE levels. The results were compared to ImmunoCAP characterization for platform validation (Figure 4).
Figure 1.

(a) Detection schematic of β-lactoglobulin using anti-β-lactoglobulin functionalized 40 nm AuNPs as the detection complex. The mean final diameter of the detection complex after functionalization was measured to be 51 nm with dynamic light scattering (DLS). BSA was used as a negative control. (b) IRIS images before and after detection of complex incubation to detect 5 pM of β-lactoglobulin spiked in unprocessed whole blood. (c) Histograms of detected particles on the sensor area of anti-β-lactoglobulin probes and the mean, standard deviation (SD) and counts using (i) no filtering, (ii) anomaly filtering, (iii) point spread function (PSF) filtering, and (iv) size discrimination. The size and distribution of the functionalized AuNP diameters agree with the sizes measured by DLS and the distribution specifications provided by the distributor.
Figure 4.

The limit of detection (LOD) per square millimeter as a function of sensor size for serum and whole blood. At a sensor area of 0.684 mm2 (8 spots of immobilized probe), the LOD is 62 aM for serum and 507 aM in whole blood.
Quantification and Verification of Bound AuNPs Using Elimination Processes on IRIS
IRIS nanoparticle images were acquired and processed with custom software. IRIS returns a histogram of the size distribution of nanoparticles in the image and uses three important elimination processes, anomaly filtering, point-spread-function (PSF) filtering, and size-discrimination, to ensure accurate and sensitive detection of labeled detection antibodies (Figures 1c and 2). Figures 1c and 2 demonstrate the importance of eliminating particles in the image that are not the functionalized AuNPs used specifically for target detection. Without filtering, the average size and standard deviation of the particles detected on the surface was 59 ± 18 nm, corresponding to a larger size than expected for the AuNP tags, indicated that many of the “detected” particles are image artifacts, also indicated by the very large size distribution. After using IRIS elimination processes, the average size and standard deviation of detected nanoparticles was reduced to 53 ± 4 nm, which was the diameter of the functionalized AuNPs confirmed with dynamic light scattering (DLS). Likewise, the dynamic range of the assay was improved by 4 orders of magnitude after applying the elimination processes (Figure 2). Because aberrations in the image may affect the calculated particle size, AuNPs that were 54 ± 10 nm in diameter were analyzed to quantify the number of binding events during dilution experiments.
Figure 2.
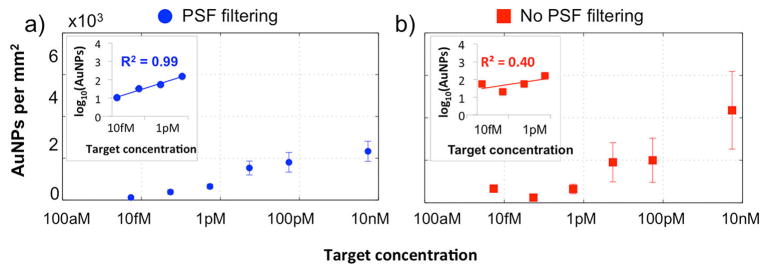
Insets are the log–log plot of each measurement and display the effects of point-spread function (PSF) filtering on the correlation of the signal to target concentration in undiluted serum. Without PSF filtering, the sensitivity drops from the attomolar to picomolar regime and the dynamic range decreases by 4 logs of magnitude. Standard deviation from the mean also increases without PSF filtering because particulates in the image were falsely detected as gold particles. Finally, correlation of AuNPs per square millimeter to dilution is reduced from 0.99 to 0.40 without implementing PSF filtering.
Attomolar Detection of β-lactoglobulin in Undiluted Serum and Unprocessed Whole Blood
IRIS single particle counting digitally detected β-lactoglobulin spiked in 1 mL of undiluted serum or unprocessed whole blood and improved upon the dynamic range and sensitivity of the IRIS biomass platform (Figure 3). Analysis of the nanoparticle counting data resulted in a 107-fold increase in repeatable sensitivity from the nanomolar to the attomolar regime in unprocessed biological samples (Figure 3a). Post AuNP incubation images of immobilized anti-β-lactoglobulin and BSA probes incubated with β-lactoglobulin at various dilutions are presented in Figure S3 of the Supporting Information. Protein microarrays are notorious for inconsistent or poor morphologies, and a detection platform must not be compromised because of these intrinsic and often unavoidable features.36,37 Furthermore, serum and whole blood contain nonhomogenous particulates and cells that may affect detection sensitivity and range. Thus, the ability to discriminate against any false signal and/or nonspecific binding caused by these features is crucial for reducing noise of the assay. The ability to automatically discriminate AuNPs from nonspecific particles provides IRIS with a method to reduce the biological noise associated with the use of complex samples. Overall, this feature of the nanoparticle counting modality is key to producing reliable, sensitive detection of the target in serum and unprocessed whole blood. Figure S3 of the Supporting Information includes examples of poor immobilization of anti-β-lactoglobulin and BSA probes. It is crucial that the nonhomogeneity of the spot does not affect nanoparticle quantification. By instituting the IRIS elimination processes, only AuNPs introduced by the user are detected in the image. Likewise, the biomass measurement was previously shown to correct variation in allergy chips and is reported elsewhere.38
Figure 3.
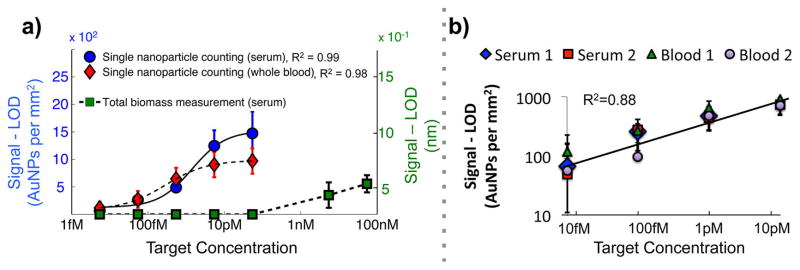
(a) The response determined by the signal minus the limit of detection of either IRIS nanoparticle counting or total biomass measurement. Results demonstrate comparable responses of target detection by nanoparticle counting in serum (N = 8) and whole blood (N = 4). Correlation was determined by taking the power-log of the response and target concentration of single nanoparticle data (Rserum2 = 0.99, ). When the nanoparticle counting measurement reaches its upper limit, the total biomass measurement becomes sensitive. Error bars refer to the standard deviation of the mean. (b) The response determined by the signal minus the limit of detection (LOD) for two serums and two whole bloods experiments. The correlation between the mean of each data point (16 total points from 4 experiments) is 0.88. Error bars correspond to the standard deviation between the mean (Nserum = 8, Nblood = 4).
A schematic of the assay and the signal minus the LOD of each modality are shown in Figure 3a. Repeatability of the assay is shown in Figure 3b. Anti-β-lactoglobulin probes were used to capture the target from the complex solution. BSA probes were used as a negative control. The LOD of the nanoparticle counting modality was calculated to be ~60 aM in undiluted serum and ~500 aM in unprocessed whole blood (See the Supporting Information for details on defining the limit of detection). With the use of fluorescently labeled secondary antibodies, the LOD of the same protein system was found to be 163 fM in PBS.39 As the response of nanoparticle counting saturates, the biomass (low magnification) measurement in serum becomes suffciently sensitive at 2 nM and linearly increases. Unfortunately, the biomass measurement fails in whole blood due to large amounts of nonspecific binding to the sensor surface, and this causes the dynamic range of the IRIS platform to be reduced from 10 orders of magnitude in serum to about 5 orders of magnitude in whole blood.
Although attomolar sensitivity has been matched by other methods,40,41 the ability to perform highly sensitive detection of biomarkers over a large dynamic range in unprocessed, complex biological samples with these techniques has not been reported. Furthermore, these techniques require microparticle tags, multiple amplification steps, nanoscale elements, and/or expensive instrumentation that may not be suitable for clinical applications, such as POC testing. With improved sensitivity and dynamic range, IRIS can be implemented as a single, simple instrument to quantify a wide range of biomarkers of varying concentrations in undiluted serum and unprocessed whole blood in a single test.
Advantages of Increasing Biological Sensor Area to Improve Assay Sensitivity
Multiplexing capacity is a desirable criterion for biosensors developed for clinical applications. High-throughput platforms generally perform multiple tests in a minimum of 3 replicates to calculate a mean and standard deviation of each test. These tests run a “blank” sample in parallel to compute the LOD (mean plus 3 times the standard deviation) of the assay. The number of wells or the sensor area usually limits the total number of tests a platform may perform. Thus, a compromise between the number of tests and the number of replicates of each test must be determined in order to collect meaningful data that will contribute to the detection of multiple biomarkers with potentially different sensitivity thresholds; for example, an increase in multiplexing capability results in a decreased ability to replicate each test because the available sensor area is dedicated to multiplexing. The effect of sensor size per test is studied as a function of sensor area to highlight these considerations (Figure 4).
The occurrence of independent and random binding events becomes discrete when sufficiently low numbers of target molecules are in solution and may be maximized by increasing the sensor area.42 Similarly, a larger sensor area reduces the variance of stochastic noise of the system, such as nonspecific binding. Here, the surface area of immobilized probes on the IRIS substrate describes the sensor area, n. The LOD per square millimeter as a function of sensor size for serum and whole blood samples on the IRIS platform is shown in Figure 4. The LOD per square millimeter is defined as the average signal (AuNPs/square millimeter) of a defined sensor size plus 3 times the standard deviation from the mean. Standard deviation is a function of sample size, n, which scales by 1/√n. As expected, an increase in sensor size causes the LOD per square millimeter to decrease by 1/√n and level off at a constant value representative of the mean (R2 = 1.0) for both serum and whole blood measurements (See Figure S4 of the Supporting Information for details on calculation of LOD and regression). At a sensor area of 0.684 mm2 (approximately 8 spots of immobilized anti-β-lactoglobulin probes), the LOD per square millimeter is 62 aM in serum and 507 aM in whole blood. Conventional tests utilize 3 replicates to calculate the LOD of their platform. On the basis of our measurements, if we utilized a sensor area of a single spot (~0.0855 mm2 area), the LOD per square millimeter is 322 aM in serum and 46 fM in unprocessed whole blood. Theoretically, if the sensor area were infinite in size, the LOD per square millimeter for both serum and whole blood would approach 10 aM. Although an order of magnitude of sensitivity is lost in whole blood samples when a sensor area of 0.684 mm2 (~8 spots) is used, this level of sensitivity in unprocessed whole blood samples is, to the best of our knowledge, unmatched by other technologies that sense single molecular targets in unprocessed whole blood. Because a single nanoparticle can be detected on the IRIS substrate, the primary limitation of the platform becomes the ability to increase the capture efficiency of molecules in solution.
Determination of the Lower Limit of Quantitation (LLQ) and Upper Limit of Quantitation (ULQ)
The LLQ per square millimeter for the β-lactoglobulin assay was 260 aM in serum and 15 fM in unprocessed whole blood, using a sensor area of 0.684 mm2. Commercialized allergen-specific IgE assays, such as ImmunoCAP (Phadia), Immulite (Siemens), and Turbo RAST (Hycor Biomedical), that detect allergen-specific IgE are typically carried out in ELISA format. Luminex Corporation recently commercialized an allergy assay with xMAP Technology (Luminex Corp). An analytical comparison of the two assays demonstrated the LLQ of ELISA to be ~600 fM and the LLQ of xMAP MAGPIX Technology to be ~100 fM when running a TNFα MAGPIX assay.33,34 These commercialized assays are limited to only serum samples and small sensor areas. IRIS technology is 1000 times more sensitive in serum and 10 times more sensitive in unprocessed whole blood samples. The ULQ for the β-lactoglobulin assay in serum was determined to be 100 pM in serum and whole blood samples using IRIS single nanoparticle counting (Figure 5). ELISA and xMAP MAGPIX assays each have a ULQ of ~100 pM, respectively.33,34
Figure 5.
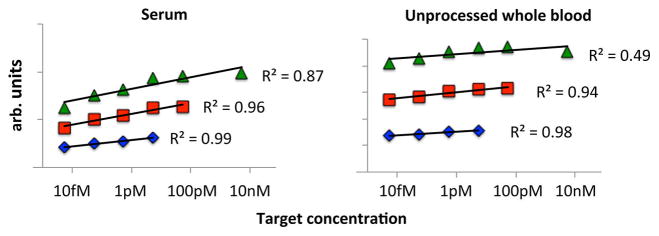
The upper limit of quantitation (ULQ), defined at where the linear correlation between signal and concentration becomes less than R2 = 0.90, was determined to be 100 pM for both serum and unprocessed whole blood samples. The y axis values are the log of the signal (AuNPs per square millimeter) at each concentration and scaled to see each individual regression line.
Quantification of Allergen-Specific IgE in Characterized Serum and Whole Blood Using IRIS Nanoparticle Counting
The multiplexing capability and clinical applicability of IRIS nanoparticle counting was determined by detecting allergen-specific IgE in 50 μL characterized patient serum and unprocessed whole blood against a panel of 8 purified major allergens immobilized in quadruplets. Fluorescence detection of specific IgE in serum was used as a control to validate IRIS nanoparticle detection of specific IgE in serum and whole blood. The average and standard deviation (N = 4) of fluorescence and nanoparticle counting measurements were confirmed with Phadia ImmunoCAP (Figure 6). The nanoparticle counting measurements were correlated to the fluorescence results to validate the assay ( ). The standard deviations of the fluorescence measurements were larger than the standard deviations of the nanoparticle counting measurements in serum and unprocessed whole blood. This is a direct result of the ability to detect discrete binding events on immobilized probes; spot-to-spot morphology inconsistencies, which are notoriously present in protein microarrays, were averaged in the fluorescence measurement and contributed to larger deviation. Although the fluorescence and nanoparticle counting measurements detected minimal IgE bound to Bet v 1 (birch), the ImmunoCAP reports slight elevated levels of specific IgE (specific IgE fluorescence: 16 ± 11 SNR, nanoparticle counting: 4 ± 7 AuNPs/mm2, ImmunoCAP: 0.69 kU/L). This low signal is most likely due to low immobilization of Bet v 1 probes that have been quantified by the IRIS biomass measurement on the sensor surface.38 Furthermore, measurement of IgE to Ara h 2 (peanut) and Bet v 1 on the whole blood chip was not reported due to spotting inconsistencies (Figure S5 of the Supporting Information). The ability to quantify the immobilization density of each spot in the array highlights the need of an instrument to be capable of quantitative assessment to guarantee reliable, accurate test results and has been demonstrated elsewhere.38 Overall, IRIS data corresponds well to the ImmunoCAP. This is one example where the two modalities of IRIS can complement each other to improve general assay performance. These results demonstrate the ability of IRIS to perform multiplexed testing at attomolar sensitivity in unprocessed, finger-prick volumes of whole blood.
Figure 6.
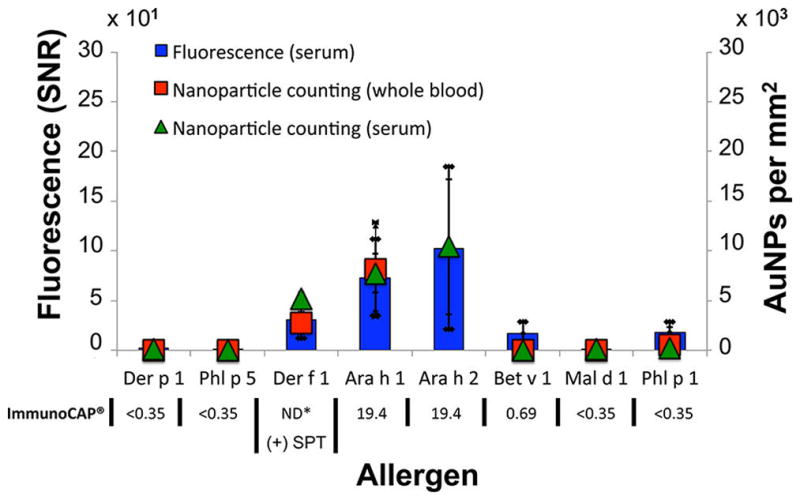
Multiplexed assay to detect specific IgE to eight allergens. Fluorescence measurement was used as a control to validate nanoparticle counting detection (R2 = 0.97 for serum both and whole blood samples). Human sample was characterized with Phadia ImmunoCAP or skin prick testing (SPT): (+) reflects a positive result. Error bars correspond to the standard deviation from the mean (n = 4). The * indicates that the results were not determined.
CONCLUSIONS
We have demonstrated highly sensitive, multiplexed biomarker detection over a large dynamic range in unprocessed biological samples with IRIS, a simple instrument with potentially broad clinical impact, by implementing the advantages of nanoparticle tagging, single nanoparticle discrimination, and a large surface area, robust sensor. As proof of concept, β-lactoglobulin, a cow’s milk whey protein, was detected against negative controls at a detection limit of ~60 aM in serum and ~500 aM in whole blood. The upper limit was calculated to be ~100 pM. This sensitivity and dynamic range in biological media with no sample preparation are direct results of the ability of IRIS to (i) eliminate all nanoparticles not specific to the assay and (ii) detect single nanoparticles over a large sensor surface. Furthermore, multiplexing capability and clinical applicability were demonstrated by using finger-prick volumes of characterized patient serum and whole blood samples. Currently, IRIS requires no time for sample preparation and 3 h for assay time, which may potentially be reduced with the incorporation of microfluidics.43 The elimination of sample preparation would reduce total assay time by 1 h and permit the test to be performed outside of laboratory environments and therefore improve the utility of the system. The use of LEDs, simple optics, and inexpensive substrates to quantify multiple targets in complex samples establish IRIS as a promising platform for diverse clinical purposes.
MATERIALS AND METHODS
Reagents and Equipment
Bovine serum albumin (BSA), β-lactoglobulin, Tween 20, high purity poly(ethylene glycol-8K) (PEG), ethylenediaminetetraacetic acid (EDTA), and PBS tablets were purchased from Sigma (St. Louis, MO). Rabbit anti-β-lactoglobulin was purchased from Bethyl Laboratories (Montgomery, TX). Carboxylated gold nanoparticles (AuNPs; 40 nm) were purchased from Cytodiagnostics (Ontario, Canada). MES buffered saline packs, EDC [1-ethyl-3-(3-dimethylaminopropyl)carbodiimide Hydrochloride], and sulfo-NHS (N-hydroxysulfosuccinimide) were purchased from Thermo Fisher Scientific (Rockford, Illinois). Copoly(DMA-NAS-MAPS)44 was purchased from Lucidant polymers. The Bio-Rad Calligrapher (Bio-Rad Laboratories, Inc.) was used for protein printing on chips. Anti-IgE was purchased from BDBioscences. Allergens Der p 1, Phl p 1, Ara h 1, Ara h 2, Bet v 1, Mal d 1, and Phl p 1 were purchased from Indoor Biotechnologies Ltd. (Warminster, U.K.). The Cy3 labeling kit was purchased from GE Healthcare.
Si–SiO2 Chip Fabrication
Silicon chip fabrication is described elsewhere.39 Briefly, chips consisting of a bare silicon reference region, an oxide of 500 nm, and an oxide of 100 nm were used for optimized IRIS biomass measurement (500 nm) and single particle counting (100 nm). Each oxide spacer was engineered and optimized to a specific thickness in order to maximize the contrast for both biomass measurement (500 nm) and nanoparticle counting (100 nm) on the Si–SiO2 substrate.24,29
Surface Functionalization
The surface of the silicon chip was functionalized with copoly(DMA-NAS-MAPS)44 due to the feasibility and reproducibility of its synthesis, coating process, and antifouling properties. This particular polymeric coating does not affect the optical properties of the system. Si–SiO2 slides were immersed for 30 min in a solution of the polymer at 1% w/v concentration in a solution of deionized water and 20% saturated ammonium sulfate. Slides were washed with water for 5 min and dried in vacuum at 80 °C for 15 min.
Optical Detection
Two modalities of IRIS were employed in this work. The differences between the two IRIS modalities (total biomass measurement vs single nanoparticle counting) are (i) the magnification of the optical imaging system, (ii) the oxide spacer (500 nm vs 100 nm) on the Si substrate, and (iii) the forward models used to interpret the response detected by the CCD camera. The first modality measures biomass accumulation in microarray format on the surface and is described thoroughly elsewhere.24 Briefly, four discrete LEDs sequentially illuminate the sensor surface through a low magnification objective. The light reflected from the Si–SiO2 substrate creates an interference signature, and the intensity images are recorded onto a CCD camera. The data from each of the pixels of the camera are processed with custom software to quantify the optical thickness between the two reflecting surfaces and then converted into a height image over the entire field of view. As biomass accumulates on the sensor’s surface, the optical thickness increases and is quantified. The second modality of IRIS uses one discrete LED wavelength (525 nm) to illuminate the sensor’s surface using a high magnification objective (50×, 0.8 NA) to detect, count, and size nanoparticles of known material located on the SiO2 surface and is thoroughly described elsewhere.26,29 Briefly, this modality of IRIS enhances the contrast of a single nanoparticle on a bilayered substrate by interfering the scattered field produced by the nanoparticle on the substrate surface with the reflected field generated by the buried Si–SiO2 interface of the IRIS chip. The CCD camera senses the individual nanoparticles on the IRIS chip as point objects, which are processed via custom software to extract size information.
The optical setups of each modality of IRIS are detailed in Figure S2 of the Supporting Information.
AuNP Functionalization of Secondary Detection Antibody, Anti-β-Lactoglobulin
To functionalize the AuNPs to the detection antibody, the purchased carboxylated 40 nm AuNPs were diluted to a solution containing ~1010 particles/mL. The particles were then incubated in 2:1 EDC/NHS in 0.1 M MES buffer (pH 6) for 30 min. The particles were then spun down, the supernatant was removed, and the particles were exposed overnight to the detection antibody at 10 μg/mL in PBS buffer. The functionalized particles were then washed with 1% BSA w/v in PBS, 0.02% Tween in PBS, and stored in 0.1% BSA w/v, 0.1% w/v PEG in PBS.
Verification of AuNP Size after Functionalization of Secondary Detection Antibody
The diameters of the carboxylated AuNPs pre- and post- anti-β-lactoglobulin functionalization were verified with Dynamic Light Scattering (DLS) technology manufactured by Malvern Instruments Ltd. DLS reported the carboxylated AuNPs to be 51 nm in diameter prior to antibody functionalization and 54 nm after antibody functionalization. To discriminate AuNPs against particulates in the IRIS images, only 53 ± 10 nm AuNPs were quantified as labeled secondary antibodies to their target.
Protein Immobilization on Chip
Dilution in Serum and Whole Blood Protein Immobilization
Twenty IRIS chips were functionalized with the polymeric coating. Ten chips were printed with 8 replicates of anti-β-lactoglobulin (positive control) and BSA (negative control) at 1 mg/mL and stored overnight at room temperature in a humid environment and used for testing undiluted serum. The remaining 10 chips were printed with 4 replicates of anti-β-lactoglobulin (positive control) and BSA (negative control) at 1 mg/mL and stored overnight at room temperature in a humid environment and used for testing whole blood. The chips were then washed 3 times each for 5 min in PBST and PBS buffers, rinsed with DI water, and dried with a stream of argon gas. Probe immobilization was then quantified with the IRIS biomass measurement.
Multiplexed Allergen Immobilization
Three chips were functionalized with the polymeric coating. The chips were printed with 4 replicates of 8 allergens, Der p 1, Phl p 1, Ara h 1, Ara h 2, Bet v 1, Mal d 1, and Phl p 1, at 1 mg/mL and stored overnight at room temperature in a humid environment. The chips were then washed 3 times each for 5 min in PBST and PBS buffers, rinsed with DI water, and dried with a stream of argon gas. Probe immobilization was then quantified with the IRIS biomass measurement.
Assay to Detect β-lactoglobulin Targets Spiked in Undiluted Serum or Unprocessed Whole Blood
After quantification of probe immobilization density, each chip was incubated in 1 mL volume of undiluted serum or unprocessed whole blood spiked with β-lactoglobulin target antigen at 5.4 fM (0.1 pg/mL), 54 fM (1 pg/mL), 540 fM (10 pg/mL), 5.4 pM (100 pg/mL), 54 pM (1 ng/mL), 5.4 nM (100 ng/mL), and 54 nM (1 μg/mL) for 2 h. Three chips were incubated in pure undiluted serum as blanks to quantify any unspecific particle binding as background noise or false detection. Chips were then washed with PBST buffer for 10 min (5 mM of EDTA was added for whole blood samples), rinsed in water, and dried with a stream of argon gas. IRIS biomass measurements were then taken to observe any changes in mass accumulation on chip. The chips were then incubated in ~108 functionalized AuNPs/mL in 5% w/v BSA/PBS for 1 h, washed in PBS for 10 min, rinsed in water, and dried with a stream of argon gas. The chips were finally scanned with the IRIS single particle modality to quantify bound AuNPs.
Assay to Detect Allergen-Specific IgE in Characterized Patient Serum and Whole Blood
Specific IgE to relevant allergens was quantified by ImmunoCAP (Phadia) on patient serum. After quantification of probe immobilization density, 2 chips were incubated in 50 μL of serum and 1 chip was incubated with whole blood anticoagulated with EDTA for 2 h. Chips were then washed with PBST buffer for 10 min (5 mM of EDTA was added for whole blood samples), rinsed in water, and dried with a stream of argon gas. One chip incubated with serum and the chip incubated in whole blood were then incubated in ~108 anti-IgE-functionalized AuNPs/mL in 5% w/v BSA/PBS for 1 h. The third chip was incubated in Cy3-anti-IgE (1 ng/mL) for 1 h. The 3 chips were then washed in PBS for 10 min, rinsed in water, and dried with a stream of argon gas. The chips were finally scanned with the IRIS single particle modality to quantify bound AuNPs.
Elimination Processes to Ensure Accurate Detection of AuNPs with IRIS
IRIS nanoparticle counting software incorporates 3 elimination processes to ensure that point objects detected in the image are AuNP-functionalized secondary antibodies. First, anomaly filtering disregards any irregular points caused by the morphology of the protein spot. Second, a point spread function (PSF) filter disregards any particles on the surface that do not exhibit the expected profile of the AuNPs; the profile of a AuNP takes the form of the point spread function of the optical system that is known in advance. PSF filtering is crucial: spot morphologies often contain particulates that may be misconstrued as false positives; thus, it is important to utilize the expected PSF profile to ensure accurate AuNP detection. Third, the size-discrimination feature of the IRIS nanoparticle counting eliminates any particulates outside of the size regime of the introduced AuNPs.
Determination of the Limit of Detection (LOD)
The LOD of the IRIS platform, in accordance with all measurements acquired with the single nanoparticle counting modality, is defined as the LOD per square millimeter in serum and whole blood. Three chips incubated in blank serum or blank whole blood were grouped as a single experiment to yield 24 tests for serum (8 spots per chip) or 12 tests for whole blood (4 spots per chip). The background signal (AuNPs per spot) of the tests on the blank chips follows a normal distribution (Figure S6 of the Supporting Information); therefore, we can combine the 3 chips as a single experiment. We measured each test, or spot consisting of immobilized probes, to be a sensor area consisting of 0.0855 mm2. The numbers of detected AuNPs on each test were taken in combinations from 1 (0.0855 mm2) to 9 (0.7695 mm2) spots to study the effect of increasing effective sensor size on the LOD per square millimeter. Because the whole blood chips consisted of less spots, combinations from 1 to 6 spots were taken. The average of the AuNPs per square millimeter plus 3 times the standard deviation was determined as the background signal (AuNPs per square millimter) for the defined sensor area. Note, the average always stays constant; however, the standard deviation changes with the sensor size, n, by a factor of n−0.5. Thus, the data was fitted with y = A*n̂ − 0.5 + B, using linear regression and 95% confidence bounds to determine the dependence of the background signal on the sensor area (Figure S4a of the Supporting Information). The background signal was then used to extrapolate a target concentration using the linear regression described by the log–log plot of AuNPs per square millimeter versus target concentration (Figure S4b of the Supporting Information).
Determination of the Lower and Upper Limits of Quantitation
A number of different “detection limits” may be used to characterize the minimum and highest concentration reliably measured by an analytical procedure. Typically, the LOD is calculated to report the minimum concentration of the analyte that can be detected with less than 1% false positive error. The lower limit of quantification (LLQ) and the upper limit of quantification (ULQ) are calculated when higher degrees of confidence are desired, such as in commercialized clinical assays. The LLQ was calculated as described in the Determination of the Limit of Detection methods section; however, while the LOD was calculated using 3 times the standard deviation from the mean, the LLQ was calculated using 10 times the standard deviation from the mean.
The ULQ was defined as the target concentration at which linear regression of the dilution curve became less than R2 = 0.90 for (i) serum and (ii) unprocessed whole blood samples. Target concentrations from 5.4 fM to 5 nM were fit over 4, 5, and 7 orders of magnitude (Figure 5) for serum and unprocessed whole blood samples to determine when the linear correlation between the signal and target concentrations fell below R2 = 0.90.
Supplementary Material
Acknowledgments
Financial support from the Wallace H. Coulter Foundation 2010 Coulter Translational Award, by the SmartLighting ERC funded via the NSF under Cooperative Agreement EEC-0812056, and by the National Institute of Health under Grant R21EB015900. Acknowledgement also goes to the Center for integration of Medicine and Innovative Technology (CIMIT) and Ahmet Tuysuzoglu for the development of the IRIS single particle detection software.
Footnotes
The authors declare no competing financial interest.
ASSOCIATED CONTENT
Additional information as noted in text.
This material is available free of charge via the Internet at http://pubs.acs.org.
References
- 1.Gubala V, Harris L, Ricco A, Tan M, Williams D. Anal Chem. 2012;84:487–515. doi: 10.1021/ac2030199. [DOI] [PubMed] [Google Scholar]
- 2.Jemal A, Clegg LX, Ward E, Ries LA, Wu X, Jamison PM, Wingo PA, Howe HL, Anderson RN, Edwards BK. Cancer. 2004;101:27. [Google Scholar]
- 3.Gruchalla RS, Pongracic J, Plaut M, Evans R, Visness CM, Walter M, Crain EF, Kattan M, Morgan WJ, Steinbach S, Stout J, Malindzak G, Smartt E, Mitchell H. J Allergy Clin Immunol. 2005;115:478–485. doi: 10.1016/j.jaci.2004.12.006. [DOI] [PubMed] [Google Scholar]
- 4.Morgan WJ, Crain EF, Gruchalla RS, O’Connor GT, Kattan M, Evans RI, Stout J, Malindzak G, Smartt E, Plaut M, Walter M, Vaughn B, Mitchell H, Grp ICAS. N Engl J Med. 2004;351:1068–1080. doi: 10.1056/NEJMoa032097. [DOI] [PubMed] [Google Scholar]
- 5.Rusling J, Kumar C, Gutkind J, Patel V. Analyst. 2010;135:2496–2511. doi: 10.1039/c0an00204f. [DOI] [PMC free article] [PubMed] [Google Scholar]
- 6.Ebert M, Korc M, Malfertheiner P, Rocken C. J Proteome Res. 2006;5:19–25. doi: 10.1021/pr050271e. [DOI] [PubMed] [Google Scholar]
- 7.Tothill I. Semin Cell Dev Biol. 2009;20:55–62. doi: 10.1016/j.semcdb.2009.01.015. [DOI] [PubMed] [Google Scholar]
- 8.Yager P, Domingo G, Gerdes J. Annu Rev Biomed Eng. 2008;10:107–144. doi: 10.1146/annurev.bioeng.10.061807.160524. [DOI] [PubMed] [Google Scholar]
- 9.Giljohann D, Mirkin C. Nature. 2009;462:461–464. doi: 10.1038/nature08605. [DOI] [PMC free article] [PubMed] [Google Scholar]
- 10.Li R, Wu D, Li H, Xu C, Wang H, Zhao Y, Cai Y, Wei Q, Du B. Anal Biochem. 2011;414:196–201. doi: 10.1016/j.ab.2011.03.019. [DOI] [PubMed] [Google Scholar]
- 11.Wu S, Lan X, Huang F, Luo Z, Ju H, Meng C, Duan C. Biosens Bioelectron. 2012;32:293–296. doi: 10.1016/j.bios.2011.12.006. [DOI] [PubMed] [Google Scholar]
- 12.Lee J, Choi Y, Lee Y, Lee H, Lee J, Kim S, Han K, Cho E, Park J, Lee S. Anal Chem. 2011;83:8629–8635. doi: 10.1021/ac2020849. [DOI] [PubMed] [Google Scholar]
- 13.Craighead H. Science. 2000;290:1532–1535. doi: 10.1126/science.290.5496.1532. [DOI] [PubMed] [Google Scholar]
- 14.Chen J, Wang C, Irudayaraj J. J Biomed Opt. 2009:14. doi: 10.1117/1.3183789. [DOI] [PubMed] [Google Scholar]
- 15.Stoeva S, Lee J, Smith J, Rosen S, Mirkin C. J Am Chem Soc. 2006;128:8378–8379. doi: 10.1021/ja0613106. [DOI] [PubMed] [Google Scholar]
- 16.Cheng M, Cuda G, Bunimovich Y, Gaspari M, Heath J, Hill H, Mirkin C, Nijdam A, Terracciano R, Thundat T, Ferrari M. Curr Opin Chem Biol. 2006;10:11–19. doi: 10.1016/j.cbpa.2006.01.006. [DOI] [PubMed] [Google Scholar]
- 17.Jarvius J, Melin J, Goransson J, Stenberg J, Fredriksson S, Gonzalez-Rey C, Bertilsson S, Nilsson M. Nat Methods. 2006;3:725–727. doi: 10.1038/nmeth916. [DOI] [PubMed] [Google Scholar]
- 18.Rissin D, Kan C, Campbell T, Howes S, Fournier D, Song L, Piech T, Patel P, Chang L, Rivnak A, Ferrell E, Randall J, Provuncher G, Walt D, Duffy D. Nat Biotechnol. 2010;28:595–U25. doi: 10.1038/nbt.1641. [DOI] [PMC free article] [PubMed] [Google Scholar]
- 19.Resch-Genger U, Grabolle M, Cavaliere-Jaricot S, Nitschke R, Nann T. Nat Methods. 2008;5:763–775. doi: 10.1038/nmeth.1248. [DOI] [PubMed] [Google Scholar]
- 20.Wadkins RM, Ligler FS. Immunobiosensors Based on Evanescent Wave Excitation. In: Rogers KR, Mulchandani A, editors. Affinity Biosensors: Techniques and Protocols. Vol. 7. Humana Press Inc; Totowa, NJ: 1998. pp. 77–87. [Google Scholar]
- 21.Mulvaney S. Nat Nanotechnol. 2011;6:266–267. doi: 10.1038/nnano.2011.67. [DOI] [PubMed] [Google Scholar]
- 22.Mulvaney S, Myers K, Sheehan P, Whitman L. Biosens Bioelectron. 2009;24:1109–1115. doi: 10.1016/j.bios.2008.06.010. [DOI] [PubMed] [Google Scholar]
- 23.Stern E, Vacic A, Rajan N, Criscione J, Park J, Ilic B, Mooney D, Reed M, Fahmy T. Nat Nanotechnol. 2010;5:138–142. doi: 10.1038/nnano.2009.353. [DOI] [PMC free article] [PubMed] [Google Scholar]
- 24.Daaboul G, Vedula R, Ahn S, Lopez C, Reddington A, Ozkumur E, Unlu M. Biosens Bioelectron. 2011;26:2221–2227. doi: 10.1016/j.bios.2010.09.038. [DOI] [PubMed] [Google Scholar]
- 25.Ozkumur E, Yalcin A, Cretich M, Lopez CA, Bergstein DA, Goldberg BB, Chiari M, Unlu MS. Biosens Bioelectron. 2009;25:167–172. doi: 10.1016/j.bios.2009.06.033. [DOI] [PMC free article] [PubMed] [Google Scholar]
- 26.Daaboul GG, Yurt A, Zhang X, Hwang GM, Goldberg BB, Unlu MS. Nano Lett. 2010;10:4727–4731. doi: 10.1021/nl103210p. [DOI] [PubMed] [Google Scholar]
- 27.Armani D, Kippenberg T, Spillane S, Vahala K. Nature. 2003;421:925–928. doi: 10.1038/nature01371. [DOI] [PubMed] [Google Scholar]
- 28.Lu T, Lee H, Chen T, Herchak S, Kim J, Fraser S, Flagan R, Vahala K. Proc Natl Acad Sci USA. 2011;108:5976–5979. doi: 10.1073/pnas.1017962108. [DOI] [PMC free article] [PubMed] [Google Scholar]
- 29.Yurt A, Daaboul G, Connor J, Goldberg B, Unlu M. Nanoscale. 2012;4:715–726. doi: 10.1039/c2nr11562j. [DOI] [PMC free article] [PubMed] [Google Scholar]
- 30.Zeldin DC, Arbes SJ, Gergen PJ, Elliott L. J Allergy Clin Immunol. 2005;116:377–383. doi: 10.1016/j.jaci.2005.05.017. [DOI] [PubMed] [Google Scholar]
- 31.World Health Organization. Global Surveillance, Prevention and Control of Chronic Respiratory Diseases: A Comprehensive Approach. 2007. [Google Scholar]
- 32.Global Industry Analysts. Food Allergy and Intolerance Products: A Global Strategic Business Report. 2012. [Google Scholar]
- 33.Chowdhury F, Williams A, Johnson P. J Immunol Methods. 2009;340:55–64. doi: 10.1016/j.jim.2008.10.002. [DOI] [PubMed] [Google Scholar]
- 34.duPont N, Wang K, Wadhwa P, Culhane J, Nelson E. J Reprod Immunol. 2005;66:175–191. doi: 10.1016/j.jri.2005.03.005. [DOI] [PMC free article] [PubMed] [Google Scholar]
- 35.Daaboul GG, Lopez CA, Yurt A, Goldberg B, Connor JH, Unlu MS. IEEE J Sel Top Quantum Electron. 2011;18:1422–1433. [Google Scholar]
- 36.Schabacker DS, Stefanovska I, Gavin I, Pedrak C, Chandler DP. Anal Biochem. 2006;359:84–93. doi: 10.1016/j.ab.2006.08.035. [DOI] [PubMed] [Google Scholar]
- 37.Wang XJ, Hessner MJ, Wu Y, Pati N, Ghosh S. Bioinformatics. 2003;19:1341–1347. doi: 10.1093/bioinformatics/btg154. [DOI] [PubMed] [Google Scholar]
- 38.Monroe M, Reddington A, Collins A, LaBoda C, Cretich M, Chiari M, Little F, Unlu M. Anal Chem. 2011;83:9485–9491. doi: 10.1021/ac202212k. [DOI] [PMC free article] [PubMed] [Google Scholar]
- 39.Cretich M, Reddington A, Monroe M, Bagnati M, Damin F, Sola L, Unlu M, Chiari M. Biosens Bioelectron. 2011;26:3938–3943. doi: 10.1016/j.bios.2011.03.016. [DOI] [PMC free article] [PubMed] [Google Scholar]
- 40.Krishnan S, Mani V, Wasalathanthri D, Kumar C, Rusling J. Angew Chem, Int Ed. 2011;50:1175–1178. doi: 10.1002/anie.201005607. [DOI] [PMC free article] [PubMed] [Google Scholar]
- 41.Sim H, Wark A, Lee H. Analyst. 2010;135:2528–2532. doi: 10.1039/c0an00457j. [DOI] [PubMed] [Google Scholar]
- 42.Sheehan P, Whitman L. Nano Lett. 2005;5:803–807. doi: 10.1021/nl050298x. [DOI] [PubMed] [Google Scholar]
- 43.Gorris H, Walt D. Angew Chem, Int Ed. 2010;49:3880–3895. doi: 10.1002/anie.200906417. [DOI] [PubMed] [Google Scholar]
- 44.Cretich M, Pirri G, Damin F, Solinas I, Chiari M. Anal Biochem. 2004;332:67–74. doi: 10.1016/j.ab.2004.05.041. [DOI] [PubMed] [Google Scholar]
Associated Data
This section collects any data citations, data availability statements, or supplementary materials included in this article.