

Abstract
The development of various neuroimaging techniques is rapidly improving the measurements of brain function/structure. However, despite improvements in individual modalities, it is becoming increasingly clear that the most effective research approaches will utilize multi-modal fusion, which takes advantage of the fact that each modality provides a limited view of the brain. The goal of multimodal fusion is to capitalize on the strength of each modality in a joint analysis, rather than a separate analysis of each. This is a more complicated endeavor that must be approached more carefully and efficient methods should be developed to draw generalized and valid conclusions from high dimensional data with a limited number of subjects. Numerous research efforts have been reported in the field based on various statistical approaches, e.g. independent component analysis (ICA), canonical correlation analysis (CCA) and partial least squares (PLS). In this review paper, we survey a number of multivariate methods appearing in previous reports, which are performed with or without prior information and may have utility for identifying potential brain illness biomarkers. We also discuss the possible strengths and limitations of each method, and review their applications to brain imaging data.
Keywords: multivariate methods, multimodal fusion, data-driven, ICA, CCA, PLS, MRI, DTI, EEG
I. INTRODUCTION
Recently, collecting multiple types of brain data from the same individual using various non-invasive imaging techniques (MRI, DTI, EEG, MEG, etc.) has become common practice. Each imaging technique provides a different view of brain function or structure. For example, functional magnetic resonance imaging (fMRI) measures the hemodynamic response related to neural activity in the brain dynamically; structural MRI (sMRI) provides information about the tissue type of the brain [gray matter (GM), white matter (WM), cerebrospinal fluid (CSF)]. Diffusion tensor imaging (DTI) can additionally provide information on structural connectivity among brain networks. Another useful measure of brain function is electroencephalography (EEG), which measures brain electrical activity with higher temporal resolution than fMRI (and lower spatial resolution). Typically these data are analyzed separately; however separate analyses do not enable the examination of the joint information between the modalities.
By contrast, combining modalities may uncover previously hidden relationships that can unify disparate findings in brain imaging [1,2]. For example, the spatial precision of fMRI could be complemented with the temporal precision of EEG to provide unprecedented spatiotemporal accuracy [3]. The combined analysis of fMRI and magnetoencephalography (MEG) measurements can lead to improvement in the description of the dynamic and spatial properties of brain activity [4]. In another case, using combined genetic and fMRI data achieved better classification accuracy than using either alone, indicating that genetic and brain function representing different, but partially complementary aspects [5]. Finally, a lower and different function-structure linkage is often found in patients with brain disorder such as schizophrenia [6,7], suggesting that combination of two brain modalities provides more comprehensive descriptions of altered brain connectivity. Therefore, a key motivation for jointly analyzing multimodal data is to take maximal advantage of the cross-information of the existing data, and thus may discover the potentially important variations which are only partially detected by each modality.
Approaches for combining or fusing data in brain imaging can be conceptualized as having a place on an analytic spectrum with meta-analysis (highly distilled data) to examine convergent evidence at one end and large-scale computational modeling (highly detailed theoretical modeling) at the other end [8]. In between are methods that attempt to perform direct data fusion [9].
We note that there is an alternative approach—which we call data integration, which we distinguish from “data fusion”. One example is using the results from one modality to constrain models of the other, —as EEG [10,11] or DTI [12,13] being constrained by fMRI or sMRI data, or vice versa [14,15]. While these are powerful techniques, a limitation is that they may impose potentially unrealistic assumptions upon the constrained data, which are fundamentally of a different nature than the known modality. Another integration example is to analyze each data type separately and overlay them—thereby not allowing for any direct interaction between the data types. For example, a data integration approach would not detect a change in fMRI activation maps that is related to a change in brain structure in a remote region.
By contrast, multimodal fusion refers to the use of a common forward model of neuronal activity that explains different sorts of data [16]. This is a more complicated endeavor, especially when studying complex mental illnesses like schizophrenia that impact many brain circuits, also in real world, the conclusions usually need to be drawn out of high dimensional brain imaging data from a limited number of subjects. Hence efficient methods should be developed carefully.
Multivariate approaches for combing brain imaging data can be divided into two classes: hypotheses driven and data driven. Hypotheses-driven approaches such as multiple linear regression and confirmatory structural equation modeling, have the advantages of: 1) allowing testing of specific hypotheses about brain networks implicated in the experimental paradigm; 2) allowing simultaneous assessment of several connectivity links, which would have been compromised by the one-by-one assessment of covariance [17]. However, when using these approaches, it is possible to miss important connectivity links that were not included in the a priori hypotheses and they do not provide information about inter-voxel relationships [18,19].
Data-driven approaches include, but are not limited to, principal component analysis (PCA), independent component analysis (ICA) and canonical correlation analysis (CCA). These methods are attractive as they do not require a priori hypotheses about the connection of interest. Hence, these methods are attractive for the exploration of the full body of data. However, some methods may be more demanding from a computational standpoint. Partial least squares (PLS) is a hybrid which incorporates both hypotheses and data exploration, see details in section II. We next review several multivariate multimodal fusion methods including their statistical assumption, possible strengths and limitations, and illustrate the analysis strategies for the 7 models presented in Figure 1.
Figure 1.

The conceptual diagrams of 7 blind and semi-blind data-driven methods for multimodal fusion.
II. MULTIVARIATE METHOD REVIEW
The multivariate approaches adopted in multimodal MRI fusion can be further divided into four classes based on their use of the prior information and the dimension of the used MRI data:
blind methods that use second-level fMRI data (3D contrast image) or structural features (e.g. gray matter or fractional anisotropy (FA) maps), including joint ICA (jICA) [20,21], multimodal canonical correlation analysis (mCCA) [22] and linked ICA [23].
blind methods that can use raw fMRI data (4D data), including partial least squares (PLS) [24] and multiset CCA [25].
semi-blind methods that use second-level fMRI data (3D contrast), e.g., parallel ICA [26], coefficient-constrained ICA (CC-ICA) [27], PCA with reference (PCA-R) [28,29] and informed multimodal PLS [30].
Other multimodal fusion applications using fMRI data, include multiple linear regression [31,32], structural equation modeling (SEM) [33] or dynamic causal modeling (DCM) [34].
Before introducing the statistical approaches, we’d like to clarify the use of “feature” as input to most of the above mentioned models. We note that this definition of “feature” is somewhat different than what is used in traditional machine learning algorithms [54]. Basically, a “feature” is a distilled dataset representing an interesting part of each modality [9] and it contributes as an input vector for each modality and each subject. Usually the brain imaging data are high dimensional, in order to reduce the redundancy and facilitate the identification of relationships between modalities, the raw data can be preprocessed to generate a second-level output, that is “feature”, which can be a contrast map calculated from task-related fMRI by the general linear model (GLM), a component image such as the “default mode” resulting from a first-level ICA, an FA map from DTI data, or a stimulus averaged channel or channels from raw EEG signals. The main reason to use features is to provide a simpler space in which to link the data. The trade-off is that some information may be lost; however, there is considerable evidence that the use of features is quite useful and valid. For example, in a recent PNAS paper [55], which used ICA on rest data and on task blobs (contrasts), they found nearly identical resting fMRI patterns from task blobs (even further distilled data), motivating the use of features. Figure 1 depicts the analysis strategies of 7 of the above mentioned multivariate models, including 5 blind and 2 semi-blind approaches, which provide a direct view of the current popular fusion methods. All of them are based on the assumption that the changes in one data type (e.g. gray matter) are related to another one, such as functional activation. We also provide a summary of modal combinations which have been studied by the various published methods, listed in Table 1.
Table 1.
Multivariate methods that have been applied to multimodal fusion of brain imaging data
| Multivariate Method | Data | Studies |
|---|---|---|
| Joint ICA | fMRI-sMRI(GM) | [1],[35],[36] |
| fMRI-EEG | [37],[38],[39] | |
| fMRI-DTI(FA) | [40], [41] | |
| GM-WM | [42] | |
|
| ||
| Multimodal CCA | fMRI-EEG | [25],[43] |
| fMRI-sMRI(GM) | [44] | |
|
| ||
| Partial Least Squares | fMRI-EEG | [45], [24] |
| PET-sMRI (GM) | [30] | |
|
| ||
| Linked ICA | GM-DTI(FA/MD/TO) | [23] |
|
| ||
| Parallel ICA | FMRI-EEG | [46],[47] |
| FMRI-Gene(SNP) | [26],[48] | |
| GM-Gene(SNP) | [49], [50] | |
|
| ||
| CC-ICA, PCA-R | Multitask fMRI | [51], [52] can be applied to multimodal combinations similar to jICA |
|
| ||
| Others | fMRI-EEG | [31], [33],[34] [45],[3,32] |
| fMRI-MEG | [4],[2] | |
| EEG-MEG | [53] | |
Joint ICA
Joint ICA (jICA) is a second-level fMRI analysis method that assumes two or more features (modalities) share the same mixing matrix and maximizes the independence among joint components [1]. This is a straightforward yet effective method that performs ICA on the horizontally concatenated features (along voxels and/or time points in the case of ERP). It is suitable for examining a common modulation across subjects among modalities. Joint ICA is feasible for many paired combinations of features, such as fMRI, EEG, sMRI and DTI, or 3-way data fusion [37,38,40–42]. For MR images, in order to control intensity differences based on scanner, template and population variations, each feature matrix (dimension: number of subject by number of voxel) is usually normalized to a study specific template.
Figure 2 gives a fusion example of EEG and fMRI data collected from 23 healthy controls and 18 chronic schizophrenia patients [9,39], during the performance of an auditory oddball task [56]. One joint component was found to distinguish patients and controls using a two-sample t-test (p<0.0001) on patient and control loading parameters. This identified component showed a clear difference in fMRI at bilateral frontotemporal regions (Figure 2B) and in the event-related potentials (ERP) during the N2-P3 latency range (Figure 2A, ERPs are labeled based on their ordinal position following the stimulus onset, e.g., P3 for the third positive peak or N2 for the second negative peak). Both the hemodynamic and electrophysiologic phenomena that were jointly expressed in this source have been previously implicated in schizophrenia, but there had not previously been a study which showed that the changes in these two modalities were linked. Figure 3 reveals a set of linked gray and white matter regions that have a significant difference between schizophrenia and healthy controls by use of joint source-based morphometry (jSBM) [57]. For joint source 3, more gray and white matter were detected in patients affecting multiple brain lobes, reflecting the widespread nature of the disease and consistent with previous findings [58]. For joint source 4, the larger thalamic white matter concentrations were shown in schizophrenia; it also suggests that gray matter difference in the parietal and frontal lobe are linked to white matter difference in thalamus which is consistent with the role of the thalamus as a relay station.
Figure 2.

An example result of EEG/fMRI jICAfrom [9,39] (A, B). Joint component which showed significantly different loading parameters (p < 0.0001) for patients versus controls: (A) control (yellow) and patient (blue) average EEG plots along with the ERP part of the identified joint component (pink). (B) thresholded fMRI part of the joint component showing bilateral temporal and frontal lobe regions..(C) An example result of GM/WM jICA from [57]. Joint source 3 and 4 discovered by jSBM thresholded at |z| > 3. left: GM difference; middle: loading parameters of the joint sources. right: WM difference. red blob: regions within joint source 3; yellow blob: regions within joint source 4; orange blob: regions within both joint source 3 & 4.
Figure 3.

FMRI/EEG mCCAfrom [44]: Three pairs of fMRI and ERP components that are significantly different between patients and controls show associations of the temporal and motor areas with the N2 and P3 peaks. The fMRI maps are scaled to Z values and thresholded at |Z|>=3.
Multimodal CCA
Multimodal CCA allows a different mixing matrix for each modality and is used to find a transformed coordinate system that maximizes inter-subject covariation across the two data sets [44]. This method decomposes each dataset into a set of components (such as spatial areas for fMRI/sMRI or temporal segments for EEG) and their corresponding mixing profile, called canonical variates (CVs). The CVs have varying levels of activations for different subjects and are linked if they modulate similarly across subjects. After decomposition, the CVs correlate to each other only on the same indices and their corresponding correlation values are called canonical correlation coefficients (CCCs). Compared to jICA that constrains two (or more) features to have the same mixing matrix, mCCA is flexible in that it allows common as well as distinct level of connection between two features, as shown in Figure 3, but the associated source maps may not be spatially sparse, especially when the CCC are not sufficiently distinct [43,59].
Figure 3 is an application result of multimodal CCA to 16 schizophrenia and 23 controls performing an auditory oddball task [44]. A number of interesting associations are identified by mCCA, three of which have subjects’ loadings that are significantly different between groups. The first pair of components, having a correlation given by 0.85, has the fMRI map (fMRI IC 1) showing activations in the temporal lobe (activations enclosed in red circles) and the middle anterior cingulate region (red box) and the ERP (ERP IC 1) showing a maximum peak at around 300 ms (P3) after the stimulus onset. This is similar to the result obtained in [39] using jICA on a similar dataset. Another pair of components, having a correlation of 0.66, shows activation in the motor areas (purple box) and the bilateral temporal lobe (blue box) (fMRI IC 2) which are associated with the N2 peak (ERP IC 2). The final pair of components of interest shows significant differences between patients and controls for only the ERP component and not the fMRI component. This finding is not possible with jICA since it assumes the same mixing matrix for both modalities and it is quite plausible that for this particular component pair, fMRI is not sensitive to the differences in controls and patients.
Multimodal CCA is invariant to differences in the range of the data types and can be used to jointly analyze very diverse data types. It can also be extended to multi-set CCA to incorporate more than two modalities [43,60]. Note that multimodal CCA works on the second-level fMRI feature ___ contrast maps, while multiset-CCA can work with 4D raw fMRI data (not shown in Figure 1), e.g., to maximize the trial-to-trial covariation between the concurrent fMRI and EEG data [25].
Partial Least Squares
Partial Least Squares (PLS) as part of a family of multivariate data analyses, is based on the definition of a linear relationship between a dependent variable and predictor variables, and hence the goal is to determine which aspect of a set of observations (e.g., imaging data) are related directly to another set of data (e.g., experimental design, behavior) [61]. PLS was first applied to multimodal fusion by [24], where the multiway PLS (N-PLS) was proposed to find correlations between fMRI time courses (dependent variables) and the spectral components of the EEG data (independent variables) from a single subject, as seen in Figure 1. The N-PLS method assumes a tri-linear decomposition of the EEG data into spectral, spatial and temporal signatures, and a linear mixing model for fMRI data into spatial and temporal components. The decomposition was constrained to maximize the covariance of corresponding temporal components between EEG and fMRI, see Figure 1. The limitation of N-PLS is that decomposing the data and then correlating across modalities may not ensure discovery of optimal relationship across modalities since this may lead to making non-physiological assumptions about cross-modality relationships [25]. In addition, N-PLS can be prone to overfitting, i.e., explaining EEG modulations with random multivariate noise in fMRI data [62].
[30] proposed a multimodal PLS (MMPLS) to simultaneously characterize the linkage between patterns of PET and gray matter, and applied it to 15 younger adults and 14 cognitively normal older adults. Multimodal PLS can be performed either informed to the variable of interest such as age or agnostic to this additional information (with or without a prior information). Investigators may want to pre-specify which of these two methods to use in the data analysis. The agnostic MMPLS was used to identify the linkage between PET (dependent datablock) and MRI (independent datablock), which is mainly oriented for extraction of covariance patterns and related latent variables, rather than for classifications. Figure 4 shows each of the subjects’ latent variable subject scores (PET versus MRI), demonstrating no overlap between the older and younger subject groups. And the overall linkage strength index, the squared correlation coefficient for the latent variables, is R2=0.73 (p<4e–9).
Figure 4.

PET/GM PLS from [30]. Scatter graph of MRI–PET subject (i.e., latent variable pair) scores generated using the agnostic multimodal PLS (corresponding to the MRI latent variable on the x-axis and the PET latent variable on the y-axis). Solid circles denote subjects in the older age group and open circles denote those in the younger age group. Note the complete separation (indicated by the dashed line) between the older and younger subjects. The solid line is the latent variable line of regression between MRI and PET subject scores.
Even though PLS has some similarity to CCA in that they both maximize between-set correlations, PLS is based on the definition of a dependency and works especially well when the dependence among the constituents of the datasets is explicitly assessed [63]; while CCA does not assign independent/dependent labels to either of the modalities and treats both equally [43]. Hence PLS is particularly suited to the analysis of relationships between measures of brain activity and of behavior or experimental design [62], while interpretational difficulties in PLS often arise when the effects identified do not correspond to the prior expectations of the researcher.
Linked ICA
Linked ICA is a probabilistic approach based on a modular Bayesian framework, which is designed for simultaneously modeling and discovering common characteristics across multiple modalities [23]. The combined modalities can potentially have completely different units, noise level, spatial smoothnesses and intensity distributions. Linked ICA has two configurations: one is “linked tensor ICA”, in which modalities derived from the same source with similar spatial properties can be grouped together into one modality group to share a common modal map, e.g., FA, mean diffusivity (MD), and tensor mode (MO) can be configured as a tensor (DTI group data) to link GM, as shown in Figure 1. Another one is “linked flat ICA”, in which all modalities have their own spatial map respectively, but shared a same subject-mixing matrix. In both cases, each modality (group) is modeled using Bayesian tensor ICA [64], which differs from the traditional ICA methods like fastICA [65] and Infomax [66] in that it incorporates dimensionality reduction into the ICA method itself by the use of automatic relevance determination (ARD) priors on components [67] and works on the full-dimensionality data directly.
Linked ICA automatically determines the optimal weighting of each modality, and also can detect single-modality structured components when present. In particular, it is noted to be better at detecting and isolating single-modality noise, which may help provide more components in real data that can be interpreted. Linked ICA is similar to jICA in that they both assume a common subject loading matrix for all features and can “turn off” certain modalities if necessary. However, linked tensor ICA may make more sense in grouping similar features when combining multiple (3+) modalities; though it is computationally more demanding. Furthermore, joint ICA is probably best suited for two modalities, but when going above two, a hybrid approach called “mCCA+jICA” as discussed in the next section, is recommended.
In a real application, Linked ICA was applied to probable Alzheimer’s patients and 46 age-matched controls. Figure 5 displayed one joint component derived from linked flat ICA, which involves all modalities and has subject’s loadings that are strongly correlated with age (0.49) as well as pathology (0.30). The widespread increase in MD and decrease in GM are observed. The other DTI patterns are more complicated: in the corpus callosum and forceps major both FA and MO decrease, while they both increase in the internal capsule, corona radiata, and superior longitudinal fasciculus. All of these are consistent with neurodegeneration, because these signals will decrease in single-fiber direction areas but will increase due to selective degeneration of one tract in areas of crossing fibers.
Figure 5.
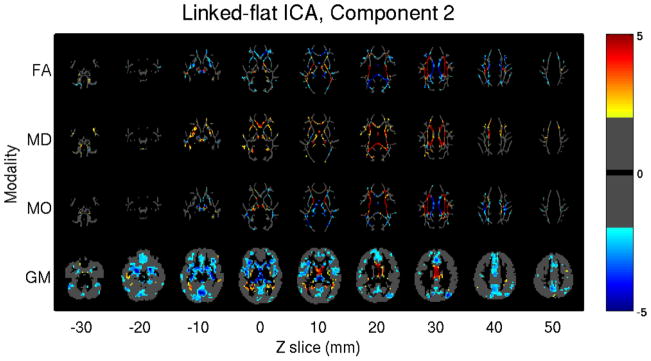
GM/FA/MD/MO from [23]. Linked flat ICA model identified one joint component whose subject mixing profile is positively correlated with age and pathology, the image is thresholded as |Z| > 2 for display.
mCCA+jICA
According to a number of previous findings in brain connectivity studies that combined function and structure [17,68], it is plausible to assume that the components decomposed from each modality have some degree of correlation between their mixing profiles among subjects. mCCA+jICA is a blind data-driven model that is optimized for this situation [69] and also to have excellent performance for achieving both flexible modal association and source separation. It takes advantages of two complementary approaches: mCCA and jICA, thus allows both highly and weakly connected modulations as well as joint independent components. mCCA makes the jICA job more reliable by providing a closer initial match via correlation; while jICA further decomposes the remaining mixtures in the associated maps and relaxes the requirement of sufficiently distinct canonical correlation coefficients.
Note that the mCCA+jICA approach does not increase the computational load appreciably; however it achieves the best performance compared to mCCA and jICA alone in simulations designed to be similar to real-world brain imaging data fusion. In addition, mCCA+jICA is not limited to two-way fusion, but can potentially be extended to 3-way or N-way fusion of multiple data types by replacing the multimodal CCA with multi-set CCA [70], e.g., combining fMRI, sMRI and genetic data to construct a broad function-structure-genetics network, thus arguing for a widespread utilization.
This approach was applied to real fMRI-DTI datasets from 164 subjects, including 62 healthy controls (HC), 54 schizophrenia patients (SZ) and 48 bipolar disorders (BP), in order to clarify differences/similarities between SZ and BP [69]. Joint IC9 is carefully analyzed in Figure 6. For this component, the modal link “A1–A2 correlation” is significant (r=0.27, p=5e-04); moreover, its FA loadings are group-discriminating (controls versus patients, p=0.04) and significantly age-correlated (Figure 6c). As indicated in (a), fMRI map reveals task-related activations in superior temporal gyrus, motor cortex and parietal lobe for the Auditory oddball task; while FA map localizes the breakdown of WM integrity in UF, ATR and SLF for patients, more so for bipolar, which support the DTI findings in [71] and [72] where patients with schizophrenia and bipolar show consistent reduced integrity in uncinate fasciculus (UF), anterior thalamic radiation (ATR) and superior longitudinal fasciculus (SLF), implying a considerable overlap in white matter pathology, possibly relating to risk factors common to both disorders. Figure 6(b) demonstrates a high-level functional-structural network diagram, in order to identify which known tracts are both intersected by the regions of FA changes and touch the regional fMRI changes. Note that the WM fiber tractography is not performed for this plot, a strength of mCCA+jICA is that it can detect complicated FA/fMRI relationships without requiring a detected direct link. Figure 6(c) illustrates that both patient groups have significant anti-correlation (r >0.4) between age and FA loadings, while controls don’t; suggesting that white matter density of patients may decrease faster in these specific tracts [72,73].
Figure 6.

FMRI/FA mCCA+jICA, Joint IC 9 from [69] (a): spatial maps of the identified functional blobs and WM regions. (b): a high-level brain network diaphragm, where functional region with a red solid line frame indicates a major portion activation and the dotted line frame indicates that only small part of it is activated. Abbreviations are defined below, F: frontal lobe, P: parietal lobe, T: temporal lobe, O: occipital lobe, SLF: Superior longitudinal fasciculus, CST: Corticospinal tract, UF: Uncinate fasciculus IFO: Inferior fronto-occipital fasciculus, ILF: Inferior longitudinal fasciculus, ATR: Anterior thalamic radiation. (c): scatter plots and linear trends between subjects’ age and loading parameters. Specifically, HC in red line, SZ in blue line, BP in green line and trend of all subjects in black line.
Parallel ICA
The strong regularization imposed by the jICA framework can be relaxed in a number of ways to allow for more flexibility in the estimation. One such approach is called parallel ICA. As a framework to investigate the integration of data from two imaging modalities, this method identifies independent components of both modalities and connections between them through enhancing intrinsic interrelationships [46]. The algorithm maximizes the cost function based on both entropy and the correlation term. It proceeds such that the independence among components within each data set is maximized separately, during which if the mixing profile correlations of certain components are above the threshold; they are selected and used to modify the update of the demixing matrix based on the correlation constraint using appropriate stopping criteria, as shown in Figure 1. Note that the threshold is determined empirically and may change for different combinations of data type. Because of the ability to enhance the inter-modality correlation of one or more components, we consider parallel ICA as a semi-blind method. It has been adopted to link fMRI and genetic data (single nucleotide polymorphism arrays, SNP) [26], and sMRI and SNP data [50]. Results show that paraICA provides stable results and can identify the linked components with a relatively high accuracy [74].
Figure 7 shows results from a parallel ICA analysis of auditory oddball fMRI data and 367 SNPs from 20 schizophrenia patients and 43 healthy controls, all Caucasian [26]. The authors found a correlation of 0.38 between one fMRI component and one SNP component, both showed significant differences in loading parameters between the schizophrenia and control groups (p=0.0006 for the fMRI; p=0.001 for SNP). The fMRI component consisted of regions in parietal lobe, right temporal lobe, and bilateral frontal lobe. The relevant SNP component was contributed to significantly by 10 SNPs located in genes including those coding for the nicotinic alpha-7cholinergic receptor (CHRNA7), aromatic amino acid decarboxylase (AADC) and disrupted in schizophrenia 1 (DISC1).
Figure 7.
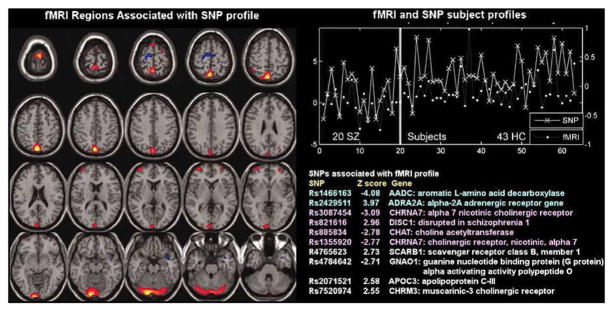
fMRI/SNP parallel ICA from [26]: Parallel ICA provides an fMRI part (left) and a SNP part (bottom right) in addition to a correlated subject profile for both fMRI and SNP data (top right).
The parallel ICA framework enabled us to identify interactions between brain functional and genetic information; our findings provide a proof-of-concept that genomic SNP factors can be investigated by using phenotypic imaging findings in a multivariate format.
CC-ICA
Coefficients-constrained ICA (CC-ICA) aims to improve the components’ extraction sensitivity to group differences as well as the decomposition accuracy. Note that joint ICA is a blind method that does not incorporate prior diagnostic information and is as such not optimized for detecting group differences. If the goal is to optimally identify potential biomarkers of disease, we can incorporate prior membership information and thus enhance the sensitivity of the method to detect relevant group differences. Towards this end, CC-ICA was proposed [27], which is formulated by incorporating a group difference criterion into the traditional ICA cost function to adaptively constrain the mixing coefficients of certain components and thus enhance detection of group differences. It can be combined with principal component analysis with reference (PCA-R) [28,75] as a general approach for disease biomarker identification [51,52]. One advantage of the approach is that it provides a unitary, and concise representation of a particular group discriminative feature from multitask/multimodal data into a single component. CC-ICA can be applied to a variety of multimodal combinations similar to joint ICA.
For example, CC-ICA+PCA-R is applied to fMRI data from 3 tasks: sensorimotor (SM), auditory oddball (AOD) and Sternberg working memory (SBP), which were collected from 25 patients with schizophrenia and 28 healthy controls [51]. Three optimal components belong to two optimal feature combinations were identified (Figure 8 a, b): two components extracted from the SM task alone, and one joint component from the SBP & AOD tasks. Figure 8c gives a distinct view of the combined spatial maps in Figures 8a, b; these activated regions can best separate the two groups. A significant group difference is indicated in Figure 8d by subtracting the spatial maps of patients from controls. The three optimal components predominantly describe aberrant patterns of activity in the superior temporal gyri, precuneus and angular gyri (DMN). Note also that each of these brain networks was identified separately in previous neuroimaging studies; [76–78]. Our approach grouped them together in a framework that specifically identifies group discriminative features.
Figure 8.

Multitask fMRI, CC-ICA from Sui et al., 2009a. Top 3 optimal components and the combined most group-discriminative regions: a, b) are the spatial maps of the top three optimal components, which are converted to Z-scores and thresholded at |Z|>2.5; (c) shows the overlapping regions of the four features with their original spatial map values, these activated regions are important for group discrimination and may serve as potential biomarkers of schizophrenia patients; (d) displays the difference between the backreconstructed sources (HC-SZ) on the combined highlighted regions of the top three optimal ICs in (c), the regions where HC>SZ in | Z | score are shown in orange, otherwise are shown in blue.
The optimal components are then utilized as a template in a simple approach to classify patients and controls using a dataset collected from a different scanner. Another mask is created by thresholding a two-sample t-test on the contrast images of the two groups at a significance level of p<0.0001. The contrast image of every subject is masked via the template and the resulting nonzero voxels are transformed into a scalar with reduced dimension. We use mean of the absolute value of this scalar as the classifier input of each subject. Each individual was assigned one of two class memberships, with a leave-one-out approach based on the Euclidian distance between the individual and group means. The mask using optimal components generates the highest classification accuracy (sensitivity 87% and specificity 73%), while using the same concatenated multimodal data, a univariate method (t-test) results in a relatively lower accuracy (sensitivity 75% and specificity 64%).
These results are quite encouraging considering the use of optimal components generated by CC-ICA as potential biomarkers. Such a result cannot be obtained using traditional mass-univariate approaches which focus upon detection of activity differences in single tasks. Moreover, the optimal components may only be “identifiable” by using data collected during different tasks, which further motivates a data fusion approach.
Other Multimodal Fusion Applications
There are several other multivariate methods employed in multimodal fusion, such as multiple regression [31,45], in which data fusion usually involves two stages: a form of feature extraction, e.g., source separation, then followed by a cross-modality correlation or regression based on these features. In addtion, structural equation modeling (SEM) or dynamic causal modeling (DCM) can be used to examine the correlational structure between functional and structural variables (Astolfi, et al. 2004; Hamandi, et al. 2008; Kiebel, et al. 2008; Vitacco, et al. 2002). Such approaches are useful for model testing; however, neither do they provide an examination of the full set of brain voxels, nor do they allow testing of unknown connections. Alternatively, one could choose to examine correlation (and potentially extend to nonlinear relationship through the use of other criteria such as mutual information) between all points of the data. This approach has been applied to examine functional connectivity in fMRI by computing a 6D matrix of correlations [79]. Such computations are straightforward; whereas, the drawback is that they are high in dimensionality and hence potentially difficult to interpret. Moreover, the Local Linearization (LL) method for integrating stochastic differential equations is appropriate for highly nonlinear dynamics. It has been successfully applied to small and medium sized networks, reproducing the described EEG/BOLD correlations [3].
III. CONCLUSION
There is great potential benefit in exploring joint information from multimodal brain imaging data. In this paper, we review several data-driven multivariate methods that have been applied to multimodal/multitask brain imaging data fusion. Each method presents a different view in interpreting the multiple datasets based on their various hypotheses; hence it is important to choose an appropriate fusion model according to the purpose of the analysis, the available data types and the need of priors, so as to help better elucidate the relationship between multiple modalities.
In summary, studies featuring multimodal combination prove to be more informative in understanding of brain activity and disorders. The most promising avenues for the future may rest on developing better models that can complement and exploit the richness of our data [16]. These models may well already exist in other disciplines (such as machine learning, machine vision, computational neuroscience, and behavioral economics) and may enable the broader neurosciences to access neuroimaging so that key questions can be addressed in a theoretically grounded fashion.
Acknowledgments
This work was supported by the National Institutes of Health grants R01EB 006841 and R01EB 005846 (to Calhoun VD), and by the National Sciences Foundation grants 1017718 (to Adali T) and 1016619 (to Calhoun VD).
References
- 1.Calhoun VD, Adali T, Giuliani NR, Pekar JJ, Kiehl KA, et al. Method for multimodal analysis of independent source differences in schizophrenia: combining gray matter structural and auditory oddball functional data. Hum Brain Mapp. 2006;27:47–62. doi: 10.1002/hbm.20166. [DOI] [PMC free article] [PubMed] [Google Scholar]
- 2.Plis SM, Weisend MP, Damaraju E, Eichele T, Mayer A, et al. Effective connectivity analysis of fMRI and MEG data collected under identical paradigms. Comput Biol Med. 2011 doi: 10.1016/j.compbiomed.2011.04.011. [DOI] [PMC free article] [PubMed] [Google Scholar]
- 3.Valdes-Sosa PA, Sanchez-Bornot JM, Sotero RC, Iturria-Medina Y, Aleman-Gomez Y, et al. Model driven EEG/fMRI fusion of brain oscillations. Hum Brain Mapp. 2009;30:2701–2721. doi: 10.1002/hbm.20704. [DOI] [PMC free article] [PubMed] [Google Scholar]
- 4.Plis SM, Calhoun VD, Weisend MP, Eichele T, Lane T. MEG and fMRI Fusion for Non-Linear Estimation of Neural and BOLD Signal Changes. Front Neuroinformatics. 2010;4:114. doi: 10.3389/fninf.2010.00114. [DOI] [PMC free article] [PubMed] [Google Scholar]
- 5.Yang H, Liu J, Sui J, Pearlson G, Calhoun VD. A Hybrid Machine Learning Method for Fusing fMRI and Genetic Data: Combining both Improves Classification of Schizophrenia. Front Hum Neurosci. 2010;4:192. doi: 10.3389/fnhum.2010.00192. [DOI] [PMC free article] [PubMed] [Google Scholar]
- 6.Skudlarski P, Jagannathan K, Anderson K, Stevens MC, Calhoun VD, et al. Brain connectivity is not only lower but different in schizophrenia: a combined anatomical and functional approach. Biol Psychiatry. 2010;68:61–69. doi: 10.1016/j.biopsych.2010.03.035. [DOI] [PMC free article] [PubMed] [Google Scholar]
- 7.Michael AM, Baum SA, White T, Demirci O, Andreasen NC, et al. Does function follow form?: methods to fuse structural and functional brain images show decreased linkage in schizophrenia. Neuroimage. 2010;49:2626–2637. doi: 10.1016/j.neuroimage.2009.08.056. [DOI] [PMC free article] [PubMed] [Google Scholar]
- 8.Horwitz B, Poeppel D. How can EEG/MEG and fMRI/PET data be combined? Hum Brain Mapp. 2002;17:1–3. doi: 10.1002/hbm.10057. [DOI] [PMC free article] [PubMed] [Google Scholar]
- 9.Calhoun VD, Adali T. Feature-based fusion of medical imaging data. IEEE Trans Inf Technol Biomed. 2009;13:711–720. doi: 10.1109/TITB.2008.923773. [DOI] [PMC free article] [PubMed] [Google Scholar]
- 10.Dale AM, Halgren E. Spatiotemporal mapping of brain activity by integration of multiple imaging modalities. Curr Opin Neurobiol. 2001;11:202–208. doi: 10.1016/s0959-4388(00)00197-5. [DOI] [PubMed] [Google Scholar]
- 11.Babiloni F, Mattia D, Babiloni C, Astolfi L, Salinari S, et al. Multimodal integration of EEG, MEG and fMRI data for the solution of the neuroimage puzzle. Magn Reson Imaging. 2004;22:1471–1476. doi: 10.1016/j.mri.2004.10.007. [DOI] [PubMed] [Google Scholar]
- 12.Goldberg-Zimring D, Mewes AU, Maddah M, Warfield SK. Diffusion tensor magnetic resonance imaging in multiple sclerosis. J Neuroimaging. 2005;15:68S–81S. doi: 10.1177/1051228405283363. [DOI] [PubMed] [Google Scholar]
- 13.Ramnani N, Lee L, Mechelli A, Phillips C, Roebroeck A, et al. Exploring brain connectivity: A new frontier in systems neuroscience. Functional Brain Connectivity, 4–6 April 2002, Dusseldorf, Germany. Trends Neurosci. 2002;25:496–497. doi: 10.1016/s0166-2236(02)02227-0. [DOI] [PubMed] [Google Scholar]
- 14.Henson RN, Flandin G, Friston KJ, Mattout J. A Parametric Empirical Bayesian Framework for fMRI-Constrained MEG/EEG Source Reconstruction. Hum Brain Mapp. 2010;31:1512–1531. doi: 10.1002/hbm.20956. [DOI] [PMC free article] [PubMed] [Google Scholar]
- 15.Lemieux L. Electroencephalography-correlated functional MR imaging studies of epileptic activity. Neuroimaging Clinics of North America. 2004;14:487. doi: 10.1016/j.nic.2004.04.009. [DOI] [PubMed] [Google Scholar]
- 16.Friston KJ. Modalities, modes, and models in functional neuroimaging. Science. 2009;326:399–403. doi: 10.1126/science.1174521. [DOI] [PubMed] [Google Scholar]
- 17.Rykhlevskaia E, Gratton G, Fabiani M. Combining structural and functional neuroimaging data for studying brain connectivity: a review. Psychophysiology. 2008;45:173–187. doi: 10.1111/j.1469-8986.2007.00621.x. [DOI] [PubMed] [Google Scholar]
- 18.Oakes TR, Fox AS, Johnstone T, Chung MK, Kalin N, et al. Integrating VBM into the General Linear Model with voxelwise anatomical covariates. Neuroimage. 2007;34:500–508. doi: 10.1016/j.neuroimage.2006.10.007. [DOI] [PMC free article] [PubMed] [Google Scholar]
- 19.Schlosser R, Gesierich T, Kaufmann B, Vucurevic G, Hunsche S, et al. Altered effective connectivity during working memory performance in schizophrenia: a study with fMRI and structural equation modeling. Neuroimage. 2003;19:751–763. doi: 10.1016/s1053-8119(03)00106-x. [DOI] [PubMed] [Google Scholar]
- 20.Calhoun VD, Adali T, Kiehl KA, Astur R, Pekar JJ, et al. A method for multitask fMRI data fusion applied to schizophrenia. Hum Brain Mapp. 2006;27:598–610. doi: 10.1002/hbm.20204. [DOI] [PMC free article] [PubMed] [Google Scholar]
- 21.Calhoun VD, Liu J, Adali T. A review of group ICA for fMRI data and ICA for joint inference of imaging, genetic, and ERP data. Neuroimage. 2009;45:S163–172. doi: 10.1016/j.neuroimage.2008.10.057. [DOI] [PMC free article] [PubMed] [Google Scholar]
- 22.Correa N, Adali T, Calhoun VD. Performance of blind source separation algorithms for fMRI analysis using a group ICA method. Magn Reson Imaging. 2007;25:684–694. doi: 10.1016/j.mri.2006.10.017. [DOI] [PMC free article] [PubMed] [Google Scholar]
- 23.Groves AR, Beckmann CF, Smith SM, Woolrich MW. Linked independent component analysis for multimodal data fusion. Neuroimage. 2011;54:2198–2217. doi: 10.1016/j.neuroimage.2010.09.073. [DOI] [PubMed] [Google Scholar]
- 24.Martinez-Montes E, Valdes-Sosa PA, Miwakeichi F, Goldman RI, Cohen MS. Concurrent EEG/fMRI analysis by multiway Partial Least Squares. Neuroimage. 2004;22:1023–1034. doi: 10.1016/j.neuroimage.2004.03.038. [DOI] [PubMed] [Google Scholar]
- 25.Correa NM, Eichele T, Adali T, Li YO, Calhoun VD. Multi-set canonical correlation analysis for the fusion of concurrent single trial ERP and functional MRI. Neuroimage. 2010 doi: 10.1016/j.neuroimage.2010.01.062. [DOI] [PMC free article] [PubMed] [Google Scholar]
- 26.Liu J, Pearlson G, Windemuth A, Ruano G, Perrone-Bizzozero NI, et al. Combining fMRI and SNP data to investigate connections between brain function and genetics using parallel ICA. Hum Brain Mapp. 2009;30:241–255. doi: 10.1002/hbm.20508. [DOI] [PMC free article] [PubMed] [Google Scholar]
- 27.Sui J, Adali T, Pearlson GD, Clark VP, Calhoun VD. A method for accurate group difference detection by constraining the mixing coefficients in an ICA framework. Hum Brain Mapp. 2009;30:2953–2970. doi: 10.1002/hbm.20721. [DOI] [PMC free article] [PubMed] [Google Scholar]
- 28.Caprihan A, Pearlson GD, Calhoun VD. Application of principal component analysis to distinguish patients with schizophrenia from healthy controls based on fractional anisotropy measurements. Neuroimage. 2008;42:675–682. doi: 10.1016/j.neuroimage.2008.04.255. [DOI] [PMC free article] [PubMed] [Google Scholar]
- 29.Liu J, Xu L, Calhoun VD. Extracting principle components for discriminant analysis of FMRI images. ICASSP; 2008 March 30–April 4; Las vegas, USA. pp. 449–452. [DOI] [PMC free article] [PubMed] [Google Scholar]
- 30.Chen K, Reiman EM, Huan Z, Caselli RJ, Bandy D, et al. Linking functional and structural brain images with multivariate network analyses: a novel application of the partial least square method. Neuroimage. 2009;47:602–610. doi: 10.1016/j.neuroimage.2009.04.053. [DOI] [PMC free article] [PubMed] [Google Scholar]
- 31.Eichele T, Specht K, Moosmann M, Jongsma ML, Quiroga RQ, et al. Assessing the spatiotemporal evolution of neuronal activation with single-trial event-related potentials and functional MRI. Proc Natl Acad Sci U S A. 2005;102:17798–17803. doi: 10.1073/pnas.0505508102. [DOI] [PMC free article] [PubMed] [Google Scholar]
- 32.Valdes-Sosa PA. Spatio-temporal autoregressive models defined over brain manifolds. Neuroinformatics. 2004;2:239–250. doi: 10.1385/NI:2:2:239. [DOI] [PubMed] [Google Scholar]
- 33.Astolfi L, Cincotti F, Mattia D, Salinari S, Babiloni C, et al. Estimation of the effective and functional human cortical connectivity with structural equation modeling and directed transfer function applied to high-resolution EEG. Magn Reson Imaging. 2004;22:1457–1470. doi: 10.1016/j.mri.2004.10.006. [DOI] [PubMed] [Google Scholar]
- 34.Hamandi K, Powell HW, Laufs H, Symms MR, Barker GJ, et al. Combined EEG-fMRI and tractography to visualise propagation of epileptic activity. J Neurol Neurosurg Psychiatry. 2008;79:594–597. doi: 10.1136/jnnp.2007.125401. [DOI] [PMC free article] [PubMed] [Google Scholar]
- 35.Specht K, Zahn R, Willmes K, Krause BJ, Herzog H, et al. Tracing the recovery of aphasia with a joint ICA of functional and structural data. 14th Annual Meeting of the Organization of Human Brain Mapping; 2008 Jun 14–19; Melbourne, Australia. [Google Scholar]
- 36.Choi K, Yang Z, Hu X, Mayberg H. Psychiatric MRI/MRS. Toronto, Cananda: 2008. May 3–9, A Combined Functional-Structural Connectivity Analysis of Major Depression Using Joint Independent Components Analysis; p. 3555. [Google Scholar]
- 37.Calhoun VD, Adali T, Liu J. A feature-based approach to combine functional MRI, structural MRI and EEG brain imaging data. New York City, USA: 2006. Aug-Sep. pp. 3672–3675. [DOI] [PubMed] [Google Scholar]
- 38.Eichele T, Calhoun VD, Debener S. Mining EEG-fMRI using independent component analysis. Int J Psychophysiol. 2009;73:53–61. doi: 10.1016/j.ijpsycho.2008.12.018. [DOI] [PMC free article] [PubMed] [Google Scholar]
- 39.Calhoun V, Wu L, Kiehl K, Eichele T, Pearlson G. Aberrant Processing of Deviant Stimuli in Schizophrenia Revealed by Fusion of FMRI and EEG Data. Acta Neuropsychiatr. 2011;22:127–138. doi: 10.1111/j.1601-5215.2010.00467.x. [DOI] [PMC free article] [PubMed] [Google Scholar]
- 40.Franco AR, Ling J, Caprihan A, Calhoun VD, Jung RE, et al. Multimodal and Multi-tissue Measures of Connectivity Revealed by Joint Independent Component Analysis. IEEE J Sel Top Signal Process. 2008;2:986–997. doi: 10.1109/JSTSP.2008.2006718. [DOI] [PMC free article] [PubMed] [Google Scholar]
- 41.Teipel SJ, Bokde AL, Meindl T, Amaro E, Jr, Soldner J, et al. White matter microstructure underlying default mode network connectivity in the human brain. Neuroimage. 2010;49:2021–2032. doi: 10.1016/j.neuroimage.2009.10.067. [DOI] [PubMed] [Google Scholar]
- 42.Xu L, Pearlson G, Calhoun VD. Joint source based morphometry identifies linked gray and white matter group differences. Neuroimage. 2009;44:777–789. doi: 10.1016/j.neuroimage.2008.09.051. [DOI] [PMC free article] [PubMed] [Google Scholar]
- 43.Correa NM, Adali T, Li YO, Calhoun VD. Canonical Correlation Analysis for Data Fusion and Group Inferences: Examining applications of medical imaging data. IEEE Signal Process Mag. 2010;27:39–50. doi: 10.1109/MSP.2010.936725. [DOI] [PMC free article] [PubMed] [Google Scholar]
- 44.Correa NM, Li YO, Adali T, Calhoun VD. Canonical Correlation Analysis for Feature-Based Fusion of Biomedical Imaging Modalities and Its Application to Detection of Associative Networks in Schizophrenia. IEEE J Sel Top Signal Process. 2008;2:998–1007. doi: 10.1109/JSTSP.2008.2008265. [DOI] [PMC free article] [PubMed] [Google Scholar]
- 45.De Martino F, Valente G, de Borst AW, Esposito F, Roebroeck A, et al. Multimodal imaging: an evaluation of univariate and multivariate methods for simultaneous EEG/fMRI. Magn Reson Imaging. 2010;28:1104–1112. doi: 10.1016/j.mri.2009.12.026. [DOI] [PubMed] [Google Scholar]
- 46.Liu J, Calhoun VD. Parallel independent component analysis for multimodal analysis: application to fMRI and EEG data. Arlington, USA: 2007. pp. 1028–1231. [Google Scholar]
- 47.Wu L, Eichele T, Calhoun VD. Reactivity of hemodynamic responses and functional connectivity to different states of alpha synchrony: a concurrent EEG-fMRI study. Neuroimage. 2010;52:1252–1260. doi: 10.1016/j.neuroimage.2010.05.053. [DOI] [PMC free article] [PubMed] [Google Scholar]
- 48.Meda SA, Jagannathan K, Gelernter J, Calhoun VD, Liu J, et al. A pilot multivariate parallel ICA study to investigate differential linkage between neural networks and genetic profiles in schizophrenia. Neuroimage. 2010;53:1007–1015. doi: 10.1016/j.neuroimage.2009.11.052. [DOI] [PMC free article] [PubMed] [Google Scholar]
- 49.Jamadar S, Powers NR, Meda SA, Gelernter J, Gruen JR, et al. Genetic influences of cortical gray matter in language-related regions in healthy controls and schizophrenia. Schizophr Res. 2010 doi: 10.1016/j.schres.2011.03.027. [DOI] [PMC free article] [PubMed] [Google Scholar]
- 50.Jagannathan K, Calhoun VD, Gelernter J, Stevens MC, Liu J, et al. Genetic associations of brain structural networks in schizophrenia: a preliminary study. Biol Psychiatry. 2010;68:657–666. doi: 10.1016/j.biopsych.2010.06.002. [DOI] [PMC free article] [PubMed] [Google Scholar]
- 51.Sui J, Adali T, Pearlson GD, Calhoun VD. An ICA-based method for the identification of optimal FMRI features and components using combined group-discriminative techniques. Neuroimage. 2009;46:73–86. doi: 10.1016/j.neuroimage.2009.01.026. [DOI] [PMC free article] [PubMed] [Google Scholar]
- 52.Kim DI, Sui J, Rachakonda S, White T, Manoach DS, et al. Identification of Imaging Biomarkers in Schizophrenia: A Coefficient-constrained Independent Component Analysis of the Mind Multi-site Schizophrenia Study. Neuroinformatics. 2010 doi: 10.1007/s12021-010-9077-7. [DOI] [PMC free article] [PubMed] [Google Scholar]
- 53.Kiebel SJ, Garrido MI, Moran RJ, Friston KJ. Dynamic causal modelling for EEG and MEG. Cogn Neurodyn. 2008;2:121–136. doi: 10.1007/s11571-008-9038-0. [DOI] [PMC free article] [PubMed] [Google Scholar]
- 54.Blum AL, Langley P. Selection of relevant features and examples in machine learning. Artificial Intelligence. 1997;97:245–271. [Google Scholar]
- 55.Smith SM, Fox PT, Miller KL, Glahn DC, Fox PM, et al. Correspondence of the brain’s functional architecture during activation and rest. Proc Natl Acad Sci U S A. 2009;106:13040–13045. doi: 10.1073/pnas.0905267106. [DOI] [PMC free article] [PubMed] [Google Scholar]
- 56.Kiehl KA, Liddle PF. An event-related functional magnetic resonance imaging study of an auditory oddball task in schizophrenia. Schizophr Res. 2001;48:159–171. doi: 10.1016/s0920-9964(00)00117-1. [DOI] [PubMed] [Google Scholar]
- 57.Xu L, Groth KM, Pearlson G, Schretlen DJ, Calhoun VD. Source-based morphometry: the use of independent component analysis to identify gray matter differences with application to schizophrenia. Hum Brain Mapp. 2009;30:711–724. doi: 10.1002/hbm.20540. [DOI] [PMC free article] [PubMed] [Google Scholar]
- 58.Shenton ME, Dickey CC, Frumin M, McCarley RW. A review of MRI findings in schizophrenia. Schizophr Res. 2001;49:1–52. doi: 10.1016/s0920-9964(01)00163-3. [DOI] [PMC free article] [PubMed] [Google Scholar]
- 59.Sui J, Adali T, Li YO, Yang H, Calhoun DC. Biomedical Applications in Molecular, Structural, and Functional Imaging. San Diego, CA, USA: 2010. Feb 13–18, A review of multivariate methods in brain imaging data fusion. [Google Scholar]
- 60.Li Y-O, Adali T, Wang W, Calhoun VD. Joint Blind Source Separation by Multiset Canonical Correlation Analysis. IEEE Trans Signal Process. 2009;57:3918–3929. doi: 10.1109/TSP.2009.2021636. [DOI] [PMC free article] [PubMed] [Google Scholar]
- 61.Lin FH, McIntosh AR, Agnew JA, Eden GF, Zeffiro TA, et al. Multivariate analysis of neuronal interactions in the generalized partial least squares framework: simulations and empirical studies. Neuroimage. 2003;20:625–642. doi: 10.1016/S1053-8119(03)00333-1. [DOI] [PubMed] [Google Scholar]
- 62.McIntosh AR, Lobaugh NJ. Partial least squares analysis of neuroimaging data: applications and advances. Neuroimage. 2004;23(Suppl 1):S250–263. doi: 10.1016/j.neuroimage.2004.07.020. [DOI] [PubMed] [Google Scholar]
- 63.Krishnan A, Williams LJ, McIntosh AR, Abdi H. Partial Least Squares (PLS) methods for neuroimaging: A tutorial and review. Neuroimage. 2010;56:455–475. doi: 10.1016/j.neuroimage.2010.07.034. [DOI] [PubMed] [Google Scholar]
- 64.Beckmann CF, Smith SM. Tensorial extensions of independent component analysis for multisubject FMRI analysis. Neuroimage. 2005;25:294–311. doi: 10.1016/j.neuroimage.2004.10.043. [DOI] [PubMed] [Google Scholar]
- 65.Hyvarinen A, Oja E. Independent component analysis: algorithms and applications. Neural Netw. 2000;13:411–430. doi: 10.1016/s0893-6080(00)00026-5. [DOI] [PubMed] [Google Scholar]
- 66.Bell AJ, Sejnowski TJ. An information-maximization approach to blind separation and blind deconvolution. Neural Comput. 1995;7:1129–1159. doi: 10.1162/neco.1995.7.6.1129. [DOI] [PubMed] [Google Scholar]
- 67.Bishop CM. Variational principal components. Articial Neural Networks. 1999;7:509. [Google Scholar]
- 68.Camara E, Rodriguez-Fornells A, Munte TF. Microstructural brain differences predict functional hemodynamic responses in a reward processing task. J Neurosci. 2010;30:11398–11402. doi: 10.1523/JNEUROSCI.0111-10.2010. [DOI] [PMC free article] [PubMed] [Google Scholar]
- 69.Sui J, Pearlson GD, Caprihan A, Adali T, Kiehl KA, et al. Discriminating Schizophrenia and Bipolar Disorder by Fusing FMRI and DTI in A Multimodal CCA+ Joint ICA Model. Neuroimage. 2011 doi: 10.1016/j.neuroimage.2011.05.055. In press. [DOI] [PMC free article] [PubMed] [Google Scholar]
- 70.Li YO, Adali T, Wang W, Calhoun VD. Joint Blind Source Separation by Multi-set Canonical Correlation Analysis. IEEE Trans Signal Process. 2009;57:3918–3929. doi: 10.1109/TSP.2009.2021636. [DOI] [PMC free article] [PubMed] [Google Scholar]
- 71.McIntosh AM, Maniega SM, Lymer GK, McKirdy J, Hall J, et al. White matter tractography in bipolar disorder and schizophrenia. Biol Psychiatry. 2008;64:1088–1092. doi: 10.1016/j.biopsych.2008.07.026. [DOI] [PubMed] [Google Scholar]
- 72.Sussmann JE, Lymer GK, McKirdy J, Moorhead TW, Maniega SM, et al. White matter abnormalities in bipolar disorder and schizophrenia detected using diffusion tensor magnetic resonance imaging. Bipolar Disord. 2009;11:11–18. doi: 10.1111/j.1399-5618.2008.00646.x. [DOI] [PubMed] [Google Scholar]
- 73.McIntosh AM, Moorhead TW, Job D, Lymer GK, Munoz Maniega S, et al. The effects of a neuregulin 1 variant on white matter density and integrity. Mol Psychiatry. 2008;13:1054–1059. doi: 10.1038/sj.mp.4002103. [DOI] [PubMed] [Google Scholar]
- 74.Liu J, Bixler JNVDC. A multimodality ICA study-integrating genomic single nucleotid polymorphisms with functional neuroimaging data. Proc Bioinformatics and Biomedicine (BIBM); Philadelphia, PA. 2008. pp. 151–157. [Google Scholar]
- 75.Liu J, Xu L, Caprihan A, Calhoun VD. Extracting Principle Components for Discriminant Analysis of Fmri Images. Proc IEEE Int Conf Acoust Speech Signal Process. 2008;2008:449–452. doi: 10.1109/ICASSP.2008.4517643. [DOI] [PMC free article] [PubMed] [Google Scholar]
- 76.Garrity AG, Pearlson GD, McKiernan K, Lloyd D, Kiehl KA, et al. Aberrant “default mode” functional connectivity in schizophrenia. Am J Psychiatry. 2007;164:450–457. doi: 10.1176/ajp.2007.164.3.450. [DOI] [PubMed] [Google Scholar]
- 77.Kiehl KA, Stevens MC, Celone K, Kurtz M, Krystal JH. Abnormal hemodynamics in schizophrenia during an auditory oddball task. Biol Psychiatry. 2005;57:1029–1040. doi: 10.1016/j.biopsych.2005.01.035. [DOI] [PMC free article] [PubMed] [Google Scholar]
- 78.Tregellas JR, Tanabe JL, Miller DE, Ross RG, Olincy A, et al. Neurobiology of smooth pursuit eye movement deficits in schizophrenia: an fMRI study. Am J Psychiatry. 2004;161:315–321. doi: 10.1176/appi.ajp.161.2.315. [DOI] [PubMed] [Google Scholar]
- 79.Worsley KJ, Cao J, Paus T, Petrides M, Evans AC. Applications of random field theory to functional connectivity. Hum Brain Mapp. 1998;6:364–367. doi: 10.1002/(SICI)1097-0193(1998)6:5/6<364::AID-HBM6>3.0.CO;2-T. [DOI] [PMC free article] [PubMed] [Google Scholar]