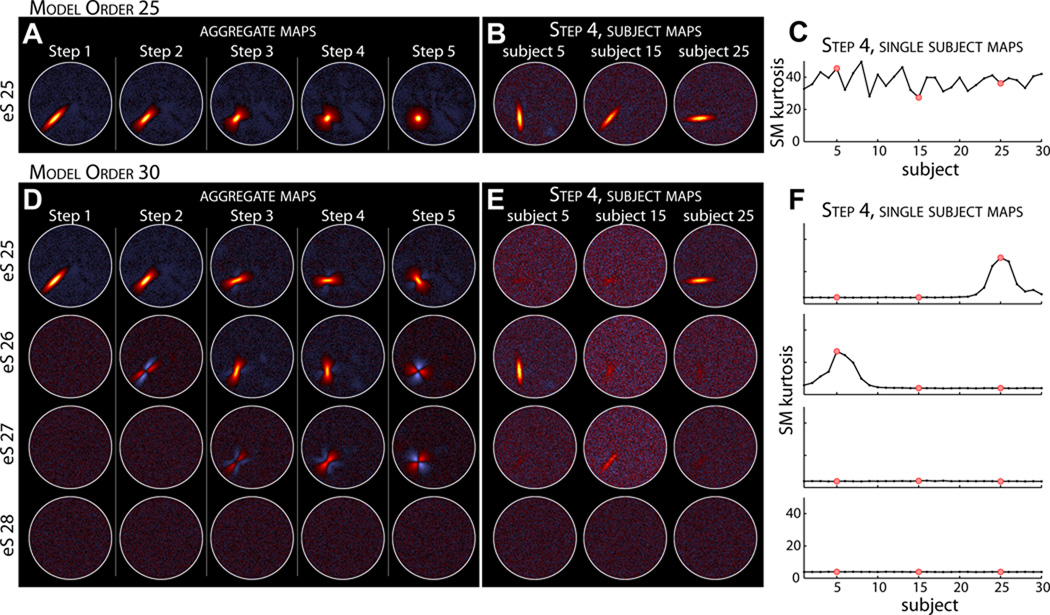
Figure 3. Experiment 1: effects of increasing model order from 25 (A–C) to 30 (D–F).
A,D) Estimated aggregate SMs for Steps 1–5. For Step 1 of model order 30 (D, left column), all “extra” estimated sources (eS) are essentially noise and lack any spatial structure. At steps with spatial variability between subjects, S25 is split into two or three estimated sources. Note that we do not display eS29 or eS30 since these additional estimated sources were simply noise for all steps. B,E) Examples of subject SMs for Step 4. At higher model order no single component captures the SM for all subjects. C,F) Kurtosis of the subject SMs. Red dots in C, F correspond to the subjects displayed in B, E, respectively.

