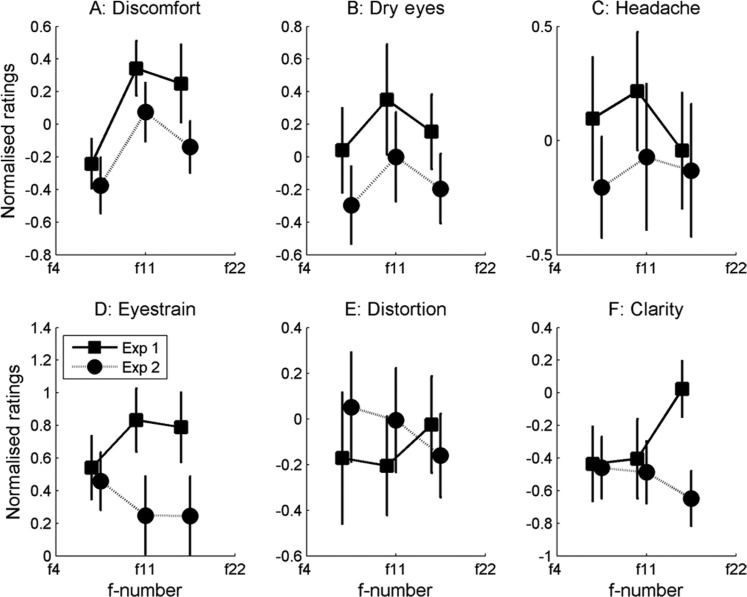
Figure 6.
Normalised ratings (z scores) against f-number for each of the questions. Higher ratings indicate the increased severity of symptoms. Error bars show ± standard error. Squares show data for images in which the central, sharply focussed object was presented at zero disparity; circles show data for images in which the object had a crossed disparity.

