Abstract
The effective imaging range of Fourier-domain optical coherence tomography is limited by fall-off. We present a very simple method to extend the effective imaging range with dual reference arms and a high speed fiber optic switch. The effective imaging range was increased by 1.8 with two reference arms compared with a single reference arm. Ex vivo tissue images showed significantly improved sensitivity over a large imaging range. Further extension of the imaging range is feasible with multiple reference arms. The trade-off between image acquisition rate and imaging range is discussed.
The imaging range of Fourier-domain optical coherence tomography (FDOCT) is primarily limited by the Fourier transform to Δz = λ20/4nδλ, where δλ=Δλ/N is the wavelength sampling interval and N is the number of data points sampling the light source spectrum. The spectral range Δλ covered by the spectrometer is centered at λ0. The imaging range is doubled if the complex conjugate ambiguity is resolved before Fourier transform[1]. Due to the geometrical size of the pixels of the linear pixel array and the spot size of the spectrometer used for spectral-domain OCT (SDOCT), there is a fall-off of sensitivity within imaging range[2–4]. Similarly, for swept-source OCT (SSOCT), this fall-off is determined by the instantaneous line width of the tunable laser light source and the integration time of the photodetector. The effective imaging range can be defined as the range at which sensitivity has decayed −6 dB from the peak sensitivity. In some clinical applications, a longer effective imaging range is important, such as imaging the anterior chamber of the eye[5], and intravascular imaging using a catheter[6]. Previously, an adaptive time-domain OCT system has been demonstrated where a 3 mm A-scan range was adaptively offset to track the tissue surface and effectively cover a 7 mm imaging range[7]. More recently, a SSOCT method was realized which increased effective imaging range by employing two offset reference paths and frequency encoding in the two reference arms. [8]. Dual reference paths were previously used in time-domain OCT to achieve en-face imaging of two layers in depth simultaneously[9]. In this letter, we present a very simple and inexpensive method to significantly increase effective imaging range for FDOCT and demonstrate the method using a SDOCT system. The method employs a high-speed fiber optic switch to serially access two reference paths with offset delays. The results of extending the effective imaging range are demonstrated by measuring the sensitivity as a function of range, and imaging a tissue sample with large surface variations.
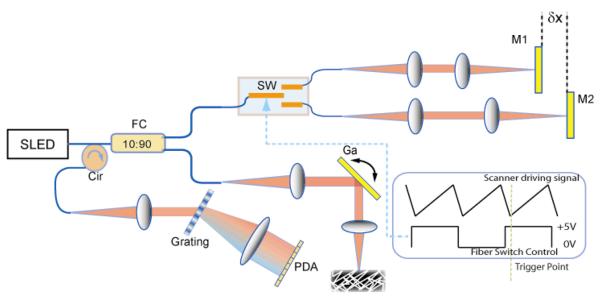
The SDOCT system used for this demonstration was illuminated by a broad-band superluminescent diode (SLED) centered at 1310 nm with a FWHM bandwidth of 70 nm, as schematically illustrated in Fig.1. The SLED has an output power of 14 mW and was coupled into a single-mode fiber coupler with a splitting ratio of 90:10, where 90% of the power was delivered to the sample. The beam in the sample arm was then focused by an achromatic lens with a focal length of 75 mm to a spot of 7 μm in diameter. The corresponding depth of focus is 0.175 mm. To resolve the complex conjugate “mirror” components in the image, the sample beam was de-centered from the pivot of the scanning galvanometer mirror to introduce a phase modulation[10–12]. All images were acquired at a rate of 40k A-scans per second.
Fig.1.

Measurement setup with a spectral-domain optical coherence tomography. Two reference arms with mirrors (M1 and M2) were separated by a distance of δ× and alternately accessed by a high speed fiber switch (SW). FC: fiber coupler; Cir: fiber circulator; Ga: galvanometer; PDA: InGaAs photodetector linear array; SLED: superluminescent diode;
In order to extend the effective imaging range, two reference arms were setup with an optical path delay difference of δx as shown in Fig.1. A high speed fiber switch making use of MEMS technology (SL-1×2-9n-12-16, Sercalo) was used to switch the light between the two reference arms frame by frame (Fig. 1). This switch has a specified typical minimal switching time of 0.3 ms, maximum insertion loss of 0.5 dB, and lifetime of at least greater than 109 switches. For SDOCT for which frame rates are no more than hundreds of frames per second, this switching speed is more than sufficient.
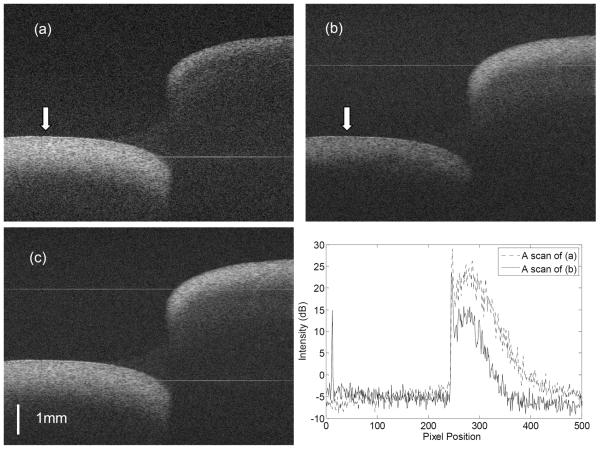
Images were recorded alternately by switching the working reference arm from one to another between frames while maintaining the identical illumination and scanning pattern on the sample. Because the two reference arms have a known optical path delay difference of δx, the two images will be offset axially by δx within the image frame, as illustrated in Fig.2 (a) and (b). In FDOCT, the location of maximum sensitivity is the location of pathlength match with the reference delay, or in other words, the DC component of the spectral interferogram, and the sensitivity fall-off becomes worse farther from this location. This is explained above and schematically illustrated in Fig. 2, where the brightest background represents maximum sensitivity, and the background fading to gray represents the signal fall-off. Therefore, the two images record the identical sample structure, with identical focus and illumination and scanning parameters, but have different centers of maximum sensitivity. The two images are fused simply by cropping each at the location in the frame that is equidistant from the two locations of maximum sensitivity (regions bordered by thick dashed lines in Fig. 2a and 2b), then concatenating the images to form a single image (as illustrated in Fig. 2c). Thus, when a single image is formed by the concatenation of the two, the resulting single image includes the most sensitive parts of each and the −6dB effective image range is significantly increased.
Fig.2.

Method of image fusion. The thin dased line represents the DC line which is located at the middle of the images. The maximum sensitivity (bright background) is shown around the DC and then fades (gray background) due to fall-off. The upper part of (a) within the thick dashed-line region of interest was concatenated with the lower part of (b) within the region of interest to form the final image (c). δ× is the offset between the two reference arms. The −6dB effective imaging range is labeled in each image.
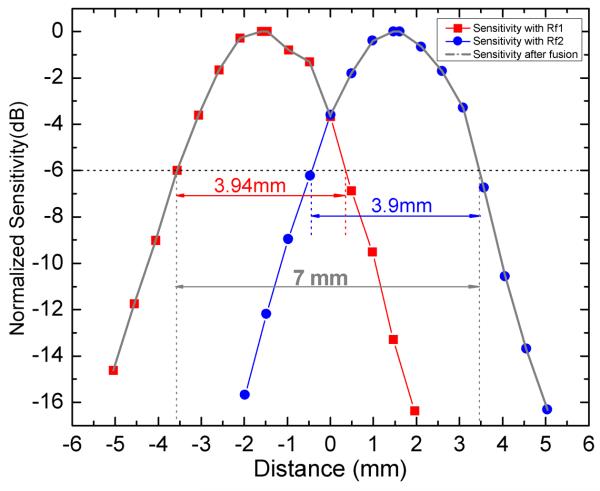
A mirror was first used to calibrate the optical path delay difference δx and transform the offset δx to the number of the pixels within the image frame. In our demonstration, the offset was 3.06 mm, or 301 pixels. To evaluate the imaging range increase, we measured the sensitivity as a function of depth for the two reference arms independently; The sensitivity curves are shown in Fig.3 offset 3.06 mm to demonstrate the sensitivity after image fusion. The effective imaging range (−6 dB range) for this SDOCT system using a single reference arm was 3.9 mm. The effective imaging range of the combined image was 7 mm, representing a factor of 1.8 improvement. In this demonstration, the signal at the range location equidistant from the peaks was −4 dB attenuated from the peak sensitivity. Theoretically if the reference delay difference δx were precisely tuned to 3.9 mm (the nominal effective range), then the signal at the range location equidistant from the peaks would be −6 dB, and the effective range would simply be doubled. Since the final image is simply the concatenation of the two original images, there is no sensitivity penalty, only the penalty of halving the effective image acquisition rate. It is clear that this concept could readily be extended to an arbitrary number n of reference paths making use of a 1×n fiber switch to further extend the effective imaging range n times and the penalty would be an n-times reduction of effective image acquisition rate. As in any OCT system, the depth of focus of the scanning optics will ultimately limit the range over which adequate signal strength and resolution can be achieved for high quality imaging.
Fig. 3.
Measured sensitivity of the SDOCT system with both separated reference arms. The effective imaging range is defined as the depth range within −6 dB of the peak of sensitivity and is indicated in the figure along with the effective imaging range of the demonstrated range-extended system.
In order to demonstrate image improvement by the proposed method, the endocardial wall of the right ventricle of a dog heart was imaged, as shown in Fig.4. The image encompasses a trabeculation and the endocardial wall that it passes over, creating a substantial step, as indicated in Fig. 4. Figs.4a and 4b show the images recorded using the two reference arms M2 and M1, respectively. In each case, the area of the tissue around the DC signal component (the faint straight line indicated in the figures) has maximum sensitivity. Fig.4d plots the equivalent A-scans from the same sample position indicated by the white arrows in Figs.4a and 4b. To reduce noise, 40 neighbor A-scans were averaged in Fig. 4d. It can be seen that the signal around the DC line is ~10 dB stronger than with the signal 3 mm away from the DC line due to fall-off, and that imaging depth is also greater with increased sensitivity. After image fusion, both parts of the tissue sample are visualized with maximum contrast, as shown in Fig. 4c.
Fig. 4.
Images of dog endocrinal tissue ex vivo. (a) and (b) are the images recorded alternately with the two separated reference arms (M1 and M2) . The image size is 1000 pixels (width) × 677 pixels (height). The faint horizontal lines shown in the images are the residual DC lines. (c) is the fused image resulting from (a) and (b). (d) Average of 40 neighboring A-scans at the location marked by the arrows in (a) and (b) demonstrating the advantage of the range extension.
The proposed method of extending the effective imaging range of FDOCT enjoys several advantages. First, although the technique was demonstrated using SDOCT, this method is equally applicable to SSOCT. Second, because the fiber switch has a very fast switch rate and can accommodate a broad spectral bandwidth, this technique is applicable to state-of-the-art ultrahigh resolution and high frame rate FDOCT systems. Third, because of the low cost of fiber optic switch and immunity from crosstalk between the different reference arms, this technique can be extended to a multiple route switch with several reference arms to further extend the effective imaging range, or potentially to dynamically track the motion of the surface of a sample.
The obvious drawback to this method is the trade off between the frame rate and effective imaging range because at least two frames are required, which are acquired serially. However, this limitation is mitigated in some cases for SDOCT by practical considerations. For example, for a larger imaging range with SDOCT, a linear array detector with a large number of pixels is desired. If the line rate is limited by the data transfer rate, the line rate of a 512-pixel line array is almost double of that of a 1024-pixel line array, but will provide half of the imaging range. The technique proposed here can use a 512-pixel line array to provide the equivalent effective imaging range as a 1024 pixel line array, if the two images are concatenated at the location of −6 dB from the peak sensitivity. This may reduce the cost of the photodetector linear array and simplify the optical design of the spectrometer. Because of the time delay between acquisitions of the two offset images, fast sample motion may limit use of this technique for in vivo imaging. However, state-of-the-art high-speed OCT systems with currently available high-speed spectrometers and swept light sources[13] can mitigate this limitation. In this work, we used the the B-scan Doppler shift method [10–12] to resolve the complex conjugate ambiguity. While convenient, this method relies on dense transverse sampling and can be strongly affected by sample motion, potentially limiting scan range and scan speed. However, the use of a fiber switch described here to extend image range does not rely on this particular complex conjugate resolution method, and other, more complicated, single-A scan methods may be employed if imaging speed becomes limited by motion [14–15]. Additionally, the previously demonstrated dual-reference arm method of image range extension [8] collects both signals in parallel, while the method proposed here collects them serially. The parallel method does not suffer from the 2× image rate cost, but it does suffer from degradation of signal quality due to increased noise bandwidth and crosstalk between channels. The technique proposed here does not increase the noise bandwidth of the signal nor does it increase loss of signal light, nor is it subject to crosstalk, so while image acquisition time is increased, image quality is preserved.
In summary, we have demonstrated a technique which can extend the effective imaging range for FDOCT using a high speed fiber optical switch and two reference arms. This method has been shown to increase the effective imaging range by a factor of 1.8 compared with conventional SDOCT with a single reference arm. Images of a tissue sample with a large step surface feature demonstrate the expected image quality improvement resulting from the increase of the effective imaging range. This simple and low cost method may enable use of FDOCT in applications requiring a relatively long imaging range.
Acknowledgment
The project described was supported by the National Institutes of Health (R24CA110943). The work was conducted in a facility constructed with support from Research Facilities Improvement Program Grant Number C06 RR12463-01 from the National Center for Research Resources, National Institutes of Health. The content is solely the responsibility of the authors and does not necessarily represent the official views of the National Institute of Health or the National Institutes of Health.
Full References
- 1.Cense B, Nassif N, Chen T, Pierce M, Yun S-H, Park B, Bouma B, Tearney G, de Boer J. Ultrahigh-resolution high-speed retinal imaging using spectral-domain optical coherence tomography. Opt. Express. 2004;12:2435–2447. doi: 10.1364/opex.12.002435. [DOI] [PubMed] [Google Scholar]
- 2.Hu Z, Pan Y, Rollins AM. Analytical model of spectrometer-based two-beam spectral interferometry. Appl. Opt. 2007;46:8499–8505. doi: 10.1364/ao.46.008499. [DOI] [PubMed] [Google Scholar]
- 3.Leitgeb R, Hitzenberger C, Fercher A. Performance of fourier domain vs. time domain optical coherence tomography. Opt. Express. 2003;11:889–894. doi: 10.1364/oe.11.000889. [DOI] [PubMed] [Google Scholar]
- 4.Huber R, Wojtkowski M, Fujimoto JG, Jiang JY, Cable AE. Three-dimensional and C-mode OCT imaging with a compact, frequency swept laser source at 1300 nm. Opt. Express. 2005;13:10523–10538. doi: 10.1364/opex.13.010523. [DOI] [PubMed] [Google Scholar]
- 5.Radhakrishnan S, Rollins A, Roth J, Yazdanfar S, Westphal V, Bardenstein D, Izatt J. Real-time optical coherence tomography of the anterior segment at 1310 nm. Archives of Ophthalmology. 2001;119:1179. doi: 10.1001/archopht.119.8.1179. [DOI] [PubMed] [Google Scholar]
- 6.Yabushita H, Bouma BE, Houser SL, Aretz HT, Jang I-K, Schlendorf KH, Kauffman CR, Shishkov M, Kang D-H, Halpern EF, Tearney GJ. Characterization of Human Atherosclerosis by Optical Coherence Tomography. Circulation. 2002;106:1640–1645. doi: 10.1161/01.cir.0000029927.92825.f6. [DOI] [PubMed] [Google Scholar]
- 7.Iftimia N, Bouma B, de Boer J, Park B, Cense B, Tearney G. Adaptive ranging for optical coherence tomography. Opt. Express. 2004;12:4025–4034. doi: 10.1364/opex.12.004025. [DOI] [PMC free article] [PubMed] [Google Scholar]
- 8.Motaghian Nezam SMR, Vakoc BJ, Desjardins AE, Tearney GJ, Bouma BE. Increased ranging depth in optical frequency domain imaging by frequency encoding. Opt. Lett. 2007;32:2768–2770. doi: 10.1364/ol.32.002768. [DOI] [PMC free article] [PubMed] [Google Scholar]
- 9.Podoleanu AG, Dobre GM, Webb DJ, Jackson DA. Simultaneous en-face imaging of two layers in the human retina by low-coherence reflectometry. Opt. Lett. 1997;22:1039–1041. doi: 10.1364/ol.22.001039. [DOI] [PubMed] [Google Scholar]
- 10.Leitgeb RA, Michaely R, Lasser T, Sekhar SC. Complex ambiguity-free Fourier domain optical coherence tomography through transverse scanning. Opt. Lett. 2007;32:3453–3455. doi: 10.1364/ol.32.003453. [DOI] [PubMed] [Google Scholar]
- 11.Baumann B, Pircher M, Güzinger E, Hitzenberger CK. Full range complex spectral domain optical coherence tomography without additional phase shifters. Opt. Express. 2007;15:13375–13387. doi: 10.1364/oe.15.013375. [DOI] [PMC free article] [PubMed] [Google Scholar]
- 12.An L, Wang RK. Use of a scanner to modulate spatial interferograms for in vivo full-range Fourier-domain optical coherence tomography. Opt. Lett. 2007;32:3423–3425. doi: 10.1364/ol.32.003423. [DOI] [PubMed] [Google Scholar]
- 13.Huber R, Wojtkowski M, Fujimoto JG. Fourier Domain Mode Locking (FDML): A new laser operating regime and applications for optical coherence tomography. Opt. Express. 2006;14:3225–3237. doi: 10.1364/oe.14.003225. [DOI] [PubMed] [Google Scholar]
- 14.Götzinger E, Pircher M, Leitgeb R, Hitzenberger C. High speed full range complex spectral domain optical coherence tomography. Opt. Express. 2005;13:583–594. doi: 10.1364/opex.13.000583. [DOI] [PMC free article] [PubMed] [Google Scholar]
- 15.Tao YK, Zhao M, Izatt JA. High-speed complex conjugate resolved retinal spectral domain optical coherence tomography using sinusoidal phase modulation. Opt. Lett. 2007;32:2918–2920. doi: 10.1364/ol.32.002918. [DOI] [PubMed] [Google Scholar]


