Abstract
Supplemental Immunization Activities (SIAs) have become an important adjunct to measles control efforts in countries that endeavor to achieve higher levels of population immunity than can be achieved in a growing routine immunization system. Because SIAs are often supported with funds that have alternative uses, decision makers need to know how cost-effective they are compared with other options. This study integrated a dynamic stochastic model of measles transmission in Uganda (2010–2050) with a cost model to compare a strategy of maintaining Uganda's current (2008) levels of the first dose of routine measles-containing vaccine (MCV1) coverage at 68% with SIAs with a strategy using the same levels of MCV1 coverage without SIAs. The stochastic model was fitted with parameters drawn from district-level measles case reports from Uganda, and the cost model was fitted to administrative data from the Ugandan Expanded Program on Immunization and from the literature. A discount rate of 0.03, time horizon of 2010–2050, and a societal perspective on costs were assumed. Costs expressed in US dollars (2010) included vaccination costs, disease treatment costs including lost productivity of mothers, as well as costs of outbreaks and surveillance. The model estimated that adding on triennial SIAs that covered 95% of children aged 12–59 months to a system that achieved routine coverage rates of 68% would have an incremental cost-effectiveness ratio (ICER) of $1.50 ($US 2010) per disability-adjusted life year averted. The ICER was somewhat higher if the discount rate was set at either 0 or 0.06. The addition of SIAs was found to make outbreaks less frequent and lower in magnitude. The benefit was reduced if routine coverage rates were higher. This cost-effectiveness ratio compares favorably to that of other commonly accepted public health interventions in sub-Saharan Africa.
Uganda reported a total of 1216 cases of measles for 2009 [1], which represents a dramatic decline from 5 years earlier, when there was an average of 28,000 cases per year [2]. Uganda's strategy is based on improving its routine delivery of the first dose of measles-containing vaccine (MCV1) given at 9 months of age, as well as regular supplementary immunization activities (SIAs). The MCV1 coverage estimated by the World Health Organization (WHO)–United Nations Children’s Fund was 68% for 2008. The objective of the SIAs is to increase population immunity by (1) reaching those children who were not reached through the routine immunization program (32% of the birth cohort in the case of Uganda) and (2) immunizing those children that were reached through routine services but did not seroconvert (about 85% of the 68% of children reached). In 2003, Uganda conducted a “catch-up campaign” and achieved an average coverage rate of 105% among its target population of children aged 6 months to 14 years [2]. (A coverage rate of >100% is an artifact of the way coverage is calculated as the ratio between doses delivered and a sometimes incorrect demographic estimate of the number of eligible children.) A supplemental measles immunization campaign (along with polio immunization) was carried out in 15 northern districts in 2005. That campaign achieved 100% coverage among 9–23-month-old children. A follow-up campaign was subsequently carried out in 2006, targeting 6–59-month-old children, resulting in a national rate of coverage of 99.5%. Another follow-up SIA was conducted in 2009 targeting children aged 9–47 months that achieved 104% coverage, and planners hope to continue to conduct follow-up SIAs every 3 years.
SIA campaigns require financing and political commitment for their planning and support. Competition for the scarce resources of public sector finance, administrative costs, and the demands on health worker time make it important to justify the value of SIAs by estimating their contribution to human health. To estimate the benefit of SIAs, this project developed a dynamic stochastic model of measles transmission and integrated it with economic models of measles vaccination efforts. The results of this work can be used by planners to decide how the value of follow-up SIAs compares to that of other investments in human health.
METHODS
We integrated a dynamic measles model with an economic model of disease control costs to examine the cost-effectiveness of conducting SIAs in Uganda.
Scenarios Considered
For validation purposes, a natural history model (“natural scenario”) was assessed in which measles cases and costs were estimated for the hypothetical situation in which Uganda never introduces measles vaccine. For policy purposes, we compared a “no SIAs scenario” in which Uganda continues its current level of performance in routine MCV1 delivery but conducts no SIAs from 2010 onward with a “with SIAs scenario” in which routine MCV1 coverage is identical but follow-up SIAs targeting children aged 9–59 months are carried out every 3 years during the period from 2010 through 2050. The SIAs are assumed to achieve a coverage rate of 95%.
Epidemiological Model
The model is calibrated to have a 40-year horizon from 2010 through 2050 and a 2-week time step. The model is a dynamic, stochastic version of a susceptible, immune, recovered model with age structure and 2 compartments: a core (main) and a satellite (accessory) population to depict heterogeneity in vaccine coverage. Little is known about rates of epidemiological contact between all the areas of Uganda regarding measles. Simulating multiple geographic areas in the country would proliferate unsupportable assumptions about pairwise mixing rates. As a compromise, the model just depicts 2 epidemiologically linked populations and varies a contact matrix in sensitivity analysis.
The 5 age groups are infants (6–11.5 months), toddlers (1–5 years), children (6–15 years), adults (16–45 years), and seniors (≥46 years). Excluding infants aged <6 months because of protection by maternal antibodies improves the plausibility of the assumption of homogeneous susceptibility for unvaccinated infants. The population is scaled to equal 1 million on 1 January 2010. Thereafter, it grows at the rate projected by the United Nations (UN) until 2050 and maintains the population age pyramid of Uganda as projected by the UN until 2050 [3]. Demographic projections of fertility rates and age-specific mortality rates were drawn from UN population data and interpolated to fit the 2-week time step.
The following state variables are updated every 2 weeks: Shit (susceptible individuals), Vhit (individuals immune through vaccination), Ihit (infectious individuals), and Rhit (recovered individuals) (Figure 1). Subscript “h” denotes which population compartment is being described, subscript “i” denotes which age group, and subscript “t” denotes the time period. A family of equations modeled the force of infection as λt = βM(StItα), where βM is a set of monthly infectiousness parameters for seasonality and α adjusts for discrete time. The number of new infections was stochastically updated every 2 weeks using a negative binomial function according to It + 1 ∼ NegBin(It, λt) [4, 5]. There is also a regular inflow of 2 immigrant measles cases every 2 weeks to overcome the problem of stochastic extinction. The monthly infectiousness parameters, βM, for Uganda were derived from an analysis of district-level case reports from Uganda where there are district-level annual cases series from January 2001 through December 2006 and from monthly case series by district from January 2007 through May 2009. Appendix 1 [online] describes how βM was derived from the case reports.
Figure 1.
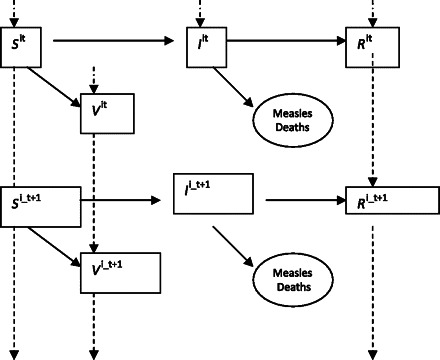
Schematic depiction of compartmental model of measles transmission and recovery.
Extensions to the dynamic model imposed age and compartmental structure by depicting λt, St, and It as vectors with elements for age group and compartment. The product of each element of S with each element of I is multiplied by a constant drawn from a contact matrix. Various assumptions for the structure of the contact matrix were tested in sensitivity analysis. The baseline structure assumed that age mixing would occur in a standard household in which children are separated by birth intervals of 24 months and there are 2 adults aged 16–45. The children would coreside with 1.5 individuals aged >45 years. Alternatives were considered in which school attendance enhanced the mixing of children aged >5 years, in which there was no mixing, and in which all mixing was homogeneous throughout the population.
Cost Model
The cost model included the costs of routine MCV1, SIAs, measles treatment, parent productivity lost to measles, outbreak control, and surveillance and constitutes a societal perspective. Detailed parameters and calculations are given in Appendix 2. The time horizon is 2010–2050, with a baseline 3% discount rate that is applied to both costs and disability-adjusted life years (DALYs) and varied to 0% and 6% in sensitivity analysis. The cost of immunizing 1 child through routine MCV1 is assumed to be $1 [6]. The cost of immunizing 1 child through an SIA in 2010 is estimated to be $0.58 per child immunized. This estimate was derived from the Ugandan Expanded Program on Immunization estimates of $0.37, $0.56, and $0.51 per child reached by an SIA in $US (2008) for the Ugandan SIAs conducted in 2003, 2006, and 2009, respectively. These costs were inflated to 2010 using the Ugandan price index and averaged to reach the estimate of $0.58.
Little is known about the medical costs of measles in Uganda. The baseline model assumes that for every 100 measles cases there would be 50 primary care visits, 200 lost parent productivity days, and 10 hospital bed days. The costs of inpatient stays subsumed the medical costs of all severe acute complications of measles, such as dehydration and pneumonia. The unit costs of medical utilization were derived from WHO–Choosing Interventions That Are Cost Effective [7]. Productivity days were valued at gross domestic product (GDP) per capita. Measles-related encephalitis was conservatively assumed to have an incidence of 1.5 cases per 10,000 cases of measles and to result in 14 inpatient days per case and 10 lost years of GDP per capita per case [8]. These assumptions are varied by ±20% in sensitivity analysis.
Measles DALYs lost were relative to Uganda's life expectancy at the midpoint of each group: 55 years at age 1, 53 at age 3, 48 at age 10, and 31 at age 30 [9]. The effect of disability due to acute measles was ignored because of the relative brevity of measles. Case fatality rates were age specific: 6% at age 6–12 months, 3% at age 1–5 years, and 1.5% at age ≥6 [10]. The case fatality rates were projected to decline annually until 2050 at the same rate as the declines in mortality among children aged <5 years projected by the UN [3]. Model parameters are given in Table 1.
Table 1.
Parameters for Cost and Epidemiological Model
| Parameter | Value | Source |
| Average cost per child vaccinated prior to scale-up via routine services, $ | 1.00 ± 0.20 | [6] |
| SIA cost per child, $ | 0.58 | EPI Uganda |
| SIA frequency | Every 3 years | EPI Uganda |
| SIA vaccination coverage rate, % | 95 | Assumptiona |
| Routine MCV coverage rate, % | 68 | [17] |
| Age at routine MCV, months | 9–12 | EPI Uganda |
| Age at SIA vaccination, months | 12–59 | EPI Uganda |
| Monthly force of infection parameters | Analysis of Uganda district case reports 2002–2008 | |
| Jan | 0.00006392 ± 20% | |
| Feb | 0.00007325 ± 20% | |
| Mar | 0.0000809 ± 20% | |
| Apr | 0.0000857 ± 20% | |
| May | 0.00007162 ± 20% | |
| Jun | 0.00010455 ± 20% | |
| Jul | 0.00007821 ± 20% | |
| Aug | 0.0000761 ± 20% | |
| Sep | 0.00007831 ± 20% | |
| Oct | 0.00008567 ± 20% | |
| Nov | 0.00007201 ± 20% | |
| Dec | 0.00008348 ± 20% | |
| Initial proportion vaccinated among adults, children, and toddlers | 0.59–0.77 | WHO coverage database |
| Initial measles case fatality rate | [10] | |
| Infant | 0.06 | |
| Toddler | 0.03 | |
| Child | 0.015 | |
| Adult | 0.015 | |
| Life expectancy, years | [9] | |
| Infant | 54.8 | |
| Toddler | 52.8 | |
| Child | 47.9 | |
| Fertile adult | 31.4 | |
| Postfertile adult | 20 | |
| Fraction of population in satellite compartment, % | 25 | [2] |
| Initial population size, millions | [3] | |
| Infant | 1.29 | |
| Toddler | 4.12 | |
| Child | 8.49 | |
| Fertile adult | 11.60 | |
| Postfertile adult | 10.49 |
NOTE. EPI, Expanded Program on Immunization; MCV, measles-containing vaccine; SIA, supplemental immunization activity; WHO, World Health Organization.
EPI Uganda reports 100% coverage.
MODEL RESULTS
Model Validation
Figure 2 shows our model of the natural history of measles epidemics in Uganda. The cycle shows a frequency of measles spikes of every 3 years, which fits historical data from other unvaccinated populations [11]. Unfortunately, Uganda does not have historical measles case-series data for unimmunized populations. Between epidemics, the model differs from what would be seen in national statistics. The model can exhibit zero endogenous cases between cycles, whereas national data on measles in an unimmunized population would not do this. National statistics on measles epidemics in Africa seldom have months with zero cases, because they pool together data from multiple regions that have a high degree of epidemiological isolation. In populations with poor vaccination coverage residing in multiple unlinked communities, there is typically some measles somewhere in between epidemics. In contrast, the model only includes 2 linked metapopulations, and it can easily extinguish its pool of susceptible children after an epidemic.
Figure 2.
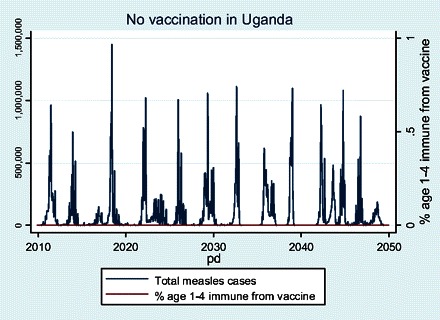
Natural history of measles dictated by parameters chosen for Uganda assuming no vaccination.
We also validated the model by comparing it to case report data from Uganda. Using the method of susceptible reconstruction, the reporting fraction for Uganda was estimated at 32% (see Appendix 1). This factor was used to correct the case reports and make them comparable to those that would come from the computer model, where all cases are detected. The corrected case report data set leads to an estimate of 1.97 measles cases per 1000 births (interquartile range [IQR], 0.51–7.89) for 2002–2008 in Uganda. The computer model estimates of measles incidence from a population that would have the same rate of vaccination coverage as that in the case report data had a median of 5.3 measles cases per 1000 births (IQR, 0.02–76.6). This shows that the computer model leads to estimates of measles incidence centered in a range similar to that of the case report data. The wide IQR in the model occurs because the negative binomial process for the force of infection is capable of wide dispersion, which is likely to be more apparent given 1000 iterations of biweekly draws than in the less extensive Ugandan case reports. The model also showed higher spikes than did the corrected monthly case report data.
Figure 3 shows the cumulative number of measles cases by age for the no vaccination scenarios. O'Donovan published cumulative incidence of hospital admissions for measles and found comparable numbers of 47% by age 12 months and 90% by age 60 months [12]. Because O'Donovan was observing cases that involved hospitalization, his data would naturally be skewed toward younger children, in whom measles morbidity is known to be more severe. A more appropriate comparison might be a cross-country examination of cumulative seropositivity for measles in an unvaccinated population where the cumulative incidence in the most severely affected prevaccine population was found to be 18% and 80% in 12-month-olds and 60-month-olds, respectively [13]. This compares favorably with unvaccinated populations in our model.
Figure 3.
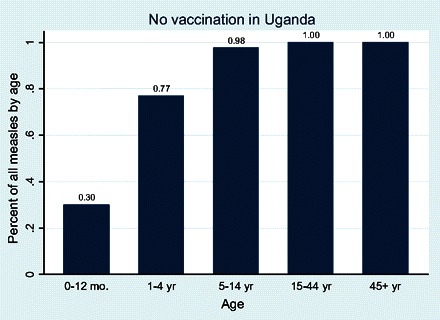
Cumulative measles infections by age group in Uganda under the no vaccination scenario.
Figure 4 shows the epidemic curves for toddlers aged 1–4 years with cases per year overlain with a plot of the prevalence of children aged 1–4 years who are immune to measles from vaccination. The scenarios with SIAs show the presence of SIAs as rectangular upticks in immunity occurring every 3 years in Uganda. The scenario of stopping SIAs after 2010 leads to more frequent epidemics than would occur in the baseline situation in which routine coverage and SIA policies are frozen in place.
Figure 4.
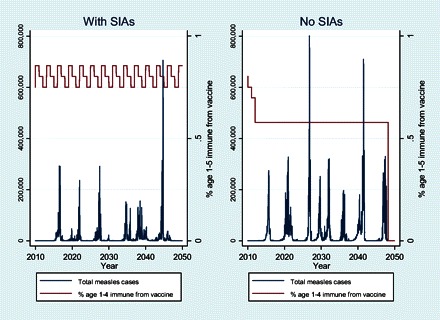
Epidemic curves for the 2 scenarios in Uganda. Left y-axis shows number of measles cases (blue). Right y-axis shows the proportion of children aged 1–5 years who are immune as a result of vaccine receipt.
Figure 5 plots the 40-year discounted sum of total measles costs against the 40-year sum of discounted DALYs. One hundred iterations are shown for each policy scenario. Decision makers are assumed to prefer points that are lower on the vertical axis because these have lower cost and to prefer points that are farther to the left on the horizontal axis because these have fewer DALYs. One can see from Figure 5 that the baseline scenario in which routine coverage is frozen at 68% while SIAs are continued every 3 years imposes similar costs but has 5 million fewer DALYs than maintaining the same routine coverage with no SIAs. In the “with SIAs” strategy, the model projects a total of 136,120 ± 19,815 discounted measles deaths and 3.5 million ± 506,000 discounted measles DALYs from 2010 through 2050. This is 5 million fewer DALYs than a strategy without SIAs. The with SIAs scenario incurs a total discounted cost over 40 years of $94 ± 2.3 million. SIAs account for 39% of this cost. The “no SIAs” scenario in Uganda would lower costs to $87 ± 2.4 million during the same period. Roughly $4.2 million in SIA direct operational costs would be averted by discontinuing them but replaced by $3.5 million in health care costs for the additional measles cases.
Figure 5.
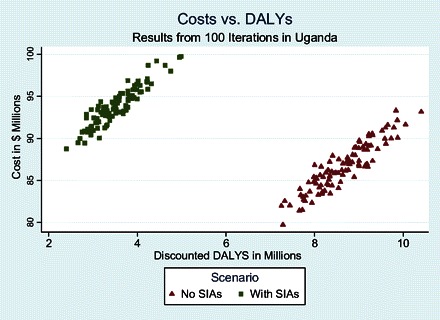
Costs vs measles disability-adjusted life years (DALYs) in Uganda for the scenarios with and without supplemental immunization activity.
For a decision maker at the no SIAs position, adding SIAs will improve health but lead to somewhat higher costs. The slopes of the lines from the no SIA scenarios to the with SIAs scenarios in Figure 5 are called incremental cost effectiveness ratios (ICERs) and are shown in Table 2. They were estimated by repeatedly constructing line segments joining 1 realization of the no SIAs scenario to 1 realization from the baseline scenario and calculating slopes. Two hundred iterations were conducted to generate a distributional range of ICER estimates in order to summarize median and interquartile range. (Because ICERs are the quotient of 2 random variables, they are not normally distributed and a 95% confidence interval would be inappropriate.) The median ICER is estimated at $1.5 (interquartile range, $0.8–$2.2).
Table 2.
Costs, Deaths, Disability-Adjusted Life Years (DALYs), and Incremental Cost-Effectiveness Ratios (ICERs) for Uganda with 3% Discounting and Horizon to the Year 2050
| Scenario | Discounted deaths, mean ± SD | Δ Discounted deaths averted relative to no SIAs, mean ± SD | Δ Discounted DALYs averted relative to no SIAs level of 17,489,545, mean ± SD | Discounted costs, mean $ millions ± SD | Δ Discounted costs relative to no SIAs, mean $ ± SD | ICER $ per death averted, median $ (IQR) | ICER per DALY averted, median $ (IQR) |
| Natural | 1,206,143 ± 33,778 | … | … | 196 ± 4.2 | … | … | … |
| No SIAs | 331,729 ± 25,165 | … | … | 87 ± 2.8 | … | Reference | Reference |
| With SIAs | 135,990 ± 19,026 | 194,539 ± 33,841 | 5,909,410 ± 900,440 | 94 ± 2.3 | 7 ± 3.9 | 39 (20–58) | 1.5 (0.8–2.2) |
NOTE. IQR, interquartile range; SD, standard deviation; SIA, supplemental immunization activity.
Figure 6 shows the components of costs in each scenario and includes a comparison with the costs of measles if Uganda had never adopted measles vaccine (top bar labeled “Natural”). The analysis confirms that measles vaccination as currently practiced in the with SIAs scenario is indeed cost saving—the costs of the program are less than half what the medical and social costs of measles would be with no vaccination. The no SIAs scenario has slightly lower costs than the with SIAs scenario, but Figure 6 shows that the cost components differ. The no SIAs scenario generates a discounted value of costs of measles disease estimated at $60.8 million (interquartile range, $58.4–$62.5) between 2010 and 2050. By comparison, the with SIAs scenario has median costs of measles disease of $25.2 million (interquartile range, $24.3–$26.9) and a constant estimate of SIA operational costs at $42 million. Thus, stopping SIAs saves the costs of SIAs, but the newly incurred costs of the additional cases of measles undermine most of the savings.
Figure 6.
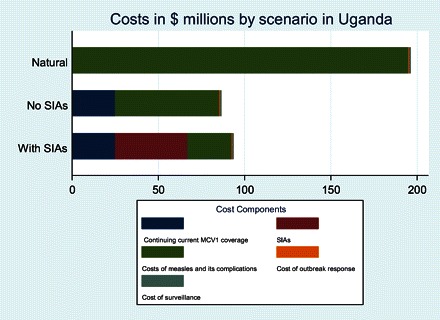
Cost structure between measles control scenarios in Uganda. Costs are cumulative discounted costs from 2010 to 2050, calculated as the average of 100 iterations of each scenario. SIA, supplemental immunization activity.
Univariate sensitivity analysis (Figure 7) confirmed that SIAs were cost-effective across the entire range of parameters tested. The analysis showed that varying the mixing rate had the largest effect on the ICER. When mixing rates between age cohorts are zero and children are assumed to infect only their own age cohort, the ICER for SIAs is $9.8 per DALY averted. Conversely, when children are just as likely to infect a member of another age group as a member of their own age group, the ICER is $1.6. SIAs are more cost-effective when the force of infection of measles is stronger; this should be relevant to populations with higher prevalence of human immunodeficiency virus. A shorter time horizon of 2030 made SIAs slightly more cost-effective, because more of the life saving of SIAs occurs between 2010 and 2030 when case fatality rates are higher than later in the century when measles is projected to be less lethal as a result of improvements in public health.
Figure 7.
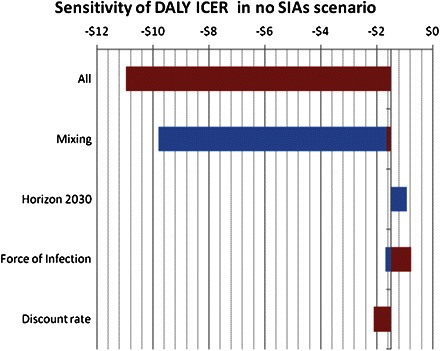
Tornado diagram showing the range of incremental cost-effectiveness ratios (ICERs) for supplemental immunization activities (SIAs). The widths of the bars show the variation in ICER as each parameter is varied from lower bound to upper bound. DALY, disability-adjusted life year.
DISCUSSION
This analysis has estimated the ICER for continuing to conduct SIAs for measles in Uganda at $1.50 per DALY. To put this value in context, one could compare this estimate with other estimates of public health interventions that were considered to be “best buys” by the Disease Control Priorities Project 2 [18]. This project gathered teams of epidemiologists and economists to estimate the cost-effectiveness of addressing a variety of problems in global health. Table 3 lists the results of the project, showing sub-Saharan African ICERs for some of the best options in sub-Saharan Africa, compared with the current estimate of $1.50 per DALY averted.
Table 3.
Cost-Effectiveness of Supplemental Immunization Activities (SIAs), Compared With Other Public Health Interventions
| Disease or condition | Cost-effectiveness in sub-Saharan Africa, US$/DALY | Intervention |
| SIAs for measles in Uganda | 1.50 | SIAs every 3 years covering 95% of children aged 12–59 months |
| Malaria | 7 | Intermittent preventive treatment in pregnancy with drug other than sulfadoxinepyrimethamine |
| African trypanosomiasis | 10 | Melarsoprol |
| Malaria | 11 | Insecticide-treated bednets |
| African trypanosomiasis | 15 | Case finding and treatment |
| Malaria | 17 | Residual household spraying |
| Malaria | 19 | Intermittent preventive treatment in pregnancy with sulfadoxinepyrimethamine |
| African trypanosomiasis | 20 | Eflornithine |
| Integrated management of childhood illness | 39 | Integrated management of childhood illness |
| HIV/AIDS | 57 | Diagnosis and treatment of sexually transmitted infections |
| Diabetes mellitus | 60 | Lifestyle intervention (prevention of type 2 diabetes mellitus) |
| HIV/AIDS | 82 | Condom promotion and distribution |
| HIV/AIDS | 84 | Blood and needle safety |
| Maternal mortality | 87 | Improved quality of comprehensive emergency obstetric care |
| Maternal mortality | 88 | Increased primary care coverage |
| Tuberculosis and HIV/AIDS | 121 | Prevention and treatment of tuberculosis coinfection |
NOTE. Data on SIAs in Uganda are from the current study; remaining data are from Jamison et al 2006 [18]. DALY, disability-adjusted life year; HIV, human immunodeficiency virus.
It is notable that many ministries of health in low-income countries invest their local resources in the services shown in Table 3 despite very low overall health spending per capita. Uganda's government spends $7 per person per year on health as of 2008 [14]. Uganda should be more willing to support continued SIAs than most of the current portfolio of services, because SIAs are a more cost-effective approach to produce health than are other interventions currently supported.
Our estimates have both strengths and limitations. One of the strengths is the use of a dynamic measles transmission model fit to the epidemiological characteristics of Uganda itself. The dynamic model is able to show how the buildup of susceptible children after SIAs are stopped can lead to larger and more frequent outbreaks. One limitation of the exercise was the need to invoke assumptions to parameterize an age-specific contact matrix for measles transmission. Another limitation was that we had to make assumptions about care-seeking behavior to estimate the cost of a typical case of measles. The effect of these assumptions was quantified using sensitivity analysis.
Our estimate of cost-effectiveness is lower than an estimate for India of 430 INR per DALY ($9.50 in 2010 US dollars) [15]. One important methodological difference is that the Indian estimate assumed that the SIA would reach only 75% of children, as opposed to our assumption of 95% coverage. Furthermore, the study for India did not include the cost offset from avoided medical care costs of prevented measles cases. These cost savings were shown to make a large contribution to lowering the net cost of the SIA strategy.
Part of why SIAs are so cost-effective in Uganda is related to the current vaccination coverage rate of 68%. The value of SIAs was computed relative to a strategy that kept routine coverage rates frozen at this low level. Experiments with the model revealed that the cost-effectiveness of maintaining SIAs is less attractive if routine coverage rates are higher. This is expected, as 1 of the 2 benefits of SIAs is to increase population immunity among children that have not been reached though routine services. Thus, as routine services and vaccination coverage improve, the cost-effectiveness of the SIAs will be reduced. Thus, readers should be hesitant to extrapolate the $1.50 ICER to other countries with substantially higher rates of routine coverage. However, our experience is that even at higher levels of routine coverage, SIAs seem to be cost effective. The same model was applied to Bangladesh, where coverage rates are 88%, and on the basis of estimates of Bangladeshi health system costs, the model generated an estimated median ICER of $19.2 (IQR, $13.5–$28.9) [16]. Thus, the cost-effectiveness of SIAs is not eliminated even when routine coverage rates approach 90%.
One can summarize our main point by imagining a Ugandan health planner who decided to stop SIAs in order to invest the savings in other interventions where they would do more good. Our estimates indicate that it would be extremely difficult for this policy maker to find any other investment of these funds that would improve the health of Uganda as much as SIAs against measles would.
Supplementary Data
Supplementary data are available at http://www.jid.oxfordjournals.org/ online.
Acknowledgments
Helpful comments on the modeling were obtained from Justin Lessler and Derek Cummings courtesy of the Vaccine Modeling Initiative. Sunmin Lee provided valuable assistance with data collection and manuscript preparation.
Funding
This work was supported by the World Health Organization and the Bill and Melinda Gates Foundation.
References
- 1.World Health Organization Regional Office for Africa. AFRO measles surveillance feedback bulletin. WHO; 2009. [Google Scholar]
- 2.United Nations Children’s Fund (UNICEF) and World Health Organization (WHO) Immunization summary: a statistical reference containing data through 2008 (2010 edition). New York, Geneva: UNICEF and WHO; 2010. [Google Scholar]
- 3.United Nations: World population prospects data. New York: United Nations: 2008. [Google Scholar]
- 4.Bjornstad ON, Finkenstadt BF, Grenfell BT. Dynamics of measles epidemics: estimating scaling of transmission rates using a time series SIR model. Ecol Monogr. 2002;72:169–84. [Google Scholar]
- 5.Finkenstadt BF, Grenfell BT. Time series modelling of childhood diseases: a dynamical systems approach. Appl Statist. 2000;49:187–205. [Google Scholar]
- 6.Brenzel L, Wolfson L, Fox-Rushby J, Miller M, Halsey NA, editors. Vaccine–preventable disease. 2nd ed. New York, NY: Oxford University Press; 2006. [Google Scholar]
- 7.Tables of costs and prices used in WHO-CHOICE analysis. World Health Organization website. 2010. http://www.who.int/choice/costs/en/. Accessed March 2010. [Google Scholar]
- 8.Modlin J, Jabbour J, Witte J, Halsey N. Epidemiologic studies of measles, measles vaccine, and subacute sclerosing panencephalitis. Pediatrics. 1977;59:509–12. [PubMed] [Google Scholar]
- 9.World Health Organization. Life tables for WHO member states, Uganda 2006. Geneva, Switzerland: World Health Organization; 2007. [Google Scholar]
- 10.Wolfson LJ, Grais RF, Luquero FJ, Birmingham ME, Strebel PM. Estimates of measles case fatality ratios: a comprehensive review of community-based studies. Int J Epidemiol. 2009;38:192–205. doi: 10.1093/ije/dyn224. [DOI] [PubMed] [Google Scholar]
- 11.Cliff A, Hagget P, Smallman-Raynor M. Measles: an historical geography. Cambridge, MA: Blackwell; 1993. [Google Scholar]
- 12.O'Donovan C. Measles in Kenyan children. East Afr Med J. 1971;48:526–32. [PubMed] [Google Scholar]
- 13.Black FL. Measles antibody prevalence in diverse populations. Am J Dis Child. 1962;103:242–9. doi: 10.1001/archpedi.1962.02080020254011. [DOI] [PubMed] [Google Scholar]
- 14.Uganda Ministry of Health. Annual health sector performance report for the financial year 2008/09. Kampala, Uganda: Uganda Ministry of Health; 2009. [Google Scholar]
- 15.Dabral M. Cost-effectiveness of supplementary immunization for measles in India. Indian Pediatr. 2009;46:957–62. [PubMed] [Google Scholar]
- 16.Bishai D. Cost effectiveness of measles eradication final report to WHO. Baltimore, MD: Johns Hopkins Bloomberg School of Public Health; 2010. [Google Scholar]
- 17.WHO/UNICEF estimates of immunization coverage. World Health Organization website, 2010. http://www.who.int/immunization_monitoring/routine/immunization_coverage/en/index4.html. Accessed March 2010. Updated 27 January 2011. [Google Scholar]
- 18.Jamison DT, Evans DB, Alleyne G, et al. Disease control priorities in developing countries. 2nd ed. Oxford, UK: Oxford University Press; 2006. [PubMed] [Google Scholar]


