

Abstract
13C chemical shift images acquired following intravenous injection of hyperpolarized [1-13C]pyruvate into rats with implanted C6 gliomas showed significant labeling of lactate within the tumors but not in surrounding brain tissue. Signal from pyruvate was observed in blood vessels above the brain and from other major vessels elsewhere in the rat head. Pyruvate was largely undetectable within the tumor or surrounding normal brain tissue. The ratio of hyperpolarized 13C label in the injected pyruvate and endogenous lactate was decreased from 0.25 +/− 0.13 to 0.13 +/− 0.08, (a reduction of 48%) at 96 h following whole brain irradiation with 15 Gy. These data suggest that hyperpolarized [1-13C]pyruvate may be useful in detecting treatment response in gliomas, where the use of 18FDG-PET is limited by the high background signals from normal brain tissue.
Keywords: glioma, radiotherapy, pyruvate
INTRODUCTION
Changes in tumor metabolism can give an earlier indication of treatment response than changes in tumor size and for this reason there has been considerable interest in the development of imaging methods that can detect changes in metabolism and other aspects of tumor biology following treatment (1). Currently one of the most widely used functional imaging techniques for monitoring treatment response in the clinic is to measure uptake of the glucose analog, 18Fluoro-2-deoxyglucose, using positron emission tomography (FDG-PET). Studies in lung, breast, oesophageal, lymphoma and ovarian cancer have all demonstrated that reduced FDG uptake can identify early treatment response (1). FDG-PET however is not effective in all tumor types and in brain tumors high uptake by surrounding normal brain tissue can mask high uptake by the tumor itself (2,3).
Glycolytic rate in human gliomas, however, has been correlated with tumor lactate concentration, suggesting that detection of increased lactate concentration with, for example, 1H MRS, might provide a similar diagnostic readout to that provided by FDG-PET in other tumor types (4,5). While 1H NMR spectroscopy can detect lactate in gliomas, this approach is limited by the relatively low lactate signal and the need to separate the signal from overlapping lipid resonances, which has restricted widespread clinical application of this approach.
Detection of lactate 13C labeling, using 13C magnetic resonance spectroscopic imaging, following injection of hyperpolarized [1-13C]pyruvate offers an alternative and more sensitive way to detect tumor lactate, as well as providing information on lactate dehydrogenase (LDH) activity. In studies in a murine lymphoma model, lactate labeling was shown to be due predominantly to passive exchange of 13C label between injected hyperpolarized [1-13C] pyruvate and the relatively large endogenous lactate pool (6,7). In studies on isolated lymphoma cells increasing the lactate concentration was shown to increase the rate of label exchange and the amount of labeled lactate observed. In drug-treated tumors the exchange showed an early decrease in rate due to loss of the coenzyme (NAD(H)) and a loss of LDH activity (6,8). Thus the experiment can provide an early indication of treatment response. We show here that this experiment can also be used to detect lactate in a rat brain glioma model and that lactate labeling was decreased following radiotherapy.
Methods
Hyperpolarization of [1-13C] pyruvate samples
Samples of pyruvic acid (30 mg), containing 15 mM OX-063 and 2 mM of the gadolinium chelate ProHance were polarized in an Oxford Instruments Hypersense polarizer. The hyperpolarized sample was dissolved in 4.5 ml of a superheated buffer (~180°C, ~10 bar) comprising 40 mM HEPES, 94 mM NaOH, 30 mM NaCl and 50 mg/L EDTA. The pH of the dissolved sample was 7.4, with a final [1-13C]pyruvate concentration of 75 mM.
C6 glioma growth
C6 glioma cells were purchased from the American Tissue Culture Collection (ATCC, Rockville, MD) and grown in Dulbecco’s modified Eagle’s medium (DMEM, Gibco, USA) containing 10% fetal bovine serum and 2 mM glutamine (Sigma Aldrich, St. Louis MO,USA). Upon reaching ~80% confluence, the cells were washed once with PBS, trypsinized with 1 ml of a 0.4% trypsin solution (Gibco, USA) washed twice and then resuspended in ice-cold PBS.
Tumors were implanted into male Wistar rats by cell injection. The head was held in a stereotaxic jig (BenchMark, Leica Microsystems, St. Louis MO) and a central dorsal incision of approximately 2 cm was made. The bregma was identified and a hole drilled through the skull at a point 2 mm anterior and 1.5 mm to the right of the bregma. Cells (5 μl containing 106 cells) were injected over the course of 2 minutes at a depth of 1.5 mm.
The animal was placed in a purpose built cradle containing a warm water bed and anesthetic delivery system, with a nosecone-mounted 13C tuned surface coil placed above the head. The animal holder was inserted into a birdcage proton imaging coil and the entire assembly was situated within the isocenter of a 4.7T magnet connected to a Bruker spectrometer. The transmit-receive 13C surface coil was inductively coupled to a passive surface coil situated below the head.
1H MRI
Rapid acquisition with relaxation enhancement (RARE) T2-weighted images were acquired from a 40.5 × 40.5 mm field of view, with a data matrix of 256 × 192 zero-filled to 256 × 256, giving a nominal in-plane resolution of 0.158 × 0.158 mm2 and a slice thickness of 2 mm. The repetition time was 5 s, with an effective echo time of 65.16 ms and an inter-echo spacing of 8 ms. Sixteen echoes were acquired per excitation, and four averages per phase encoding line. Fast low-angle shot (FLASH) T1-weighted images were acquired from the same slice with a 256 × 256 data matrix. The repetition time was 300 ms, with an echo time of 4.55 ms. Four averages were acquired per phase encoding line, and the pulse tip angle was calibrated to be 60 degrees. For T1 contrast enhancement, one ml of a 50 mM solution of Magnevist (Schering AG, Germany) in PBS was administered i.v. over the course of 30 seconds. FLASH images were collected before injection and immediately upon completion of the injection.
13C NMR spectroscopy
Spectra were acquired with a spectral width of 6009 Hz, collected into 512 complex points for a spectral resolution of 11.73 Hz per point (TR 1 s, the flip angle less than 5 degrees). Two ml of 75 mM hyperpolarized [1-13C]pyruvate were injected into the tail vein via a polyethylene line. Signal acquisition was begun before injection of the polarized compound, and repeated once per second over the course of four minutes.
13Cchemical shift images were acquired 20 seconds after the pyruvate injection from a 40.5 × 40.5 mm field of view in a 6 mm axial slice through the tumor, with a data matrix of 16 × 16, giving an in plane resolution of 2.53 × 2.53 mm2 (spectral width of 6009 Hz, TR 43 ms and flip angle less than 5 degrees). The total time required to acquire an image was approximately 11 seconds.
60Co irradiation of glioma-bearing rats
Glioma-bearing rats were given an IP injection of 80–100 mg/kg Ketamine, and 5–10 mg/kg Xylazine in a solution of 0.9% saline. The beam of the 60Co irradiator was collimated to produce an irradiation field of approximately 16 cm by 5 cm, and further shielding was obtained using lead blocks to cover the nose and neck. The whole brain was exposed to a dose of 15 Gy. Exposure was calibrated using thermoluminescent dosimeters (TLD) embedded in the middle of 3.0 cm3 Lucite (Total Plastics Inc., Baltimore, MD) blocks, in order to approximate absorbed dose in the brain. These TLD readings gave a dose rate of 153.6 +/− 2.4 rad/min in the unshielded areas, and 4.0 and 5.4 rad/min under the lead nose and body shields, respectively.
Tumors were imaged beginning at 10 days after implantation, using contrast agent enhanced T1-weighted FLASH images, T2-weighted RARE images and using 13C CSI following administration of hyperpolarized [1-13C] pyruvate. At this time the tumors were between 4 and 10 mm in diameter. The contrast agent enhanced images showed that opening of the blood-brain took approximately 10–12 days following tumor cell implantation. Twenty-four hours after imaging the animals were irradiated with 15 Gy. Post-treatment imaging was started 24 h after irradiation, and the animals were followed longitudinally and re-imaged at combinations of 24, 48 72 and 96 h after treatment. Most animals were imaged 2–3 times after therapy, depending on their health status.
Data analysis
13C CSI data were analyzed using Matlab (Mathworks, Natick, MA). The data were zero-filled to 256 × 256 to match the resolution of the proton images. Lactate and pyruvate peak integrals were calculated from baseline-corrected spectra in absolute value mode. The T2-weighted RARE images were used to define a region of interest comprising the tumor, and the mean intensity of lactate from the region was calculated. This number was normalized to the maximum pyruvate signal in the image, which was most often located in a nearby blood vessel above the brain. A similar analysis was performed using contrast-enhanced T1-weighted FLASH images to define the tumor regions that consisted of either the whole tumor or only the enhancing region of the tumor.
Results
The glioma tumors presented as a mass that skewed the symmetry of the brain, leading eventually to breakdown of the blood-brain barrier (BBB) at 12–14 days post glioma cell implantation, as indicated by increased tumor signal intensity in contrast agent enhanced T1-weighted FLASH images. T2-weighted RARE imaging also showed the oedema resulting from glioma growth (see Figure 2).
Figure 2.
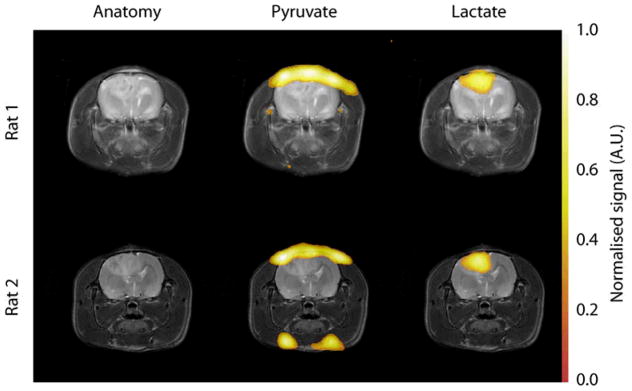
Images showing hyperpolarized 13C CSI of pyruvate and lactate within two C6 glioma bearing animals. The grayscale images are T2-weighted RARE images showing the tumor and associated edema. The color images are the 13C CSI data, superimposed upon the proton images for anatomical reference. The pyruvate signal is localized to the blood vessels at the top of the brain and also, occasionally, at the base of the head. The lactate signal is localized to the tumor mass. The lactate signals have been normalized to the maximum pyruvate signal in each dataset. This distribution of labeled pyruvate and lactate was observed in all animals.
Untreated animals died within 14–21 days of tumor implantation, whereas those animals whose tumors were irradiated with 15 Gy on or around day 10 lived for two months after treatment, at which time they were euthanized. These animals showed renewed weight gain and increased appetite and activity, although the tumor appeared to continue to increase in size following radiotherapy. The average size of the tumor regions, which were enhanced in T2-weighted RARE images and in contrast agent enhanced T1-weighted FLASH images, increased from 150 ± 40 mm3 to 240 ± 60 mm3 (+70%, p<0.01) 96 h following radiotherapy.
13C Spectroscopy
13C spectra acquired from the heads of non tumor-bearing animals injected with hyperpolarized pyruvate showed a rapid appearance of [1-13C] pyruvate, but only small signals from lactate, alanine and pyruvate hydrate. In contrast, lactate labeling was observed in tumor-bearing rats (Figure 1). There was very little alanine labeling in these spectra.
Figure 1.

An example of 13C spectroscopic data acquired from a glioma-bearing rat. Data was acquired using a surface coil, following administration of 2ml 75mM hyperpolarized [1-13C] pyruvate. The major peak at 173 ppm is from pyruvate. The lactate signal is at 185 ppm. The first 120 s of data acquisition are shown, and the back edge shows a summation of all the spectra. The time courses for pyruvate and lactate peak integrals also are shown. The window that was used for the acquisition of CSI is shown at approximately 20–31 s after injection.
13C chemical shift images acquired following injection of hyperpolarized [1-13C] pyruvate injected into non tumor-bearing animals showed pyruvate signal from varying combinations of the three major vessels on the dorsal side of the brain, two vessels on the ventral side and two vessels in the neck. A similar pattern of blood vessel enhancement was observed in tumor-bearing animals (Figures 2 and 4). Very little pyruvate or lactate signal was observed in the brain itself. Following injection of hyperpolarized [1-13C] pyruvate into tumor-bearing animals, in which there was opening of the BBB, there was clear evidence of lactate labeling, which was localized to the tumor in all those cases where it was detected (Figure 2 and 4). Interestingly, very little pyruvate signal was detected from the tumor region.
Figure 4.

Images showing hyperpolarized 13C CSI of pyruvate and lactate in two C6 glioma- bearing animals before and after treatment. The grayscale images are T2-weighted RARE images showing the tumor and associated edema. The color images are the 13C CSI data, superimposed upon the proton images for anatomical reference. The lactate signal is localized to the tumor mass, and is reduced following exposure to 15 Gy radiation. The lactate signals have been normalized to the maximum pyruvate signal in each dataset. The second animal (bottom) shows heterogeneity in the lactate labeling after treatment, suggesting that regions of the tumor responded less well to therapy. The proton images show that these tumors continued to increase in size despite irradiation, demonstrating the difficulty in using anatomical imaging to detect therapeutic efficacy.
The mean lactate intensity in the tumor, normalized to the maximum pyruvate signal intensity in a neighboring blood vessel, decreased by 47% following radiotherapy from 0.28 +/−0.15 to 0.15 +/− 0.07 (n=10, p=0.033), when all the data collected post-therapy were averaged for each animal. Additionally, when each individual animal was followed over time, all but one of the animals showed a reduction in lactate labeling after irradiation during the first 72 h following therapy, and the remaining animal also exhibited reduced lactate labeling by 96 h. Comparison of pre-treatment lactate values with the values obtained at 96 h after therapy showed a reduction in all the animals where these data were acquired (0.25 +/− 0.13 to 0.13 +/− 0.08, a percentage reduction of 10–80 %, n=7, p=0.019, Figure 3). There was some evidence of heterogeneity in the tumor treatment response, with some regions retaining high lactate labeling and others showing little or no lactate signal (Figure 4). Similar results were obtained whether the tumor region was defined by the T2-weigthed or contrast agent-enhanced T1-weighted images.
Figure 3.

Plots of the 13C-labelled lactate/pyruvate ratio acquired from the glioma bearing animals before and 96 h after treatment.
The T1-weighted images showed a more heterogeneous tumor enhancement following radiotherapy, suggesting altered perfusion, which could affect pyruvate uptake. Histogram analysis of the overall enhancement, measured as the ratio of signal intensity in the enhanced region to contralateral brain, showed a broader signal distribution following therapy. The mean enhancement was 1.21 ± 0.04 pre-therapy versus 1.35 ± 0.08 post-therapy; p=0.01. Analysis of the lactate signal from only well-perfused regions that enhanced in the T1-weighted images showed a similar decrease following therapy.
Discussion
The rat C6 glioma tumor model replicates many of the morphological features of advanced human GBM, including a high mitotic index, foci of necrosis, nuclear pleomorphism, oedema and diffuse infiltrative borders and palisading cells surrounding areas of necrosis (9,10). In addition, as shown here, the model shows evidence of pseudo-progression, where there is an increase in the area showing contrast agent enhancement post-treatment, despite a positive tumor response to treatment. This is a significant problem in the clinic (11), where the question of whether there is active tumor growth or infiltration in addition to necrosis has important consequences for treatment, and a reliable distinction between the two conditions is, therefore, crucial. To date, no single imaging technique has been identified that can recognize and adequately establish the diagnosis of pseudo-progression.
We have shown here that the response of the C6 glioma to radiotherapy can be detected through decreased labeling of tumor lactate following i.v. injection of hyperpolarized [1-13C]pyruvate. 13C chemical shift images showed that the lactate signal was confined to the tumor, being absent from normal brain, and that the pyruvate signal was largely confined to the blood vessels, in both tumor and non-tumor bearing animals. This pattern of pyruvate and lactate labeling suggests that the injected pyruvate rapidly enters tumor cells, due to a disrupted BBB, where the label is diluted, by exchange with a relatively large pool of endogenous lactate (4). This would explain the large pyruvate signal in the blood vessels but negligible signal in the tumor. Minimal lactate labeling in normal brain can be explained by both the low lactate concentration in normal brain (12) and limited pyruvate penetration of an intact BBB. Previous studies have reported variable amounts of pyruvate signal in brain and enhanced lactate labeling in gliomas (13–15).
13C chemical shift images provided the required spatial resolution of the pyruvate and lactate signals, although they lacked the temporal resolution need to provide kinetic measurements of tumor pyruvate-lactate label exchange (6). This problem could be resolved by using the fast imaging methods that are being developed for hyperpolarized 13C (16,17). Nevertheless, although we were not able to determine the kinetics of 13C label exchange, by acquiring images at a fixed time point after pyruvate injection we were able to show that there was a decrease in lactate labeling following radiotherapy. This may reflect changes in tumor perfusion, since there was increased heterogeneity in the contrast agent enhanced T1-weighted images post-treatment, although there was no decrease in the overall level of enhancement, in fact there was a small but statistically significant increase. This is consistent with previous reports showing that changes in glioma perfusion following radiotherapy are heterogeneous, and that reduced perfusion generally predicts increased survival (18). Decreased lactate labeling may also be due to a decrease in lactate concentration, a loss of LDH activity and a decrease in coenzyme concentration, as were observed in a drug-treated murine lymphoma (6). Decreased lactate concentrations following successful therapy in gliomas have been reported previously (19,20).
In conclusion, we have shown that the response of glioma to radiotherapy can be detected within 24–96 hours of treatment by monitoring decreased 13C labeling of tumor lactate following injection of hyperpolarized [1-13C]pyruvate even when the tumor volume continue to increase. Translation of this technique to the clinic may enable a distinction to be made between pseudo-progression and true progression, in which case it could be used to guide subsequent treatment. Since clinical trials with hyperpolarized [1-13C]pyruvate in prostate cancer are about to commence this appears to be a realistic prospect.
Acknowledgments
This work was supported by the intramural research programs of the NINDS and NCI, NIH. The authors thank Jan-Henrik Ardenkjaer-Larsen (GE Healthcare) for research support and useful discussion.
References
- 1.Brindle K. New approaches for imaging tumour responses to treatment. Nat Rev Cancer. 2008;8(2):94–107. doi: 10.1038/nrc2289. [DOI] [PubMed] [Google Scholar]
- 2.Kato T, Shinoda J, Nakayama N, Miwa K, Okumura A, Yano H, Yoshimura S, Maruyama T, Muragaki Y, Iwama T. Metabolic assessment of gliomas using 11C-methionine, [18F] fluorodeoxyglucose, and 11C-choline positron-emission tomography. AJNR Am J Neuroradiol. 2008;29(6):1176–1182. doi: 10.3174/ajnr.A1008. [DOI] [PMC free article] [PubMed] [Google Scholar]
- 3.Pauleit D, Stoffels G, Bachofner A, Floeth FW, Sabel M, Herzog H, Tellmann L, Jansen P, Reifenberger G, Hamacher K, Coenen HH, Langen KJ. Comparison of 18F-FET and 18F-FDG PET in brain tumors. Nuclear Medicine and Biology. 2009;36(7):779–787. doi: 10.1016/j.nucmedbio.2009.05.005. [DOI] [PubMed] [Google Scholar]
- 4.Herholz K, Heindel W, Luyten PR, denHollander JA, Pietrzyk U, Voges J, Kugel H, Friedmann G, Heiss WD. In vivo imaging of glucose consumption and lactate concentration in human gliomas. Ann Neurol. 1992;31(3):319–327. doi: 10.1002/ana.410310315. [DOI] [PubMed] [Google Scholar]
- 5.Terpstra M, Gruetter R, High WB, Mescher M, DelaBarre L, Merkle H, Garwood M. Lactate turnover in rat glioma measured by in vivo nuclear magnetic resonance spectroscopy. Cancer Res. 1998;58(22):5083–5088. [PubMed] [Google Scholar]
- 6.Day SE, Kettunen MI, Gallagher FA, Hu DE, Lerche M, Wolber J, Golman K, Ardenkjaer-Larsen JH, Brindle KM. Detecting tumor response to treatment using hyperpolarized 13C magnetic resonance imaging and spectroscopy. Nat Med. 2007;13(11):1382–1387. doi: 10.1038/nm1650. [DOI] [PubMed] [Google Scholar]
- 7.Kettunen MI, Hu DE, Witney TH, McLaughlin R, Gallagher FA, Bohndiek SE, Day SE, Brindle KM. Magnetization transfer measurements of exchange between hyperpolarized [1-13C]pyruvate and [1-13C]lactate in a murine lymphoma. Magn Reson Med. 2010 doi: 10.1002/mrm.22276. in press. [DOI] [PubMed] [Google Scholar]
- 8.Witney TH, Kettunen MI, Day SE, Hu DE, Neves AA, Gallagher FA, Fulton SM, Brindle KM. A comparison between radiolabeled fluorodeoxyglucose uptake and hyperpolarized (13)C-labeled pyruvate utilization as methods for detecting tumor response to treatment. Neoplasia (New York, NY. 2009;11(6):574–582. doi: 10.1593/neo.09254. 571 p following 582. [DOI] [PMC free article] [PubMed] [Google Scholar]
- 9.Auer RN, Del Maestro RF, Anderson R. A simple and reproducible experimental in vivo glioma model. Can J Neurol Sci. 1981;8(4):325–331. doi: 10.1017/s0317167100043468. [DOI] [PubMed] [Google Scholar]
- 10.Whittle IR, Macarthur DC, Malcolm GP, Li M, Washington K, Ironside JW. Can experimental models of rodent implantation glioma be improved? A study of pure and mixed glioma cell line tumours. J Neurooncol. 1998;36(3):231–242. doi: 10.1023/a:1005831111337. [DOI] [PubMed] [Google Scholar]
- 11.Taal W, Brandsma D, de Bruin HG, Bromberg JE, Swaak-Kragten AT, Smitt PA, van Es CA, van den Bent MJ. Incidence of early pseudo-progression in a cohort of malignant glioma patients treated with chemoirradiation with temozolomide. Cancer. 2008;113(2):405–410. doi: 10.1002/cncr.23562. [DOI] [PubMed] [Google Scholar]
- 12.Hanstock CC, Rothman DL, Prichard JW, Jue T, Shulman RG. Spatially localized 1H NMR spectra of metabolites in the human brain. Proc Natl Acad Sci U S A. 1988;85(6):1821–1825. doi: 10.1073/pnas.85.6.1821. [DOI] [PMC free article] [PubMed] [Google Scholar]
- 13.Hurd RE, Yen Y-F, Mayer D, Chen A, Wilson D, Kohler S, Tropp J, Bok R, Vigneron D, Kurhanewicz J, Spielman D, AP Hyperpolarized 1-[13C]-Ethyl-Pyruvate Metabolic Imaging in Anesthetized Rat Brain. Proc Intl Soc Mag Reson Med. 2009;17:56. [Google Scholar]
- 14.Marjanska M, Iltis I, Deelchand DK, Garwood M, Henry P-G. Hyperpolarized 13C MRS in the Rat Brain: Spatial Origin of Signals. Proc Intl Soc Mag Reson Med. 2009;17:2434. [Google Scholar]
- 15.Park I, Larson PE, Zierhut ML, Hu S, Bok R, Ozawa T, Kurhanewicz J, Vigneron DB, Vandenberg SR, James CD, Nelson SJ. Hyperpolarized 13C magnetic resonance metabolic imaging: application to brain tumors. Neuro-oncology. 12(2):133–144. doi: 10.1093/neuonc/nop043. [DOI] [PMC free article] [PubMed] [Google Scholar]
- 16.Mayer D, Yen YF, Tropp J, Pfefferbaum A, Hurd RE, Spielman DM. Application of subsecond spiral chemical shift imaging to real-time multislice metabolic imaging of the rat in vivo after injection of hyperpolarized 13C1-pyruvate. Magn Reson Med. 2009;62(3):557–564. doi: 10.1002/mrm.22041. [DOI] [PMC free article] [PubMed] [Google Scholar]
- 17.Yen YF, Kohler SJ, Chen AP, Tropp J, Bok R, Wolber J, Albers MJ, Gram KA, Zierhut ML, Park I, Zhang V, Hu S, Nelson SJ, Vigneron DB, Kurhanewicz J, Dirven HAAM, Hurd RE. Imaging considerations for in vivo 13C metabolic mapping using hyperpolarized 13C-pyruvate. Magnetic Resonance in Medicine. 2009;62(1):1–10. doi: 10.1002/mrm.21987. [DOI] [PMC free article] [PubMed] [Google Scholar]
- 18.Cao Y, Tsien CI, Nagesh V, Junck L, Ten Haken R, Ross BD, Chenevert TL, Lawrence TS. Survival prediction in high-grade gliomas by MRI perfusion before and during early stage of RT [corrected] Int J Radiat Oncol Biol Phys. 2006;64(3):876–885. doi: 10.1016/j.ijrobp.2005.09.001. [DOI] [PubMed] [Google Scholar]
- 19.Tarnawski R, Sokol M, Pieniazek P, Maciejewski B, Walecki J, Miszczyk L, Krupska T. 1H-MRS in vivo predicts the early treatment outcome of postoperative radiotherapy for malignant gliomas. International Journal of Radiation Oncology Biology Physics. 2002;52(5):1271–1276. doi: 10.1016/s0360-3016(01)02769-9. [DOI] [PubMed] [Google Scholar]
- 20.Tomoi M, Kimura H, Yoshida M, Itoh S, Kawamura Y, Hayashi N, Yamamoto K, Kubota T, Ishii Y. Alterations of lactate (+lipid) concentration in brain tumors with in vivo hydrogen magnetic resonance spectroscopy during radiotherapy. Invest Radiol. 1997;32(5):288–296. doi: 10.1097/00004424-199705000-00006. [DOI] [PubMed] [Google Scholar]