

Abstract
Neuroimaging research has identified several category-selective regions in visual cortex that respond most strongly when viewing an exemplar image from a preferred category, such as faces. Recent studies, however, have suggested a more complex pattern of activation that has been heretofore unrecognized, e.g., the presence of additional patches of activation to faces beyond the well-studied fusiform face area, and the activation of ostensible face selective regions by animate motion of non-biological forms. Here, we characterize the spatial pattern of brain activity evoked by viewing faces or biological motion in large fMRI samples (N > 120). We create probabilistic atlases for both face and biological motion activation, and directly compare their spatial patterns of activation. Our findings support the suggestion that the fusiform face area is composed of at least two separable foci of activation. The face-evoked response in the fusiform and nearby ventral temporal cortex has good reliability across runs; however, we found surprisingly high variability in lateral brain regions by faces, and for all brain regions by biological motion, which had an overall much lower effect size. We found that faces and biological motion evoke substantially overlapping activation distributions in both ventral and lateral occipitotemporal cortex. The peaks of activation for these different categories within these overlapping regions were close but distinct.
Keywords: face, biological motion, probabilistic atlas, fMRI, localizer, body
1. Introduction
The occipitotemporal cortices contain several ostensibly category-selective areas defined by their preferential response to different types of stimuli, such as faces (e.g. Sergent et al., 1992; Haxby et al., 1994; Puce et al., 1995; Kanwisher et al., 1997), body-parts (e.g. Downing et al., 2001; Peelen and Downing, 2005; Peelen and Downing, 2007; de Gelder et al., 2010), houses and places (e.g. Aguirre et al., 1998; Epstein and Kanwisher, 1998; Ishai et al., 1999; Epstein et al., 1999), and biological motion (e.g. Bonda et al., 1996; Puce et al., 1998; Grossman et al., 2000; Grossman and Blake, 2002). These areas have been widely considered to represent cortical modules specialized for particular and limited functions such as structural encoding of faces. The relative simplicity of this perspective has been challenged by more recent findings. The discovery of new category selective areas has revealed a more crowded landscape of overlapping activations. For instance, the body-selective response overlaps with the face-selective response. Multi-voxel pattern analysis has shown that category-selective responses can be seen in distributed response patterns that extend outside of the relevant specialized area (Haxby et al., 2001). Perhaps most challenging of all is recent evidence that the ‘fusiform face area’ (FFA; Kanwisher et al., 1997), maybe the most well known and thoroughly studies of these regions, might not be a single area but rather comprise a series of face-selective patches (Pinsk et al., 2009; Weiner and Grill-Spector, 2011). This complexity may have remained hidden due to the relative insensitivity of fMRI, particularly when the signal to noise of the activation response is relatively low and sample sizes are small. One aim of the current study, then, is to take advantage of data sets with large sample sizes to best characterize the spatial patterns of activation evoked by viewing two particular categories of stimuli, faces and biological motion.
An important aspect of characterizing the spatial activation pattern evoked by stimulus categories is to establish the reliability of these patterns, measured either by the locations of the peak activations or by the spatial extent of activation, across sessions. The large data sets we analyze here were created by pooling ‘localizer tasks’ used in a variety of independent studies. ‘Localizer tasks’ are commonly used as a preliminary step in brain imaging experiments to identify functional regions of interest (fROIs) that are then used to limit the number of dependent variables measured in the main experiment (thus ameliorating the statistical issues related to multiple comparisons). The effect of the main experimental manipulation is measured as the average response of the fROI rather than a whole-brain voxel-wise analysis. The localizer task and the primary experiment can be run in the same imaging session separated by minutes, or in different sessions separated by days. The reliability of the pattern of activation is important for obtaining a true picture of the spatial structure of the category-specific response. It is also, however, an important practical concern that limits the value of a localizer task.
Several characteristics of functional localizers have been recently investigated. These include the effect of spatial normalization (Swallow et al., 2003), sensitivity to task manipulations (Berman et al., 2010; Rossion et al., 2012), and the spatial reliability of activation maps (Kung et al., 2007; Duncan et al., 2009; Duncan and Devlin, 2011) and peak responses (Peelen and Downing, 2005; Duncan et al., 2009). Though these reports have informed our understanding of the reliability of localizer task reliability, they have done so using relatively limited sample sizes (i.e., N < 50). A practical outcome of the current study, then, is the creation of functional probabilistic atlases of these category-selective responses. Probabilistic atlases of brain structure and function are increasingly useful tools for localization and interpretation fMRI results (Van Essen, 2002).
That we investigate here the spatial patterns and statistical reliability of two apparently disparate categories, faces and biological motion, is not by accident. Rather, we were particularly interested in comparing the spatial patterns of activation evoked by these different stimulus classes. Recent studies from our laboratory have revealed activation in face selective regions of the fusiform gyrus (as defined by face localizer tasks) by the apparent animate motion of non-face simple geometric forms (Gao, Scholl, McCarthy, under review) and by non-human machines that are engaged in purposeful motion (Shultz and McCarthy, 2011). Neuroimaging studies of biological motion have revealed activation within the fusiform gyrus that appears similar to that evoked by faces (e.g. Bonda et al., 1996), and the activation patterns in lateral occipitotemporal cortex for faces and biological motion are also superficially similar (e.g. Allison et al., 2000) However, a direct comparison of the activation patterns evoked by faces and by biological motion in a large sample of subjects has not been previously reported.
2. Materials and Methods
2.1 Experimental Design
This study used separate fMRI localizer tasks to isolate regions of functional selectivity for faces or biological motion. The data from each of three localizer tasks (2 face localizers, 1 biological motion localizer) were collected over several years in the context of several independent studies. In the canonical design, participants viewed blocks composed of a series of images from one of two possible stimulus categories. Participants in the “face-scene” localizer task passively viewed blocks composed of color images of faces or indoor and outdoor scenes. The content of the scenes was highly variable across exemplar images and could include houses, buildings, or other structures. Participants in the “face-house” localizer task passively viewed blocks composed of color images of faces or houses. Here, the control condition was solely composed of centered frontal pictures of house facades. Participants in the “biomotion” localizer task passively viewed blocks composed of a series short ‘point-light’ movies depicting either biological or non-biological motion. The number of runs and timing details varied slightly across versions of the tasks used in independent studies. All versions of both face localizer tasks included 1–2 runs in which each category was presented in 4–6 blocks that lasted 16–24 s and were interleaved with a 10–16 s rest interval. All versions of the biological motion localizer task included 1–3 runs in which each category was presented in 4–6 blocks that lasted 12–32 s and were interleaved with a 12–16 s rest interval.
2.2 Participants
For the face-scene task, 124 young adults (66 females, 58 males, mean age 23 years) participated in the context of nine separate studies. For the face-house task, 79 young adults (35 females, 44 males, mean age 25 years) participated in the context of four separate studies. For the biomotion task, 121 young adults (63 females, 58 males, mean age 25 years) participated in the context of eleven separate studies.
The primary voxel-wise analyses and probabilistic atlases are based on data from a single run. However, a subset of participants saw two or more runs of the face-scene (N=47) or biomotion (N=68) tasks. These data were used to evaluate the inter-run stability of the task results.
2.3 fMRI Image Acquisition
All scanning was conducted at the Magnetic Resonance Research Center at Yale University, and approved by the Yale IRB. MR images were acquired using a 3.0 T Siemens TRIO scanner. Echo-Planar Images (EPIs) with near whole-brain coverage were acquired from all participants. The specific acquisition parameters varied somewhat across participants as the data were collected in separate and independent experiments. All study acquisition parameters used the same echo time [TE] = 25, flip angle = 90°, and matrix size = 642. The independent studies acquired 34, 36, or 37 slices with a slice thickness = 3.5 or 4 mm, a field of view [FOV] = 224 or 240, and a repetition time [TR] = 1.5 or 2 s. Across all studies co-planar T1-Flash and high-resolution T1-MPRAGE images were collected to facilitate anatomical registration of the EPI images.
2.4 fMRI Pre-Processing and Analysis
Preprocessing was performed using the FMRIB Software Library (FSL, www.fmrib.ox.ac.uk/fsl). FSL’s brain extraction tool was used to remove the signal from all non-brain voxels. The first two volumes of each functional dataset were discarded to allow for MR equilibration. Head motion effects in the data were corrected using FSL’s MCFLIRT linear realignment tool. Data were temporally and spatially smoothed with a high-pass filter (.01 Hz cutoff) and a Gaussian kernel of full-width-half-maximum of 5 mm, respectively. Functional images were registered to coplanar images, which were then registered to high-resolution anatomical images, and normalized to the Montreal Neurological Institute’s MNI152 template. Our measures of within-participant spatial reliability should not be affected by this spatial standardization (Swallow et al., 2003).
Analyses were performed using both FSL and the Analysis of Functional Neurolmages software package (AFNI)(Cox, 1996). Details of each analysis are described below.
2.4.1 Whole-brain statistical maps
Voxel-wise regression analysis of each time-series (i.e. run) was performed using FSL’s FEAT program. Each of the stimulus time-series was convolved with a single-gamma hemodynamic response function to create regressors-of-interest for analysis within a general linear model (GLM). The selectivity of a voxel was evaluated using linear contrasts of the model coefficients. In the face-scene, face-house, and biomotion tasks, these contrasts were faces > scenes, faces > houses, and biological > non-biological, respectively. The t-statistics at each voxel associated with each contrast were subsequently converted to z-scores.
Group analysis was performed with AFNI’s 3dttest++ program. The model coefficients across all participants were contrasted using a paired-samples t-test. To correct for multiple comparisons the statistical maps were thresholded using a false discovery rate of q(FDR) ≤.001.
Despite the conservative statistical threshold, the t-tests resulted in large clusters of activation. To better resolve the peaks of selectivity within these clusters, we used AFNI’s 3dExtrema program to find local maxima within the clusters. Peaks were defined as local maxima with z ≥ 6 and a minimum of 8 mm (a distance of approximately two voxels at our acquisition resolution) from an adjacent peak.
2.4.2 Whole-brain probabilistic atlases
Atlases were created that estimated the probability that a given voxel is category-selective to one of the tested conditions. The results of the GLM’s linear contrast (described above) were first binarized such that voxels at which the localizer contrast had a z-score ≥ 1.65 were assigned a value of “1”, and all other voxels were assigned a value of “0”. The voxel-wise mean of these binary maps was then calculated across all participants. The resulting maps represent, at each voxel, the percentage of participants who showed a category-selective response. A separate atlas was created from each localizer task.
As with the clusters created by the GLM contrast, an automated local maxima search was used to find probabilistic peaks. Peaks were defined as local maxima with P ≥ .33 and a minimum of 8 mm from an adjacent peak.
2.4.3 Regions of Interest
We created two anatomical ROI masks (aROI) to be used in a subset of our analyses (the inter-run analyses described below). The regions of interest included the ventral temporal (VT) and lateral temporal (LT) cortices. We restricted these aROIs to the right hemisphere, given that neuroimaging studies consistently find a right hemisphere bias for face processing (Sergent et al., 1992; McCarthy et al., 1997; Kanwisher et al., 1997; Rossion et al., 2012).
The aROIs were defined anatomically on the cortical surface of a standard brain (Figure 5a), and subsequently converted into volume space for use in the analyses. The VT mask primarily consists of the mid-fusiform gyrus (FG) and extends laterally from the collateral to the inferior temporal sulcus and is bounded in the anterior-posterior dimension at MNI y-coordinates of approximately −30 and −60. The LT mask primarily consists of the posterior superior temporal sulcus (LT) and includes the posterior segment of the superior temporal sulcus (y ≤ −32) including its descending and ascending limbs.
Figure 5. Inter-run reliability.

(a) Two right-hemisphere regions of interest (aROIs) were created for this analysis. The (RED) ventral and (GREEN) lateral temporal aROI masks are displayed on the lateral and ventral cortical surface of a standard brain. (b) The inter-run overlap ratio for the (top row) face-scene and (bottom row) biomotion localizer tasks. Inter-run reliability is operationalized here as the mean overlap-ratio (see methods) from within two time-series acquired during the same experimental session. These overlap ratios were calculated for statistical maps threshold at five different z-values (x-axis of each plot).
2.4.5 Inter-Run Reliability
A subset of the participants saw two or more runs of the face (N=47) or biological motion (N=68) localizer task. We used these data to estimate the reliability of the localizer-evoked activation. That is, does the activation evoked in run 1 predict the activation evoked in run 2. For each participant the coordinates of the peak category-selective voxel were identified within each aROIs. Inter-run reliability of the peak voxel location was estimated by calculating the Euclidean distance between the peak voxel’s coordinates from the first and second runs. In a similar investigation of language localizers, Duncan and colleagues(2009a) calculated the spatial overlap of the activated voxels across several runs. The same measure was used here as measure of inter-run reliability within each aROI. This overlap ratio is defined as Rij = 2 × Vij/(Vi + Vj); where Vi is the number of voxels activated in the first run, Vj is the number of voxels activated in the second run, and Vij is the number of voxels commonly activated across both runs. Participant data was included in this analysis if there were seven or more active voxels (a volume roughly equivalent to the volume of a single voxel at our acquisition resolution) in each of the two runs. The spatial extent of an activation map is largely a function of the statistical threshold used to define it. A more liberal threshold will yield a larger map (i.e. more active voxels), whereas a conservative threshold will yield a smaller map (i.e. fewer active voxels). Duncan and colleagues(2009a) thus calculated the overlap ratio using different statistical thresholds in an effort to avoid biasing the results by using a single arbitrary threshold. The same approach was employed in the current study. The overlap ratio was calculated using z-value thresholds of 1.65, 2.3, 3.09, 4, and 5. To further estimate the strength of the effect relative to noise (i.e SNR), we calculated the mean z-score of the top 10% of the z-score distribution across all voxels within the aROI.
3. Results
The results and discussion that follows will use the following shorthand to describe activated voxels: ‘face-voxels’ refer to voxels that exceed the statistical threshold of z > 1.65 for the relevant face contrast (face > scene or face > house), ‘bio-voxels’ refer to voxels that exceed the statistical threshold of z > 1.65 for the biological > non-biological motion contrast.
3.1 Whole-brain statistical maps
Face-scene localizer
The face > scene contrast revealed sixteen large clusters (> 100 voxels) of “face-voxels” (Figure 1, column 1). These included bilateral occipitotemporal clusters, which connected the lateral and ventral temporal cortices via the inferior occipitotemporal cortex, medial clusters including dorsomedial and ventromedial frontal, medial occipital and paracingulate cortices, right inferior frontal gyrus, bilateral amygdala, and left cerebellum.
Figure 1. Group GLM contrast maps.

Significantly activated voxels q(FDR) < .001) from the (column 1) faces > scenes, (column 2) biological > non-biological motion, and (column 3) faces > houses contrasts displayed on the cortical surface of a ‘standard’ brain. Displayed are the lateral, ventral, and medial views of the (rows 1–3) right and (rows 4–6) left hemisphere.
Within these clusters, seventeen local maxima were identified (Table 1) using the criteria described in Methods (because the criteria included a minimum z-score, not all clusters yielded a local maxima). These included seven peaks that ran through the right occipitotemporal cluster posteriorly along the fusiform gyrus then laterally and anteriorly along the anterior occipital sulcus and terminating within the superior temporal sulcus, and four peaks that followed a similar course in the left hemisphere. The remaining six peaks were found in the bilateral amygdala, dorsomedial PFC, two adjacent peaks in the medial precuneus, left cerebellum. Among these 17 local maxima, five were particularly prominent (z > 13); the right pSTS, bilateral amygdala, right fusiform gyrus (a region often functionally defined as the fusiform face area; FFA; Kanwisher et al., 1997), and right anterior occipital sulcus (a region often functionally defined as the occipital face area; OFA; Gauthier et al., 2000).”
TABLE 1. Local Maxima of GLM Statistics and Voxel Probabilities.
MNI coordinates of local maxima identified from the group-level GLM contrast maps or from the probabilistic atlases. Each voxel location identified from the GLM is reported with its associated z-statistic from either the face > scene or biological > non-biological contrast. Each voxel location identified from the probabilistic atlas is reported with its associated P value. This value represents the percentage of subjects whose statistical contrast (e.g. faces > scenes) was significant (z > 1.65) at that location.
| X | Y | Z | z-score |
|---|---|---|---|
|
| |||
| Face GLM Peaks | |||
| 54 | −56 | 10 | ≥13 |
| 42 | −76 | −14 | ≥13 |
| −20 | −6 | −16 | ≥13 |
| 22 | −6 | −14 | ≥13 |
| 42 | −50 | −20 | ≥13 |
| 50 | −76 | −4 | 8.21 |
| −42 | −48 | −20 | 8.21 |
| 46 | −58 | −18 | 7.97 |
| −42 | −58 | −18 | 7.86 |
| 56 | −44 | 10 | 7.84 |
| −44 | −84 | −8 | 7.83 |
| 58 | −64 | 4 | 7.02 |
| 2 | −62 | 32 | 6.67 |
| −50 | −66 | 10 | 6.25 |
| 2 | 52 | 28 | 6.13 |
| 6 | −52 | 26 | 6.04 |
| −20 | −76 | −40 | 6.04 |
| X | Y | Z | z-score |
|---|---|---|---|
|
| |||
| Bio Motion GLM Peaks | |||
| −54 | −66 | 10 | ≥13 |
| 56 | −64 | 6 | ≥13 |
| 42 | −46 | −18 | 8.13 |
| 52 | −42 | 14 | 7.86 |
| 62 | −40 | 18 | 7.46 |
| 54 | −62 | 2 | 7.23 |
| −46 | −78 | 6 | 6.95 |
| 46 | −40 | 6 | 6.83 |
| −56 | −50 | 16 | 6.48 |
| −40 | −46 | −20 | 6.51 |
| X | Y | Z | Peak P |
|---|---|---|---|
|
| |||
| Face Probabilistic Peaks | |||
| 44 | −48 | −22 | .702 |
| 48 | −76 | −6 | .573 |
| −40 | −50 | −18 | .573 |
| 44 | −62 | −16 | .556 |
| 44 | −70 | −16 | .548 |
| −42 | −82 | −10 | 0.532 |
| 20 | −8 | −14 | 0.500 |
| 54 | −66 | 8 | 0.468 |
| −40 | −64 | −18 | 0.468 |
| 54 | −70 | −2 | .452 |
| 2 | −60 | 32 | 0.444 |
| −20 | −6 | −16 | .0411 |
| 60 | −54 | 14 | 0.395 |
| 54 | −56 | 6 | 0.387 |
| 0 | −68 | 28 | .371 |
| 46 | −58 | 14 | .0339 |
| −50 | −66 | 12 | 0.339 |
| 56 | −46 | 12 | .331 |
| X | Y | Z | Peak P |
|---|---|---|---|
|
| |||
| Bio Motion Prob. Peaks | |||
| 54 | −64 | 8 | 0.528 |
| 52 | −70 | −2 | 0.415 |
| −52 | −68 | 14 | 0.387 |
| −48 | −76 | 6 | 0.387 |
| 46 | −58 | 8 | 0.377 |
| 42 | −48 | −20 | 0.377 |
| −52 | −42 | 14 | 0.368 |
| −50 | −60 | 8 | 0.349 |
Also of note was a local maximum along the fusiform gyrus that was located intermediate between the FFA and OFA (Figure 2). We were concerned that this intermediate peak might be an artifact of the ‘minimum peak separation distance’ parameter used in our automated search for local maxima. That is, peaks might be identified at a spatial frequency equal to the minimum distance parameter even on a homogenous distribution that does not contain true activation maxima. To ensure that this intermediate peak was not an artifact of particular search parameters, we re-ran the local maxima algorithm without imposing a minimum separation criterion. This test identified the same two peaks, indicating that the intermediate peak is not likely an artifact of our measurement procedure.
Figure 2. Trio of face-selective regions on the right ventral surface.

Spheres, centered on local maxima locations derived from the group-level GLM, rendered on the surface of the right ventral temporal cortex. These areas include the ‘rOFA’ (most occipital of the three), a posterior fusiform face area, and an anterior fusiform face area. Also visible is the local maxima in the right amygdala.
We tested the reliability of these two fusiform peaks by identifying the top two peak maxima within the VT aROI for each subject. Aside from the constraining the search to the aROI, we did not impose any additional restrictions on the possible location of the peak responses. We found that the top two peak voxels were separated by 9.95 mm along the y-axis. Across all participants, the average location of these peaks was at 42, −44, −20 and 43, −54, −18, nearly identical to the location of the peaks identified in the group GLM.
Face-house localizer
The face > house contrast map was very similar to the one evoked by the face > scene contrast (cf. Figure 1, columns 1 and 3). Because the results of the face-house task were derived from a smaller sample than the face-scene task, and because the results were qualitatively very similar to those of the face-scene task, we will not discuss the face-house results in further detail.
Biomotion localizer
The biological motion > non-biological motion contrast revealed three large clusters (> 100 voxels) of “bio-voxels” (Figure 1, second column). These included bilateral occipitotemporal clusters, which connected the lateral and ventral temporal cortices via the inferior occipitotemporal cortex, and the right amygdala.
Within these clusters, nine local maxima were identified (Table 1). Five right hemisphere peaks were found in the fusiform gyrus, the superior temporal sulcus, and anterior occipital sulcus. Four left hemisphere peaks were found in the fusiform gyrus, middle occipital gyrus, and superior temporal sulcus. Note that the right amygdala was not identified by the automated local maxima search because the peak z-value in this region (z = 5.59) was slightly below the threshold set for the search (z ≥ 6). We have thus visually identified this peak and reported it in Table 2.
Scene-, House-, and non-biological motion- selective voxels
The reverse contrasts were calculated for all three localizer tasks and are presented in Figure 3. We will not discuss these results further, but the result maps and their associated probabilistic atlases (see below) are available along with those for face and biological motion. Note that there were no voxels that were significantly larger for non-biological than biological motion.
Figure 3. Group GLM contrast maps.

Significantly activated voxels q(FDR) < .001) from the (column 1) scenes > faces, (column 2) non-biological > biological motion, and (column 3) houses > faces contrasts displayed on the cortical surface of a ‘standard’ brain. Displayed are the lateral, ventral, and medial views of the (rows 1–3) right and (rows 4–6) left hemisphere.
3.2 Whole-brain probabilistic atlases
The probabilistic atlases described below can be obtained by contacting the authors or by download at the author’s website (http://www.andrewengell.com).
Face-scene localizer
The distribution of face-voxel probabilities was similar to the distribution of z-scores from the GLM analysis (cf. column 1 of Figures 1 and 4). Across all voxels, the probability of any given voxel being significantly face-selective ranged from P = 0 to P = .702 (Figure 4, column 1).
Figure 4. Probabilistic maps.

The probabilistic atlas of (column 1) face-selectivity defined by the face > scene contrast, (column 2) biological motion-selectivity, and (column 3) face-selectivity defined by the face > house contrast displayed on the cortical surface of a ‘standard’ brain. All voxels are associated with a probability value, but for the purposes of clarity only those voxels with P ≥ .20 are displayed.
Face-house localizer
The face > house contrast map was similar to the one evoked by the face > scene contrast (cf. Figure 4, columns 1 and 3).
Biomotion localizer
The distribution of face-voxel probabilities was similar to the distribution of z-scores from the GLM analysis (cf. column 2 of Figures 1 and 4). Across all voxels, the probability of any given voxel being significantly selective for biological motion ranged from P = 0 to P = .512 (Figure 4, column 2). Eight probabilistic peak voxels were identified (Table 2). Among these, the highest probability was located at the intersection of the anterior occipital and inferior temporal sulci (52, −66, 10), very near the peak voxel location (56, −64, 6) given by the whole-brain GLM analysis.
3.3 Inter-run reliability
Within each aROIs we compared each participant’s face-selective (N=47) and biological motion-selective (N=68) activation from two time-series acquired within a single experimental session.
Face-scene localizer
Within the VT, the mean Euclidean distance between response peaks across runs was 5 mm (± 1).
The mean overlap ratio (see Methods) at z thresholds of 1.65, 2.3 3.1, 4, and 5 was .63 (± .04), .65 (± .03), .63 (.03), .57 (± .04), .59 (± .05), respectively (Figure 5). As the threshold increased, the sample size decreased (i.e. fewer participants had a sufficient number of above-threshold voxels). The sample size for the analysis at each of the z-scores was 43, 40, 36, 36, 24, respectively. The average of the top 10% of all z-scores within this ROI was 2.85 (± .20).
Within the LT, the mean Euclidean distance between response peaks across runs was 12 mm (± 2).
The mean overlap ratio (see Methods) at z thresholds of 1.65, 2.3 3.1, 4, and 5 was .29 (± .04), .26 (± .04), .30 (± .07), .32 (± .10), 0, respectively (Figure 5). The sample size for the analysis at each of the z-scores was 41, 29, 13, 6, 0, respectively. The average of the top 10% of all z-scores within this ROI was 1.90 (± .14).
Biomotion localizer
Within the VT, the mean Euclidean distance between response peaks across runs was 14 mm (± 1).
The mean overlap ratio (see Methods) at z thresholds of 1.65, 2.3 3.1, 4, and 5 was .23(± .04), .23 (± .05), .23 (± .08), 0, 0, respectively (Figure 5). The sample size for the analysis at each of the z-scores was 42, 21, 6, 0, 0, respectively. The average of the top 10% of all z-scores within this ROI was 1.52 (± .12).
Within the LT, the mean Euclidean distance between response peaks across runs was 17 mm (± 1).
The mean overlap ratio (see Methods) at z thresholds of 1.65, 2.3 3.1, 4, and 5 was .16 (± .03), .10 (± .04), .02 (± .02), 0, 0, respectively (Figure 5). The sample size for the analysis at each of the z-scores was 47, 17, 6, 0, 0, respectively. The average of the top 10% of all z-scores within this ROI was 1.51 (± .12).
3.4 Comparison of face and biological motion functional selectivity
As is evident in Figure 1, there was substantial overlap in the pattern of activation for face- and bio-voxels (Figure 6). In order to see whether the overlap was also evident at the peak response locations, we overlaid both sets of peak responses on the same brain (Figure 7). Here we rendered the data in volume space rather than on a segmented surface in order to avoid potentially misleading spatial distortions that can occur when displaying voxels that straddle anatomical boundaries such as grey/white matter or across a sulcus. We observed substantial overlap of the peak responses, particularly in the ventral and lateral temporal cortices.
Figure 6. Overlap of voxels activated in the face and biological motion localizers.
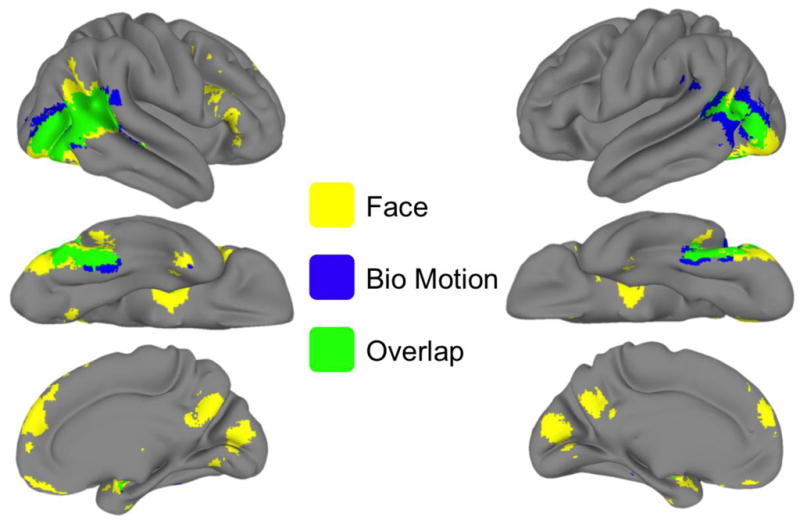
The results show (YELLOW) face-voxels (GREEN), bio-voxels, and (BLUE) the intersection of face- and bio-voxels. All voxels were defined as face-selective or biomotion-selective in their respective localizer, q(FDR) < .001). The right (a) and left (b) hemispheres are displayed in each column. The first row shows the lateral surface, the second row shows the ventral surface, and the third row shows the medial surface. This visualization makes apparent the striking overlap in the occipitotemporal cortices.
Figure 7. Overlap of peak face- and bio- voxels.

Painted on the cortical surface are spheres centered on local maxima locations of derived from the group-level GLM (see Figure 1) on the right ventral temporal cortex. YELLOW indicates voxels included in a face-voxel sphere, BLUE indicates voxels included in a bio-voxel sphere, and GREEN indicates voxels that are included in both a face- and bio-voxel sphere. The peaks were identified from within our ventral and lateral temporal cortices masks. On the ventral surface there is one bio-voxel peak, which overlaps with the more anterior of two face-voxel peaks. On the lateral surface there are 4 bio-voxel peaks and 2 face-voxel peaks, one of which partially overlaps with one of the bio-voxels.
4. Discussion
In this report we have used a large fMRI dataset to characterize the brain regions, and the spatial reliability of these regions, engaged while viewing faces and biological motion in common fMRI localizer tasks, and to create functional probabilistic atlases of these category-selective responses that are freely available to the fMRI community. We have found that the faces and biological motion evoke substantially overlapping BOLD activation distributions but with separate activation peaks. In what follows we will review the regions showing functional selectivity for face and/or biological motion, discuss the implications of the similar response maps evoked by these stimuli, and describe the stability of these regions over time.
4.1 Category-selective activity
4.1.1 Face Activation
Whole-brain GLM analysis showed expansive face-selective activation; from which we identified seventeen activation peaks. Among these, the five most significant peaks (z ≥ 13) were located on the right FG, right anterior occipital sulcus, right pSTS, and bilateral amygdala.
The mid-FG has been long known to show a preferential response to faces (e.g. Sergent et al., 1992; Haxby et al., 1994; Puce et al., 1995; Kanwisher et al., 1997), and has been termed the ‘fusiform face area’ on this basis (FFA; Kanwisher et al., 1997). Here we report evidence for two separate peaks of activation along the right FG and an additional two peaks along the left FG. These results are consistent with other recent studies that have identified two face selective regions along the right fusiform (Pinsk et al., 2009; Weiner and Grill-Spector, 2011). We were concerned that our result might simply reflect spatial variation across subjects of an otherwise single functional area. Put plainly, an activation map with two seemingly distinct peaks could be an artifact of a sample in which the location of the FFA for some subset of participants is anterior to the location of the FFA in the remaining subset of participants. If these areas represent distinct functional regions we would expect a similar distribution over space within individuals. Indeed, we found that this was the case. Within each subject we identified the location of the top two local peaks of face-selectivity within the VT aROI without imposing any additional constraints. On average, the location of these peaks varied by 10 mm along the y-axis, by less than 6 mm on the x- and z-axes. Moreover, the average location of each participants anterior FFA was only 6 mm from the group-level anterior rFFA, and the average location of each participants posterior rFFA was only 5 mm from the group-level posterior rFFA. We interpret this as compelling evidence for two distinct face areas along the fusiform gyrus.
The right anterior occipital sulcus is also a region commonly activated in face localizer tasks and thus named the ‘occipital-face area’ (OFA; Gauthier et al., 2000). Although there is some evidence for functional specialization of this region (Rotshtein et al., 2005; Pitcher et al., 2007; Nichols et al., 2010; Liu et al., 2010), this area is often contiguous with the FFA raising similar concerns as those described above regarding spatial heterogeneity across subjects. If this were so, one would expect a fairly continuous and unbroken activation extending from the FFA to the rOFA. This is indeed what we see when looking at the statistical results from the group-level GLM. However, inspection of the probability maps reveals a distinct valley separating these two regions. This indicates that large numbers of subjects activate these regions, whereas relatively few activate the intermediate area, suggesting that these are indeed distinct regions.
One of the strongest peaks of face-selective activation was found in the right pSTS, another commonly reported region in the face processing literature. Indeed, an influential model of face perception proposes that the FFA, OFA, and pSTS are ‘core’ regions of a neural face-processing network (cf. Haxby et al., 2000). It is thought that the pSTS is primarily involved the representation of dynamic face features that facilitate recognition of gaze-direction and emotional expression (Puce et al., 1998; Haxby et al., 2000; Engell and Haxby, 2007; Said et al., 2010).
The amygdala’s involvement in face perception is supported by both monkey and human neuropsychological studies (Kluver and Bucy, 1939; Adolphs et al., 1994; Young et al., 1995; Calder, 1996; Broks et al., 1998; Amaral, 2002), single cell electrophysiology (Leonard et al., 1985; Kreiman et al., 2000; Fried et al., 1997), and neuroimaging (Morris et al., 1996; Hoffman et al., 2007; Hadj-Bouziane et al., 2008). Amygdala activation evoked by faces is so pervasive that some have argued it is a truly integral part of normal face-perception and should not be relegated to the status of an ancillary or ‘extended’ node of the neural face processing network (Todorov, 2012). A recent review suggests that the primary role of the amygdala in the context of face perception is to represent an individual face in a multi-dimensional face space (MDFS; Todorov, 2012).
Finally, we found that the brain’s response during face perception was biased to the right hemisphere (RH). This is consistent with a widely accepted RH dominance of face perception. The peak statistical significance and the extent of the activated region were larger in the right occipitotemporal cortex and right amygdala, while inferior frontal activation was found exclusively in the RH. It should be noted however, that the extent of activation of the left occipitotemporal cortex and amygdala was substantial and contained highly significant peaks of activity. Substantial left hemisphere BOLD responses are particularly interesting in the context of intracranial EEG studies of face perception, which do not find evidence of right-hemisphere dominance based on the location and observed number of face-selective ERPs recorded from the ventral surface of occipitotemporal cortex (Allison et al., 1994; Allison et al., 1999; Engell and McCarthy, 2011).
4.1.2 Biological motion activation
Whole-brain GLM analysis showed expansive biological motion-selective activation; within which we identified ten activation peaks. Among these, the five most significant peaks (z ≥ 7) were located on the right FG, bilateral anterior occipital/inferior temporal sulci (one peak in the RH, two peaks in the LH), and right pSTS.
The biological motion-selective peak on the FG is slightly anterior to the aFFA and is thus consistent with the relative location of the ‘fusiform body area’ (FBA; Schwarzlose et al., 2005), an area of ventral temporal cortex that responds more strongly to the perception of bodies than to faces or other objects (Schwarzlose et al., 2005; Peelen and Downing, 2005; Peelen et al., 2006; Pinsk et al., 2009; van de Riet et al., 2009). Despite spatial overlap of the FFA and FBA, it has been argued that these are functionally distinct regions (Schwarzlose et al., 2005; Peelen et al., 2006; Weiner and Grill-Spector, 2011).
The intersection of the anterior occipital and inferior temporal sulci has been shown to have a category-selective response to biological motion (Bonda et al., 1996; Peelen et al., 2006; Grezes et al., 2007; Pichon et al., 2008; but see Grossman and Blake, 2002) and body-parts (Downing et al., 2001; Hadjikhani and de Gelder, 2003; Peelen and Downing, 2005; see de Gelder et al., 2010 for review), and thus named the ‘extra-striate body area’(EBA; Downing et al., 2001). Recent investigations using high-resolution fMRI suggest that the EBA is not a single region, but rather a series of three discontinuous segments that partially surround hMT+ (cf. Weiner and Grill-Spector, 2011), a cortical region critical for motion perception (McCarthy et al., 1994; Tootell et al., 1995; DeYoe et al., 1996; Huk et al., 2002).
The pSTS (primarily in the right hemisphere) is engaged during perception of biological motion (Bonda et al., 1996; Puce et al., 1998; Grossman et al., 2000; Grossman and Blake, 2002; Pelphrey et al., 2003; Beauchamp et al., 2003; Saygin et al., 2003). Although its role in biological perception is yet to be determined, several reports suggest that it is responsible for encoding and updating another’s goals based on their actions (Allison et al., 2000; Pelphrey et al., 2004; Shultz et al., 2011; Shultz and McCarthy, 2011).
4.2 Reliability of the localizer responses
Despite some debate as to when it is appropriate to adopt an fROI approach (cf. Friston et al., 2006; Saxe et al., 2006), it is a widely used method for analyzing functional magnetic resonance imaging (fMRI) data. Indeed, the inclusion of localizer tasks is often required by reviewers (Friston and Henson, 2006). It is thus important to have a firm understanding of how well these localizers capture stable functional regions across time and across individuals.
Localizer task data are most often acquired in separate time-series (i.e. runs) within the same scanning session, and occasionally from time-series acquired in a separate experimental session from the main experimental task. Analysis of the experimental task is then done on the average data from voxels identified at, or in some diameter around, the peak category-selective response. Therefore, an assumption of the localizer approach to fMRI analysis is that the locations of the regions of peak-selectivity are stable over time within each individual. This is particularly critical when two or more category-selective regions are thought to be spatially adjacent. The validity of this assumption has heretofore not been tested for visual category-selective regions using a large sample of participants.
We tested the inter-run stability within each aROI using two different measures; Euclidean distance of the peak response from run to run, and the overlap of the distributed activation. In many cases, the functional ROI is defined as a sphere centered on the peak response localizer response. The Euclidean distance is thus a useful measure to evaluate the validity of this approach. However, this can also be a somewhat fragile metric because variations in noise might nudge a voxel in to or out of the peak position. Therefore, we also measured reliability using an activation overlap ratio (cf. Duncan et al., 2009) that takes into consideration the spatially distributed response.
Across both localizers and both aROIs we noted three prominent trends. First, the face-selective response was more reliable than the biological motion-selective response. Second, Responses in the ventral temporal cortex were more reliable than those in the lateral temporal cortex. Third, the reliability was roughly related to effect size.
Within ventral temporal cortex, we observed good stability of the peak face response. On average, the location of this peak varied by 5 mm (a distance near the sampling resolution of our data). The overlap ratio also showed reasonable reliability, but also revealed some instability. Approximately 40% of the voxels were activated by faces in one run, but not the other. At the liberal threshold of z > 1.65, these face reliability results are roughly consistent with those reported for language localizers (Duncan et al., 2009). However, in that study it was reported that the overlap ratio decreased somewhat precipitously as the z-threshold for voxel inclusion increased, whereas the overlap of the face responses did not vary as a function of this threshold.
In the lateral temporal cortex, the face response reliability was relatively poor. The Euclidean distance between response peaks was 12 mm and the majority of voxels activated in one run were not activated in the other. On one hand, this might be due to smaller effect sizes that increase the sensitivity of a given voxel’s z-score to run to run noise. The average z-score of the top ten-percent of all voxels in the VT region was 2.85, and 1.9 in the LT region. On the other hand, we predicted that this volatility would have less of an effect at the lower z-thresholds, but this was not the case.
The biological motion response in the VT was considerably less reliable that the face response. The majority of voxels showed an inconsistent response by reaching significance in only one of the two runs, and the peaks were separated by an average of 15 mm. As with the face response, biological motion response reliability was worse in the LT than in the VT. There was only modest overlap between the runs (~15% of activated voxels) and only at the most liberal threshold. Additionally, the peaks across runs were separated by 17 mm.
Overall, the variability of the responses suggests that identification of a stable response peak might require more power than is afforded by a single localizer run. Other than the face response in the VT, the mean of the top-ten percent of z-scores was less than 2 and therefore, hovering very close to noise thresholds. One therefore might expect that the distributed response would be less volatile than the peak response. Surprisingly, we found that this was not so as the overlap ratio was generally poor. The exception to the poor reliability was for the face response in the VT. It is likely no coincidence, then, that the average top-ten percent of z-scores (2.85) was approximately 67% larger than the biological motion responses or the face response in the LT.
The poor reliability performance reported here highlights the limitations of functional localizer-based analyses, which should be considered when designing experiments and interpreting results. However, it is possible that the poor reliability of the current data is partially due to our use of standard resolution (i.e. ~3 mm3) for fMRI acquisition. Schwarzlose and colleagues (2005) reported that acquiring data at high-resolution resulted in stronger category-selective responses within functionally defined ROIs. This means that using higher spatial resolution, which presumably increases the fidelity of the category-selective signal by minimizing partial volume effects, might mitigate SNR issues discussed above.
4.3 Probabilistic Atlases
Functional probabilistic atlases assign each voxel in the brain a likelihood estimate representing the probability of a significant category-selective response in that voxel. Perhaps unsurprisingly, the probabilistic atlases largely recapitulate the GLM contrast maps (compare Figure 1 to 4).
These atlases can be used to facilitate and augment analysis of fMRI data with or without independent localizer information. For instance, when independent functional localizer data is not acquired, the probabilistic atlas allows for interpretation of the results with regard to known areas of functional selectivity. When localizer task data is collected within the context of a given study, the selection of fROIs is often based on subjective identification by the experimenter. Moreover, the parameters used to constrain these selections often go unreported (Duncan and Devlin, 2011), resulting in a large source of variance across studies and laboratories. We propose that the atlases we have created can be applied to assist in defining these regions in a more automated, and thus, principled manner. For instance, one could constrain the borders of an fROI by intersecting a participant’s activating map with a binary mask representing some minimum probability value. This approach not only simplifies the identification of these regions, but it will also result in simpler reporting of the precise methods used to define fROIs. It has been argued that accurate reporting of such parameters is a key step to improving the inter-study reliability of functional localizers (Duncan and Devlin, 2011).
An intriguing application of these atlases would be to use them to define prior probabilities in Bayesian statistical analyses. Bayesian approaches are becoming an increasing popular alternative to Frequentist statistics for analysis of fMRI data. One limitation of these analyses is the need to assign posterior probabilities that can be somewhat arbitrary. These probabilistic atlases furnish experimenters with priors that have a strong empirical foundation.
For all atlases, the value at each voxel represents the proportion of participants who showed a significant difference (z ≥ 1.65) in the contrast of interest (e.g. faces > scenes). We have also made available a second face localizer probabilistic atlas that used houses instead of scenes as the control stimulus. Though not detailed here, the same procedures described in this paper were applied to a sample of 79 participants. Notably, the peak probabilistic voxel location was very similar in both the face > scene and face > house analysis and to the face > car localizer task result reported by Rossion (2012b), suggesting that the location peak face voxel on the mid-fusiform gyrus is largely insensitive to the choice of control category.
We have also created probabilistic atlases for scenes and houses (based on independent contrasts with faces) that can be used to facilitate localization of scene and/or house category-selective areas. We do not discuss the scene or house results here, but these atlases are also available.
4.4 Comparison of face and biological motion functional selectivity
We observed a striking similarity of the distribution of face and biological motion-specific voxels in occipitotemporal cortex (see Figure 6) and the amygdala that raises questions regarding the selectivity of the underlying neural populations that give rise to these BOLD responses. Are these overlapping activations functionally distinct or do they reflect inter-dependent processing?
In support of the former notion, we noted a spatial difference in the coordinates of the peak face- and biological motion selective responses (Figure 7). For instance, in the overlapping ventral FG region sensitive to both face and biological motion, the peak biological motion response was 4 mm anterior to the peak face response. This could suggest the presence of functionally distinct though spatially blurred regions. Indeed, several studies that investigated the overlap between face and static body responses have made an analogous argument (Schwarzlose et al., 2005; Peelen et al., 2006; Kriegeskorte et al., 2008; Weiner and Grill-Spector, 2010).
We propose an alternate view in which the biological motion activation of the ventral temporal cortex reflects a modulatory input to the face (and body) perception network. It was recently proposed that face- and body-selective areas are topographically organized in a series of independent spatially interleaved clusters (Weiner and Grill-Spector, 2011). Unfortunately, in the current study we did not test for body-selective regions and so cannot speak to this directly. However, consistent with the proposal, we did observe a series of spaced face selective regions extending from occipital cortex along the lateral surface to the pSTS and along the ventral surface to the anterior FFA. Perhaps then, the slight offset between face- and biological motion- selective peaks reflects a shift toward an adjacent body parts peak.
Our laboratory has recently introduced a model that, in part, proposes ventral regions such as the FFA and FBA are part of a processing stream specialized for the detection of animate agents via human-like surface features such as faces and body forms, whereas lateral regions such as the EBA and pSTS are specialized for the detection of animate agents through biological motion (Shultz and McCarthy, 2011). Critically, this model hypothesizes that activation of the ventral stream will recruit and activate the lateral stream (and vice-versa). Therefore, we suggest that the activation of ventral temporal cortex during perception of biological motion does not indicate the presence of a specialized biological motion-selective area per se in this region. Rather, this activation reflects the recruitment of the ventral face and body-part-selective regions by the pSTS in the service of identifying and inferring the intentions of animate agents.
We have previously suggested on the basis of ERP recordings made directly from ventral temporal cortex that there may be a temporal dimension to modular processing (Puce et al., 1999). In our more recent papers we note that the initial face-selective ERP is largely insensitive to task, but is followed by a longer duration gamma oscillation that is sensitive to task demands (Engell and McCarthy, 2010; Engell and McCarthy, 2011). These findings suggest a possible mechanism for how functional-selectivity can be have both temporal and spatial dimensions that would allow brain regions initially selective for face and/or body form to integrate information from other brain regions. The representation of abstract categories, such as “animate agents”, might thus be supported by the interactions of form and motion among these regions over a time-window that extends beyond the initial stimulus evoked response. The shifting selectivity of these regions likely occurs too quickly to be resolved by fMRI, but is consistent with our EEG findings (Engell and McCarthy, 2010; Engell and McCarthy, 2011; Engell et al., 2012) and with single-cell recording in the macaque (Sugase et al., 1999).
5. Conclusions
We have used a large sample fMRI localizer to characterize the brain’s response while viewing faces and biological motion. Of particular interest, we offer evidence in support of previous findings that there are at least two face selective regions along the fusiform gyrus, rather than a single area. Investigating the reliability of face- and biological motion-evoked activity, we found that the stability of the response distribution and the peak activation location acquired in separate time-series is surprisingly variable. This variability violates a key assumption of the localizer approach; that the peak response is spatially stable and can thus be selectively probed in independently acquired time-series. In addition to these analyses, we have taken advantage of the large data set to create, and make available, probabilistic atlases of visual-category perception. Finally, we observe a striking amount of overlap between face and biological-motion activations. We speculate that ventral temporal cortex does not have a category-selective region for biological motion, but rather, the evoked response represents modulation of face- and body-selective
Highlights.
Category--selective BOLD response does not necessarily reflect neuronal selectivity
‘Face---specific’ regions are part of a system for the detection of animate agents
Characterized the response spatial stability of face and bio---motion localizers
Made available functional probabilistic atlases for multiple object categories
Acknowledgments
We thank William Walker for assistance in data acquisition and analysis. We thank Ben Deen, Grace Fisher, Tao Gao, Yi He, Su Mei Lee, Samuel Norman-Haignere, Sara Schultz, Nicholas Turk-Browne, and Emily Ward for contributing data to this project. This research was supported by a National Institute of Mental Health fellowship MH-093986 (ADE), National Institute of Mental Health grant MH-05286 (GM), and National Institute of Neurological Disorders and stroke grant NS-41328 (GM).
Footnotes
Publisher's Disclaimer: This is a PDF file of an unedited manuscript that has been accepted for publication. As a service to our customers we are providing this early version of the manuscript. The manuscript will undergo copyediting, typesetting, and review of the resulting proof before it is published in its final citable form. Please note that during the production process errors may be discovered which could affect the content, and all legal disclaimers that apply to the journal pertain.
References
- Adolphs R, Tranel D, Damasio H, Damasio A. Impaired recognition of emotion in facial expressions following bilateral damage to the human amygdala. Nature. 1994;372 (6507):669–672. doi: 10.1038/372669a0. [DOI] [PubMed] [Google Scholar]
- Aguirre GK, Zarahn E, Desposito M. An area within human ventral cortex sensitive to building stimuli: evidence and implications. Neuron. 1998;21 (2):373–383. doi: 10.1016/s0896-6273(00)80546-2. [DOI] [PubMed] [Google Scholar]
- Allison T, Ginter H, McCarthy G, Nobre AC, Puce A, Luby M, Spencer DD. Face recognition in human extrastriate cortex. Journal of neurophysiology. 1994;71 (2):821. doi: 10.1152/jn.1994.71.2.821. [DOI] [PubMed] [Google Scholar]
- Allison T, Puce A, McCarthy G. Social perception from visual cues: role of the STS region. Trends in cognitive sciences. 2000;4 (7):267–278. doi: 10.1016/s1364-6613(00)01501-1. [DOI] [PubMed] [Google Scholar]
- Allison T, Puce A, Spencer DD, McCarthy G. Electrophysiological studies of human face perception. I: Potentials generated in occipitotemporal cortex by face and non-face stimuli. Cerebral Cortex. 1999;9 (5):415. doi: 10.1093/cercor/9.5.415. [DOI] [PubMed] [Google Scholar]
- Amaral DG. The primate amygdala and the neurobiology of social behavior: implications for understanding social anxiety. Biol Psychiatry. 2002;51 (1):11–7. doi: 10.1016/s0006-3223(01)01307-5. [DOI] [PubMed] [Google Scholar]
- Beauchamp MS, Lee KE, Haxby JV, Martin A. FMRI responses to video and point-light displays of moving humans and manipulable objects. Journal of Cognitive Neuroscience. 2003;15 (7):991–1001. doi: 10.1162/089892903770007380. [DOI] [PubMed] [Google Scholar]
- Berman MG, Park J, Gonzalez R, Polk TA, Gehrke A, Knaffla S, Jonides J. Evaluating functional localizers: the case of the FFA. Neuroimage. 2010;50 (1):56–71. doi: 10.1016/j.neuroimage.2009.12.024. [DOI] [PMC free article] [PubMed] [Google Scholar]
- Bonda E, Petrides M, Ostry D, Evans A. Specific involvement of human parietal systems and the amygdala in the perception of biological motion. The Journal of Neuroscience. 1996;16 (11):3737–3744. doi: 10.1523/JNEUROSCI.16-11-03737.1996. [DOI] [PMC free article] [PubMed] [Google Scholar]
- Broks P, Young AW, Maratos EJ, Coffey PJ, Calder AJ, Isaac CL, Mayes AR, Hodges JR, Montaldi D, Cezayirli E. Face processing impairments after encephalitis: amygdala damage and recognition of fear. Neuropsychologia. 1998;36 (1):59–70. doi: 10.1016/s0028-3932(97)00105-x. [DOI] [PubMed] [Google Scholar]
- Calder AJ. Facial emotion recognition after bilateral amygdala damage: Differentially severe impairment of fear. Cognitive Neuropsychology. 1996;13 (5):699–745. [Google Scholar]
- Cox RW. AFNI: software for analysis and visualization of functional magnetic resonance neuroimages. Computers and Biomedical Research. 1996;29 (3):162–173. doi: 10.1006/cbmr.1996.0014. [DOI] [PubMed] [Google Scholar]
- DeYoe EA, Carman GJ, Bandettini P, Glickman S, Wieser J, Cox R, Miller D, Neitz J. Mapping striate and extrastriate visual areas in human cerebral cortex. Proceedings of the National Academy of Sciences. 1996;93 (6):2382. doi: 10.1073/pnas.93.6.2382. [DOI] [PMC free article] [PubMed] [Google Scholar]
- Downing PE, Jiang Y, Shuman M, Kanwisher N. A cortical area selective for visual processing of the human body. Science. 2001;293 (5539):2470–3. doi: 10.1126/science.1063414. [DOI] [PubMed] [Google Scholar]
- Duncan KJ, Pattamadilok C, Knierim I, Devlin JT. Consistency and variability in functional localisers. Neuroimage. 2009;46 (4):1018–1026. doi: 10.1016/j.neuroimage.2009.03.014. [DOI] [PMC free article] [PubMed] [Google Scholar]
- Duncan KJ, Pattamadilok C, Knierim I, Devlin JT. Consistency and variability in functional localisers. Neuroimage. 2009;46 (4):1018–1026. doi: 10.1016/j.neuroimage.2009.03.014. [DOI] [PMC free article] [PubMed] [Google Scholar]
- Duncan KJK, Devlin JT. Improving the reliability of functional localizers. Neuroimage. 2011 doi: 10.1016/j.neuroimage.2011.05.009. [DOI] [PubMed] [Google Scholar]
- Engell AD, Haxby JV. Facial expression and gaze-direction in human superior temporal sulcus. Neuropsychologia. 2007;45 (14):3234–41. doi: 10.1016/j.neuropsychologia.2007.06.022. [DOI] [PubMed] [Google Scholar]
- Engell AD, McCarthy G. The relationship of gamma oscillations and face-specific ERPs recorded subdurally from occipitotemporal cortex. Cereb Cortex. 2011;21 (5):1213–21. doi: 10.1093/cercor/bhq206. [DOI] [PMC free article] [PubMed] [Google Scholar]
- Engell AD, McCarthy G. Selective attention modulates face-specific induced gamma oscillations recorded from ventral occipitotemporal cortex. J Neurosci. 2010;30 (26):8780–6. doi: 10.1523/JNEUROSCI.1575-10.2010. [DOI] [PMC free article] [PubMed] [Google Scholar]
- Engell AD, Huettel S, McCarthy G. The fMRI BOLD signal tracks electrophysiological spectral perturbations, not event-related potentials. Neuroimage. 2012;59 (3):2600–6. doi: 10.1016/j.neuroimage.2011.08.079. [DOI] [PMC free article] [PubMed] [Google Scholar]
- Epstein R, Kanwisher N. A cortical representation of the local visual environment. Nature. 1998;392 (6676):598–601. doi: 10.1038/33402. [DOI] [PubMed] [Google Scholar]
- Epstein R, Harris A, Stanley D, Kanwisher N. The Parahippocampal Place Area::Recognition, Navigation, or Encoding? Neuron. 1999;23 (1):115–125. doi: 10.1016/s0896-6273(00)80758-8. [DOI] [PubMed] [Google Scholar]
- Fried I, MacDonald KA, Wilson CL. Single neuron activity in human hippocampus and amygdala during recognition of faces and objects. Neuron. 1997;18 (5):753–765. doi: 10.1016/s0896-6273(00)80315-3. [DOI] [PubMed] [Google Scholar]
- Friston J, Henson N. Commentary on: Divide and conquer; a defence of functional localises. Neuroimage. 2006;30 (4):1097–1099. [Google Scholar]
- Friston KJ, Rotshtein P, Geng JJ, Sterzer P, Henson RN. A critique of functional localisers. Neuroimage. 2006;30 (4):1077–1087. doi: 10.1016/j.neuroimage.2005.08.012. [DOI] [PubMed] [Google Scholar]
- Gauthier I, Tarr MJ, Moylan J, Skudlarski P, Gore JC, Anderson AW. The fusiform face area is part of a network that processes faces at the individual level. Journal of Cognitive Neuroscience. 2000;12 (3):495–504. doi: 10.1162/089892900562165. [DOI] [PubMed] [Google Scholar]
- de Gelder B, Van den Stock J, Meeren HK, Sinke CB, Kret ME, Tamietto M. Standing up for the body. Recent progress in uncovering the networks involved in the perception of bodies and bodily expressions. Neurosci Biobehav Rev. 2010;34 (4):513–27. doi: 10.1016/j.neubiorev.2009.10.008. [DOI] [PubMed] [Google Scholar]
- Grezes J, Pichon S, De Gelder B. Perceiving fear in dynamic body expressions. Neuroimage. 2007;35 (2):959–967. doi: 10.1016/j.neuroimage.2006.11.030. [DOI] [PubMed] [Google Scholar]
- Grossman E, Donnelly M, Price R, Pickens D, Morgan V, Neighbor G, Blake R. Brain areas involved in perception of biological motion. Journal of Cognitive Neuroscience. 2000;12 (5):711–720. doi: 10.1162/089892900562417. [DOI] [PubMed] [Google Scholar]
- Grossman ED, Blake R. Brain areas active during visual perception of biological motion. Neuron. 2002;35 (6):1167–1175. doi: 10.1016/s0896-6273(02)00897-8. [DOI] [PubMed] [Google Scholar]
- Hadj-Bouziane F, Bell AH, Knusten TA, Ungerleider LG, Tootell RBH. Perception of emotional expressions is independent of face selectivity in monkey inferior temporal cortex. Proceedings of the National Academy of Sciences. 2008;105 (14):5591. doi: 10.1073/pnas.0800489105. [DOI] [PMC free article] [PubMed] [Google Scholar]
- Hadjikhani N, de Gelder B. Seeing fearful body expressions activates the fusiform cortex and amygdala. Current Biology. 2003;13 (24):2201–2205. doi: 10.1016/j.cub.2003.11.049. [DOI] [PubMed] [Google Scholar]
- Haxby JV, Gobbini MI, Furey ML, Ishai A, Schouten JL, Pietrini P. Distributed and overlapping representations of faces and objects in ventral temporal cortex. Science. 2001;293 (5539):2425–30. doi: 10.1126/science.1063736. [DOI] [PubMed] [Google Scholar]
- Haxby JV, Hoffman EA, Gobbini MI. The distributed human neural system for face perception. Trends Cogn Sci. 2000;4 (6):223–233. doi: 10.1016/s1364-6613(00)01482-0. [DOI] [PubMed] [Google Scholar]
- Haxby JV, Horwitz B, Ungerleider LG, Maisog JM, Pietrini P, Grady CL. The functional organization of human extrastriate cortex: a PET-rCBF study of selective attention to faces and locations. The Journal of Neuroscience. 1994;14 (11):6336–6353. doi: 10.1523/JNEUROSCI.14-11-06336.1994. [DOI] [PMC free article] [PubMed] [Google Scholar]
- Hoffman KL, Gothard KM, Schmid MC, Logothetis NK. Facial-expression and gaze-selective responses in the monkey amygdala. Curr Biol. 2007;17 (9):766–72. doi: 10.1016/j.cub.2007.03.040. [DOI] [PubMed] [Google Scholar]
- Huk AC, Dougherty RF, Heeger DJ. Retinotopy and functional subdivision of human areas MT and MST. The Journal of Neuroscience. 2002;22 (16):7195–7205. doi: 10.1523/JNEUROSCI.22-16-07195.2002. [DOI] [PMC free article] [PubMed] [Google Scholar]
- Ishai A, Ungerleider LG, Martin A, Schouten JL, Haxby JV. Distributed representation of objects in the human ventral visual pathway. Proceedings of the National Academy of Sciences. 1999;96 (16):9379. doi: 10.1073/pnas.96.16.9379. [DOI] [PMC free article] [PubMed] [Google Scholar]
- Kanwisher N, McDermott J, Chun MM. The fusiform face area: a module in human extrastriate cortex specialized for face perception. The Journal of Neuroscience. 1997;17 (11):4302–4311. doi: 10.1523/JNEUROSCI.17-11-04302.1997. [DOI] [PMC free article] [PubMed] [Google Scholar]
- Kluver H, Bucy PC. Preliminary analysis of functions of the temporal lobes in monkeys. Archives of Neurology & Psychiatry. 1939;42 (6):979. doi: 10.1176/jnp.9.4.606. [DOI] [PubMed] [Google Scholar]
- Kreiman G, Koch C, Fried I. Category-specific visual responses of single neurons in the human medial temporal lobe. Nat Neurosci. 2000;3 (9):946–53. doi: 10.1038/78868. [DOI] [PubMed] [Google Scholar]
- Kriegeskorte N, Mur M, Bandettini P. Representational similarity analysis-connecting the branches of systems neuroscience. Front Syst Neurosci. 2008;2:4. doi: 10.3389/neuro.06.004.2008. [DOI] [PMC free article] [PubMed] [Google Scholar]
- Kung CC, Peissig JJ, Tarr MJ. Is region-of-interest overlap comparison a reliable measure of category specificity? Journal of cognitive neuroscience. 2007;19 (12):2019–2034. doi: 10.1162/jocn.2007.19.12.2019. [DOI] [PubMed] [Google Scholar]
- Leonard CM, Rolls ET, Wilson FAW, Baylis GC. Neurons in the amygdala of the monkey with responses selective for faces. Behavioural brain research. 1985;15 (2):159–176. doi: 10.1016/0166-4328(85)90062-2. [DOI] [PubMed] [Google Scholar]
- Liu J, Harris A, Kanwisher N. Perception of face parts and face configurations: an fMRI study. Journal of Cognitive Neuroscience. 2010;22 (1):203–211. doi: 10.1162/jocn.2009.21203. [DOI] [PMC free article] [PubMed] [Google Scholar]
- McCarthy G, Puce A, Gore JC, Allison T. Face-specific processing in the human fusiform gyrus. Journal of Cognitive Neuroscience. 1997;9 (5):605–610. doi: 10.1162/jocn.1997.9.5.605. [DOI] [PubMed] [Google Scholar]
- McCarthy GM, Spicer MS, Adrignolo AA, Luby ML, Gore JG, Allison TA. Brain activation associated with visual motion studied by functional magnetic resonance imaging in humans. Human Brain Mapping. 1994;2 (4):234–243. [Google Scholar]
- Morris JS, Frith CD, Perrett DI, Rowland D, Young AW, Calder AJ, Dolan RJ. A differential neural response in the human amygdala to fearful and happy facial expressions. 1996. [DOI] [PubMed] [Google Scholar]
- Nichols DF, Betts LR, Wilson HR. Decoding of faces and face components in face-sensitive human visual cortex. Front Psychol. 2010;1:28. doi: 10.3389/fpsyg.2010.00028. [DOI] [PMC free article] [PubMed] [Google Scholar]
- Peelen MV, Downing PE. The neural basis of visual body perception. Nature Reviews Neuroscience. 2007;8 (8):636–648. doi: 10.1038/nrn2195. [DOI] [PubMed] [Google Scholar]
- Peelen MV, Downing PE. Selectivity for the human body in the fusiform gyrus. J Neurophysiol. 2005;93 (1):603–8. doi: 10.1152/jn.00513.2004. [DOI] [PubMed] [Google Scholar]
- Peelen MV, Downing PE. Within-subject reproducibility of category-specific visual activation with functional MRI. Human brain mapping. 2005;25 (4):402–408. doi: 10.1002/hbm.20116. [DOI] [PMC free article] [PubMed] [Google Scholar]
- Peelen MV, Wiggett AJ, Downing PE. Patterns of fMRI activity dissociate overlapping functional brain areas that respond to biological motion. Neuron. 2006;49 (6):815–22. doi: 10.1016/j.neuron.2006.02.004. [DOI] [PubMed] [Google Scholar]
- Pelphrey KA, Mitchell TV, McKeown MJ, Goldstein J, Allison T, McCarthy G. Brain activity evoked by the perception of human walking: controlling for meaningful coherent motion. J Neurosci. 2003;23 (17):6819–25. doi: 10.1523/JNEUROSCI.23-17-06819.2003. [DOI] [PMC free article] [PubMed] [Google Scholar]
- Pelphrey KA, Morris JP, McCarthy G. Grasping the intentions of others: the perceived intentionality of an action influences activity in the superior temporal sulcus during social perception. Journal of Cognitive Neuroscience. 2004;16 (10):1706–1716. doi: 10.1162/0898929042947900. [DOI] [PubMed] [Google Scholar]
- Pichon S, de Gelder B, Grèzes J. Emotional modulation of visual and motor areas by dynamic body expressions of anger. Social neuroscience. 2008;3 (3–4):199–212. doi: 10.1080/17470910701394368. [DOI] [PubMed] [Google Scholar]
- Pinsk MA, Arcaro M, Weiner KS, Kalkus JF, Inati SJ, Gross CG, Kastner S. Neural representations of faces and body parts in macaque and human cortex: a comparative FMRI study. J Neurophysiol. 2009;101 (5):2581–600. doi: 10.1152/jn.91198.2008. [DOI] [PMC free article] [PubMed] [Google Scholar]
- Pitcher D, Walsh V, Yovel G, Duchaine B. TMS evidence for the involvement of the right occipital face area in early face processing. Curr Biol. 2007;17 (18):1568–73. doi: 10.1016/j.cub.2007.07.063. [DOI] [PubMed] [Google Scholar]
- Puce A, Allison T, McCarthy G. Electrophysiological studies of human face perception. III: Effects of top-down processing on face-specific potentials. Cerebral Cortex. 1999;9 (5):445. doi: 10.1093/cercor/9.5.445. [DOI] [PubMed] [Google Scholar]
- Puce A, Allison T, Bentin S, Gore JC, McCarthy G. Temporal cortex activation in humans viewing eye and mouth movements. The Journal of Neuroscience. 1998;18 (6):2188. doi: 10.1523/JNEUROSCI.18-06-02188.1998. [DOI] [PMC free article] [PubMed] [Google Scholar]
- Puce A, Allison T, Gore JC, McCarthy G. Face-sensitive regions in human extrastriate cortex studied by functional MRI. Journal of neurophysiology. 1995;74 (3):1192–1199. doi: 10.1152/jn.1995.74.3.1192. [DOI] [PubMed] [Google Scholar]
- Rossion B, Hanseeuw B, Dricot L. Defining face perception areas in the human brain: a large-scale factorial fMRI face localizer analysis. Brain Cogn. 2012;79 (2):138–57. doi: 10.1016/j.bandc.2012.01.001. [DOI] [PubMed] [Google Scholar]
- Rossion B, Hanseeuw B, Dricot L. Defining face perception areas in the human brain: a large-scale factorial fMRI face localizer analysis. Brain Cogn. 2012;79 (2):138–57. doi: 10.1016/j.bandc.2012.01.001. [DOI] [PubMed] [Google Scholar]
- Rotshtein P, Henson RN, Treves A, Driver J, Dolan RJ. Morphing Marilyn into Maggie dissociates physical and identity face representations in the brain. Nat Neurosci. 2005;8 (1):107–13. doi: 10.1038/nn1370. [DOI] [PubMed] [Google Scholar]
- Said CP, Moore CD, Engell AD, Todorov A, Haxby JV. Distributed representations of dynamic facial expressions in the superior temporal sulcus. Journal of vision. 2010;10(5) doi: 10.1167/10.5.11. [DOI] [PMC free article] [PubMed] [Google Scholar]
- Saxe R, Brett M, Kanwisher N. Divide and conquer: a defense of functional localizers. Neuroimage. 2006;30 (4):1088–1096. doi: 10.1016/j.neuroimage.2005.12.062. [DOI] [PubMed] [Google Scholar]
- Saygin AP, Wilson S, Haglet DJ, Jr, Bates E, Sereno MI. Brain areas involved in the processing of biological motion: Lesion-symptom mapping and fMRI. 2003. [Google Scholar]
- Schwarzlose RF, Baker CI, Kanwisher N. Separate face and body selectivity on the fusiform gyrus. J Neurosci. 2005;25 (47):11055–9. doi: 10.1523/JNEUROSCI.2621-05.2005. [DOI] [PMC free article] [PubMed] [Google Scholar]
- Sergent J, Ohta S, MacDonald B. Functional neuroanatomy of face and object processing. A positron emission tomography study. Brain. 1992;115(Pt 1):15–36. doi: 10.1093/brain/115.1.15. [DOI] [PubMed] [Google Scholar]
- Shultz S, McCarthy G. Goal-Directed Actions Activate the Face-Sensitive Posterior Superior Temporal Sulcus and Fusiform Gyrus in the Absence of Human-Like Perceptual Cues. Cereb Cortex. 2011 doi: 10.1093/cercor/bhr180. [DOI] [PMC free article] [PubMed] [Google Scholar]
- Shultz S, Lee SM, Pelphrey K, McCarthy G. The posterior superior temporal sulcus is sensitive to the outcome of human and non-human goal-directed actions. Soc Cogn Affect Neurosci. 2011;6 (5):602–11. doi: 10.1093/scan/nsq087. [DOI] [PMC free article] [PubMed] [Google Scholar]
- Sugase Y, Yamane S, Ueno S, Kawano K. Global and fine information coded by single neurons in the temporal visual cortex. Nature. 1999;400 (6747):869–873. doi: 10.1038/23703. [DOI] [PubMed] [Google Scholar]
- Swallow KM, Braver TS, Snyder AZ, Speer NK, Zacks JM. Reliability of functional localization using fMRI. Neuroimage. 2003;20 (3):1561–1577. doi: 10.1016/s1053-8119(03)00436-1. [DOI] [PubMed] [Google Scholar]
- Todorov A. The role of the amygdala in face perception and evaluation. Motiv Emot. 2012;36 (1):16–26. doi: 10.1007/s11031-011-9238-5. [DOI] [PMC free article] [PubMed] [Google Scholar]
- Tootell RB, Reppas JB, Kwong KK, Malach R, Born RT, Brady TJ, Rosen BR, Belliveau JW. Functional analysis of human MT and related visual cortical areas using magnetic resonance imaging. The Journal of Neuroscience. 1995;15 (4):3215–3230. doi: 10.1523/JNEUROSCI.15-04-03215.1995. [DOI] [PMC free article] [PubMed] [Google Scholar]
- van de Riet WA, Grezes J, de Gelder B. Specific and common brain regions involved in the perception of faces and bodies and the representation of their emotional expressions. Soc Neurosci. 2009;4 (2):101–20. doi: 10.1080/17470910701865367. [DOI] [PubMed] [Google Scholar]
- Van Essen DC. Windows on the brain: the emerging role of atlases and databases in neuroscience. Current opinion in neurobiology. 2002;12 (5):574–579. doi: 10.1016/s0959-4388(02)00361-6. [DOI] [PubMed] [Google Scholar]
- Weiner KS, Grill-Spector K. Neural representations of faces and limbs neighbor in human high-level visual cortex: evidence for a new organization principle. Psychological Research. 2011:1–24. doi: 10.1007/s00426-011-0392-x. [DOI] [PMC free article] [PubMed] [Google Scholar]
- Weiner KS, Grill-Spector K. Not one extrastriate body area: Using anatomical landmarks, hMT+, and visual field maps to parcellate limb-selective activations in human lateral occipitotemporal cortex. Neurolmage. 2011 doi: 10.1016/j.neuroimage.2011.03.041. [DOI] [PMC free article] [PubMed] [Google Scholar]
- Weiner KS, Grill-Spector K. Sparsely-distributed organization of face and limb activations in human ventral temporal cortex. Neuroimage. 2010;52 (4):1559–73. doi: 10.1016/j.neuroimage.2010.04.262. [DOI] [PMC free article] [PubMed] [Google Scholar]
- Young AW, Aggleton JP, Hellawell DJ, Johnson M, Broks P, Hanley JR. Face processing impairments after amygdalotomy. Brain. 1995;118 (1):15–24. doi: 10.1093/brain/118.1.15. [DOI] [PubMed] [Google Scholar]