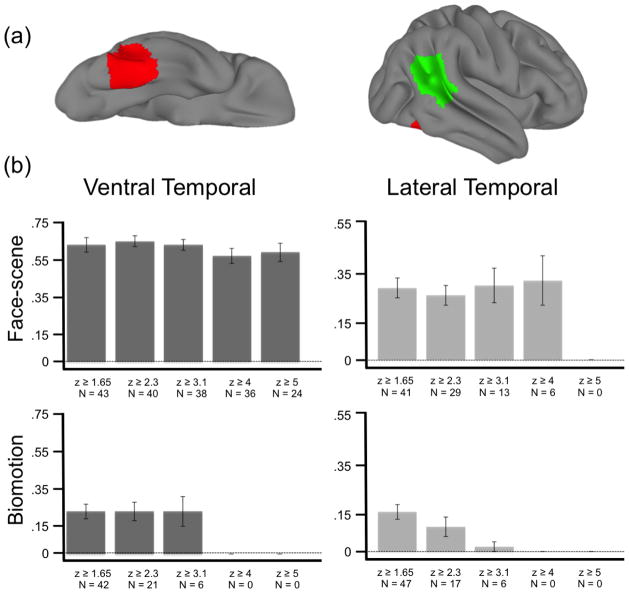
Figure 5. Inter-run reliability.
(a) Two right-hemisphere regions of interest (aROIs) were created for this analysis. The (RED) ventral and (GREEN) lateral temporal aROI masks are displayed on the lateral and ventral cortical surface of a standard brain. (b) The inter-run overlap ratio for the (top row) face-scene and (bottom row) biomotion localizer tasks. Inter-run reliability is operationalized here as the mean overlap-ratio (see methods) from within two time-series acquired during the same experimental session. These overlap ratios were calculated for statistical maps threshold at five different z-values (x-axis of each plot).

