

Abstract
Granule cells of the dentate gyrus (DG) generally have multiple place fields, whereas CA3 cells, which are second order, have only a single place field. Here, we explore the mechanisms by which the high selectivity of CA3 cells is achieved. Previous work showed that the multiple place fields of DG neurons could be quantitatively accounted for by a model based on the number and strength of grid cell inputs and a competitive network interaction in the DG that is mediated by gamma frequency feedback inhibition. We have now built a model of CA3 based on similar principles. CA3 cells receive input from an average of one active DG cell and from 1400 cortical grid cells. Based on experimental findings, we have assumed a linear interaction of the two pathways. The results show that simulated CA3 cells generally have a single place field, as observed experimentally. Thus, a two-step process based on simple rules (and that can occur without learning) is able to explain how grid cell inputs to the hippocampus give rise to cells having ultimate spatial selectivity. The CA3 processes that produce a single place depend critically on the competitive network processes and do not require the direct cortical inputs to CA3, which are therefore likely to perform some other unknown function.
Keywords: Hippocampus, Dentate Gyrus, Medial Entorhinal Cortex, Place Cells
Introduction
The input to the dentate gyrus (DG) of the hippocampus comes from layer 2 of the medial entorhinal cortex (MEC). These neurons are known as grid cells because they fire at evenly spaced positions over the entire environment (Hafting et al., 2005). In contrast to this relatively nonspecific spatial responsiveness, hippocampal neurons have tight spatial selectivity. Granule cells of the DG are the first-order cells in the hippocampus, and their firing occurs in restricted regions called place fields (O’Keefe, 1976). DG cells generally have multiple fields (average of 2.0) (Leutgeb et al., 2007) and thus do not specify a unique location. Information flows from these cells to CA3 cells, which also receive direct input from grid cells. The resulting computation generally produces a single place field in CA3 cells (Leutgeb et al., 2007). Thus, the overall process achieves ultimate spatial selectivity.
The achievement of selectivity is an important function of hierarchical networks, but the cellular and network mechanisms are not clear. The hippocampus is particularly favorable for understanding this process because so much is known about the anatomy and physiology of this system. Our work here builds on the recent demonstration that simple principles can account for the first stage of this process that produces the multiple place fields of DG cells (de Almeida et al., 2009b). It was shown that place field properties of DG cells could be quantitatively accounted for by utilizing three principles: 1) a realistic number of inputs from grid cells, randomly chosen, 2) the large variation in synaptic strength of these inputs, and 3) network interactions among DG cells based on a competitive process mediated by gamma frequency feedback inhibition. Our goal here is to understand the further computations that occur in CA3. Specifically, we have explored whether the same principles outlined above are sufficient to explain how CA3 cells achieve greater spatial selectivity than do DG cells (i.e., have a single place field rather than multiple fields).
Materials and Methods
The network that we simulated is shown in Figure 1A (for justification, see Results). CA3 pyramidal cells receive excitatory input from ~1400 cortical grid cells and ~50 DG granule cells. These inputs are summed linearly. CA3 cells excite an interneuron network that provides global feedback inhibition. This inhibition generates gamma frequency oscillations in the network and interacts with excitation to determine which CA3 cells fire (de Almeida et al., 2009a). The equations and parameters of the model are described in the next sections.
Figure 1.

Properties of the inputs to CA3. A) The network: CA3 pyramidal cells receive excitatory inputs from MEC grid cells and DG place cells. CA3 cells excite an inhibitory interneuron network (IN), which provides feedback inhibition to all CA3 neurons. The strength of the DG-CA3 and MEC-CA3 connections is proportional to the number of synapses (postsynaptic densities) per bouton (gray squares), which is 1 for MEC and an average of 24 for DG. B) Distribution of the number of active DG axonal inputs (out of 50), given a probability of a cell having any place field of 0.02. Active is defined as having a place field anywhere in the given environment. C) Distribution of the number of postsynaptic densities made by a DG axon onto a single CA3 spine.
Grid cells
The equations describing the activity of MEC grid cells are based on (Blair et al., 2007), according to which the rate at spatial location r =(x,y) is:
| (1) |
wherein u(θk)=(cos(θk),sin(θk)) is the unitary vector pointing to the direction “θk”. Each one of the three cosines in (1) establishes an oscillatory pattern of maxima and minima in a given direction “θk”. The sum of three patterns at angles θ1 = −30°, θ2 = +30°, and θ3 = +90° is a honeycomb grid with inter-vertex spacing equal to λ (in the simulations, λ varies between 30 cm and 1 m) (Hafting et al., 2005). For simplicity, we make use of only three different rotations for the grid cells, and this is represented by taking θ = 0°, 20°, or 40°. c=(x0, y0) is the spatial phase of the grid. The parameter g is an increasing gain function given by g(x) =exp[a(x −b)]−1, wherein a = 0.3 was set to produce the decay of the activity observed experimentally in (Leutgeb et al., 2007) and b was set to −3/2 so that the minimal firing rate is zero (since the summation of the three cosine functions has a minimum value of −3/2). Examples of computed grid cell activities are shown in Figure 2. For the simulations, we made a library of 10,000 grid cells, each with a different spatial frequency, phase, and orientation.
Figure 2.
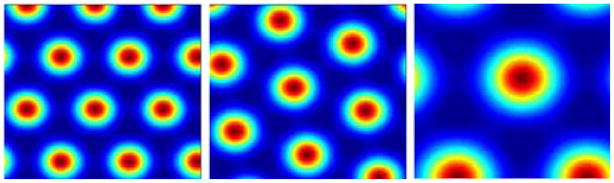
Examples of computed grid cell activity maps. Those grids have different spacing, orientation, and spatial phase. The figure above shows three random examples of grid cell activity and does not represent the full range of spacing.
Computation of DG place fields
DG place fields were computed as in (de Almeida et al., 2009b). In brief, DG place cells receive excitatory input from a large group (1200) of randomly chosen grid cells. The excitatory input received by the ith DG cell from the grid cells is given by equation 2.
| (2) |
Here, Wij is the synaptic weight of each input. Wij can be either 0 (no connection) or a positive random value distributed according to equation 4. According to this equation, which takes into consideration how synapse size is related to the probability of release and to quantal size (Raghavachari and Lisman, 2004) (Trommald and Hulleberg, 1997), synaptic weight (W(s)) is related to synapse size (s) through the relationship:
| (3) |
wherein s ranges from 0 (silent) to 0.2 μm2. The value 0.0314 μm2 is the area that produces a quantal current that is half that at the largest synapses (0.2 μm2). This value is calculated from the model of (Raghavachari and Lisman, 2004), which correctly predicts the rise time, amplitude, and variance of the quantal response. The size distribution of the excitatory synapses onto granules cells was based on the measurements of (Trommald and Hulleberg, 1997) and fit with the following distribution:
| (4) |
wherein A = 100.7, B = 0.02, σ1 = 0.022 μm2, σ2 = 0.018 μm2, and σ3 = 0.15 μm2. The DG cells that are active at a given position in the environment are selected using a rule based on E%-max winner-take-all (WTA) process (de Almeida et al., 2009a). This rule describes the competitive interactions mediated by gamma frequency feedback inhibition. The activity of the ith place cell is given by:
| (5) |
wherein k (referred to as E%-max) is 10% and was as estimated in (de Almeida et al., 2009a). Specifically, k determines which cells fire according to the rule that cells fire if their feedforward excitation is within E% of the DG cell receiving maximal excitation. is the maximum input received by a cell for the position r. H(x) is the Heaviside function, wherein H(x)=1 if x > 0 and is 0 otherwise. It is noteworthy that this computation does not depend on the exact value of the strength of inhibition and can thus be meaningfully applied when this strength has not been determined (de Almeida et al., 2009a).
Computation of CA3 place fields
DG inputs to CA3
The value of the DG inputs ( ) is determined by the sum of DG inputs with different weights similar to equation 2.
| (6) |
The synaptic weight (Ωij) distribution of DG inputs was estimated as follows. According to (Rollenhagen et al., 2007), single mossy fiber boutons can contain many postsynaptic densities (schematized in Figure 1A). We define the synaptic strength as proportional to the number of these densities. The weight distribution of the DG inputs was defined as a clipped (no negatives) Gaussian distribution (Figure 1C), with mean μ = 24 densities per bouton and standard deviation σ = 13. These parameters were obtained from experimental observations reported in (Johnston and Amaral, 1998; Rollenhagen et al., 2007).
| (7) |
Here, a normalization A = 1.033 is required because there are only zero or positive values for Ω. A CA3 neuron receives input from 50 different mossy fibers, but only an average of one of these is active anywhere in the environment (see Results). From this average, the number of active inputs to each CA3 cell is calculated according to the Poisson distribution presented in Figure 1B. The fraction of active CA3 will depend strongly on the fraction of active DG cells. Because the latter is not known with any accuracy, we have not attempted to account for the fraction of active CA3 cells.
MEC inputs to CA3
The grid cell input to CA3 adopted here is similar to that adopted for the grid cell inputs to DG (equation 2), except for a different number of grid cells converging onto one CA3 cell. According to (Johnston and Amaral, 1998), each CA3 pyramidal cell has ~3800 microns of dendritic trees located in stratum lacunosum-moleculare, the region receiving MEC inputs. The average spine density in this region is ~1 spine/micron (Megias et al., 2001), and about 50% of the synapses here come from MEC. There are thus about 1900 spines with MEC inputs, each of which contains one synaptic input. But not every cell in MEC is a grid cell; (Sargolini et al., 2006) indicate that only 72% of the cells in this area have well-defined grid fields. Taking all of this information into consideration yields a total of 1400 spines on the CA3 cell that have synaptic inputs from grid cells. The weight formula and synaptic size distribution are assumed to be the same as used for DG neurons in (de Almeida et al., 2009b). The variability on the synaptic weights plays an important role in the determination of activity maps, as demonstrated in Figure 5 of (de Almeida et al., 2009b).
Computation in CA3
Relative DG-to-MEC input (R) to CA3
The following calculation provides an estimate of the relative contribution of the DG and MEC to total excitatory input, which depends not only on the strength of synapses, but also on the activity of the presynaptic cells. The number of vesicles released in the two pathways within an integration period can be estimated as follows. For the grid cells, the area around the vertices of the grid fields is where the great majority of action potentials are concentrated. We calculate this area as about 38% of the total area (de Almeida et al., 2009b). Thus, at any given position of the environment, ~530 of the 1400 inputs to granule cells will potentially contribute. The average firing rate over the vertex of the grids of each of the 1400 MEC inputs is ~10 Hz (E. Moser, personal communication). At this frequency, the probability of a spike within the integration period (we take a CA3 membrane time constant of 30 ms (Turner and Schwartzkroin, 1983)) is ~0.4. It follows that about 210 input axons will be active during an integration period. However, the generation of a postsynaptic response at individual synapses is probabilistic, and not every action potential will result in a postsynaptic response. According to (Emptage et al., 2003), the average transmission probability of CA1 synapses is ~0.3. Assuming the same probability for CA3 cells gives an estimative of ~60 vesicles being released by MEC inputs within an integration period.
At the contact of a single DG axon onto a CA3 spine, there is an average of 24 synapses (postsynaptic densities); taking the release probability at each density as 0.3, an action potential will release ~7 vesicles. However, multi-spike bursts in DG cells fire CA3 cells (Henze et al., 2002), so, assuming a minimal burst of two spikes, the release is >14 vesicles. The following equation gives the relative strength of the DG-to-MEC input (R):
| (8) |
wherein NDG and NMEC are the number of vesicles released by one DG axon and the number of vesicles released by the MEC inputs, respectively, yielding R > 0.24. This number is a lower limit because two second-order effects that are not taken into consideration would increase R. First, facilitation, which is prominent at mossy fiber synapses, will enhance burst transmission (Salin et al., 1996) (Bischofberger et al., 2006). Second, the somatic charge created by distal MEC inputs is reduced by electronic spread, as compared to proximal DG inputs.
The inputs to CA3 are given by equation 9:
| (9) |
Here, is the input coming from cortical grid cells (equation 2), and represents the input from DG (equation 6). R is the relative DG-to-MEC input (equation 8), and is the average input coming from MEC, calculated by:
| (10) |
wherein nCA3 is the number of CA3 cells, and A is the environment area.
The CA3 output is defined by a function similar to equation 5:
| (11) |
Computation of place fields
The environment where activity maps of MEC and DG inputs and CA3 outputs were simulated is a square matrix of bins, each bin representing an area of 1 cm2 in a 1 m × 1 m square environment. A CA3 cell is considered active when it shows at least one place field anywhere in the environment. Following (Muller et al., 1987; Solstad et al., 2006), a place field is defined as a continuous region of at least 200 cm2 consisting of bins that exceed a firing rate of 20% of the cell’s peak firing rate.
All computations were performed using the Matlab programming language (MathWorks, Natick, MA).
Results
The synaptic pathways (Johnston and Amaral, 1998) that bring spatial information to CA3 pyramidal cells are schematized in Figure 1A–C. The distal dendritic region of CA3 pyramidal cells receives input from ~1400 cortical grid cells (see calculation in Methods) of varying spacing, orientation, and spatial periodicity (30 to 100 cm) (de Almeida et al., 2009b; Hafting et al., 2005) (Figure 2). Each MEC input makes a single synapse on a standard type of dendritic spine that contains a single synapse. The second type of input to CA3 cells is made by ~50 DG axons called mossy fibers. Each axon contacts an unusually large spine on the most proximal region of the dendritic tree. An average of 24 synapses are made onto each large spine by single axons (Rollenhagen et al., 2007). Each synapse is defined by a postsynaptic density. Recent work shows that only about 2% of DG cells have place fields (Figure 3, left column) anywhere in a given environment (Chawla et al., 2005). Thus, interestingly, only an average of one DG input per CA3 cell will be active in a given environment. Assuming that the number of active inputs is determined randomly, there will be a distribution of the number of active DG inputs, as shown in Figure 1B; 37% of CA3 cells have no active DG input, 37% have one, and 26% have more than one.
Figure 3.

Examples of the input-output transformation of CA3 place cells. From left to right: The excitation map of DG inputs (for the case in which input comes from 1 DG cell), the map of MEC excitation (from 1400 grid cells), the map of total excitation, and the computed place field(s) of CA3 cells, taking into consideration the interaction of excitation and inhibition. The examples in Cell 1 to Cell 5 show CA3 cells that have single place fields. The example in Cell 6 shows a very rare case in which the CA3 cell has multiple place fields.
MEC and DG interaction
We computed the excitation caused by the summation of all inputs. The particular input cells and their synaptic strength, which can vary over a large range, were selected randomly (see Methods). The first column in Figure 3 shows six examples of the excitation map produced by the input from single DG cells. In the top example, the DG cell that provides input has a single place field; the bottom five examples have multiple place fields. The second column shows examples of the excitation maps produced by 1400 grid cell inputs. Studies of the interaction of the cortical and DG input to CA3 show that, near threshold, this interaction is close to linear (Berzhanskaya et al., 1998) (Urban and Barrionuevo, 1998) (Urban et al., 2001). We therefore calculated the excitation map of the summed excitatory inputs from both pathways, and this is shown in the third column. To make these calculations, we used a scaling factor of R=0.24 that describes the relative strength of the DG-to-MEC total input.
We next considered how this total excitation interacts with inhibition to produce place fields in CA3 cells. A conclusion of (de Almeida et al., 2009a) is that the transformation of excitatory inputs into firing cannot be understood as a single cell process but instead must be analyzed in the context of a competitive network process governed by rapid gamma frequency feedback inhibition. This framework is appropriately applied to CA3 because of the occurrence of gamma oscillations in this region (Csicsvari et al., 2003; Montgomery and Buzsaki, 2007; Montgomery et al., 2008) and the synchronization of CA3 cell firing by these oscillations (Csicsvari et al., 2003). These oscillations implement an E%-max winner-take-all process (de Almeida et al., 2009a) in which cells fire if their excitation is within E% of the cell with maximal excitation. The value of E%-max can be estimated analytically (de Almeida et al., 2009a) and is the ratio of the delay of the feedback inhibition (d) and the membrane time constant (τ). Physiological studies estimate that d is 2–3 ms (Miles, 1990) and that τ is about 23 ms (Turner and Schwartzkroin, 1983). Thus, we take E%-max as 10%. An important property of the E%-max computation is that it does not depend on the exact value of inhibitory strength and so can be validly applied when this strength is not known (de Almeida et al., 2009a). Gamma oscillations are coherent over less than 1 mm along the longitudinal axis of the hippocampus (Sabolek et al., 2009), suggesting that the competitive process mediated by gamma occurs within a lamina of the hippocampus. We estimate that such a lamina contains about 2000 CA3 cells and thus utilized this number of CA3 cells in our simulations.
Using this procedure, CA3 place fields were computed (Figure 3, fourth column). Cells 1 to 5 in Figure 3 show typical results in which the CA3 cell has a single place field. Cell 6 in Figure 3 shows an unusual case (<20%) in which the CA3 cell has two place fields. The average number of place fields (for cells that had place fields) is 1.2 +/− 0.09 (s.d.), in good agreement with experiment (~1.1) (Leutgeb et al., 2007).
We next sought to determine whether the number of CA3 place fields in Figure 3 depends strongly on the choice of R, the relative DG-to-MEC input. If R is zero, the input derives solely from the MEC, and the average number of place fields in CA3 cells is 1.9 (Figure 4A). This is considerably higher than the 1.1 value observed experimentally. Thus, with only MEC input, the fact that CA3 cells usually have a single place field (Leutgeb et al., 2007) cannot be accounted for. On the other hand, these results show that place fields in CA3 can occur as a result of only MEC input. This is consistent with a study showing that place fields are observed in CA3 after ablation of DG (McNaughton et al., 1989). That study, however, did not give information about the number of place fields per cell. Figure 4A shows how the number of place fields is lowered as the dentate input becomes more significant (R becomes larger). For values of R > 0.2, the average number of place fields becomes fairly constant. For values of R higher than our lower limit (R > 0.24), the number of place fields is close to 1. Indeed, for R = ∞ (DG as the only input), the number of place fields is still close to 1. Thus, although the direct MEC input may, under normal circumstances, contribute to place field formation (see below), it is apparently not necessary to produce CA3 cells with single place fields. In summary, our model yields ~1 place field per CA3 cell. This conclusion is valid over a wide range of R and is therefore robust.
Figure 4.
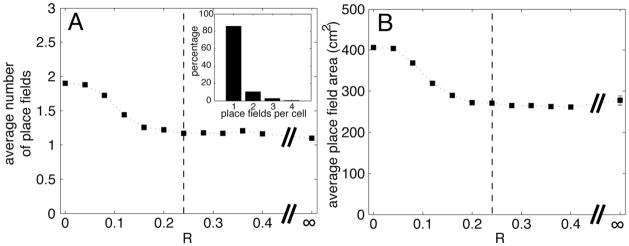
The influence of the ratio, R (DG input/MEC input), on the average number of CA3 place fields and the average place field area. A) Number of place fields falls as R increases but quickly stabilizes around ~1.1 fields per cell, even if we use only DG inputs (R = ∞). The gray dashed vertical line shows the estimated value of the ratio (R=0.24) adopted for the examples in Figure 3. The inset shows a histogram with the percentage of place fields/cell when R = 0.24; most cells have only one place field. B) Effect of R on place field area. In both A and B, the 20 independent simulations for each value of R were grouped together (resulting in a total of 40,000 CA3 cells) and conducted to determine the average; the resulting SEM was in the range of 0.01, too small to visualize in these graphs.
We next explored how different parameters affected the average number of place fields of CA3 cells (Figure 5). We first tested how the strength of competitive interactions affected the process. Figure 5A shows that the average number of place fields increases as the competition is weakened (increase in E%-max). Figure 5B shows that the variation of the number of CA3 cells has little impact on the number of fields. Finally, we tested the effect of the size of the environment. The standard environment in which there is ~1 place field per CA3 cells is about one square meter. Fig.5C shows that the number of place fields would be expected to become larger if the environment were enlarged (linearly with environment area). This is consistent with the results of (Fenton et al., 2008) (see Discussion). We find that place field size does not vary with environment area (average size ~360cm2 in an environment of xxx area as compared to xxx cm2 in an environment of xx). Finally, we considered whether variability in inputs (signaling noise) would strongly influence place fields. Because DG has only one kind of input (i.e., from the entorhinal cortex), it provides a simpler test than CA3. To each synaptic input at each position we added a noise value taken from a Gaussian distribution centered at zero and with S.D. equal to 15% of the instantaneous input. The results in Figure 5D show that such noise produces a barely noticeable change in place field properties.
Figure 5.

The influence of different parameters on the place fields. A) The average number of place fields gradually increases as competition is weakened by making E%-max larger. B) Changing the number of competing CA3 cells has little effect on the number of place fields. C) The average number of place fields increases with the area of the environment. The error bars (often too small to be seen) are the SEM. D) The influence of noise perturbation in DG cells. Six examples show that noisy inputs do not destroy the formation of DG place fields. For all of the simulations, R = 0.24.
Processes that give rise to CA3 place fields
Place field formation in CA3 might, under normal conditions, depend on the coincidence of peaks in the two inputs. We analyzed the CA3 place fields to measure the number of fields resulting from such coincidence (a field was attributed to coincidence if >50% of its total area had overlap with peaks in both inputs). As shown in Figure 6, when this was analyzed for R = 0.24 (black dotted line in Figure 6), ~30% of CA3 place fields arose from coincidence of peaks. In other cases, place fields arose because of a very large input from DG (60%) or MEC (10%). However, the low percentage of CA3 place fields coinciding with peaks of the MEC input does not imply that the MEC input is unimportant in place field formation. As can be seen in Figure 3, the map of MEC excitatory input is composed of peaks and valleys, but the modulation is not high. Thus, there will always be a substantial MEC input. In fact, an individual cell without any MEC input would have little chance of firing (being among the winners), as illustrated by the following calculation. Suppose that the average MEC input is 1 (arbitrary units); then, the average DG input will be ~0.24, and the sum of both inputs would be ~1.24. For a CA3 cell to be among the winners, it would need excitation close to 1.24; if all of this excitation came from DG, there would have to be about four active inputs that had overlapping place fields. The probability of four active inputs is very low (~0.1%; Figure 1B), and the chance that all four inputs would have overlapping place fields makes the overall probability of CA3 cells having an excitation near 1.24 vanishingly small. In conclusion, the formation of place fields in CA3 depends on a synergy between both inputs.
Figure 6.

The contribution of peaks in MEC and DG inputs to the place field(s) of CA3. CA3 fields are classified according to three categories: fields resulting from the coincidence of DG and MEC input peaks (black dotted line); fields resulting exclusively from a high MEC peak (black filled line); or high DG input (gray filled line). These three categories were measured using different values of R. The gray dashed horizontal line is the estimated actual value of R (0.24).
Discussion
Cells in the MEC fire in a grid-like fashion over the entire environment. Our results show how computations in the hippocampus result in CA3 cells that generally have a single place field in the standard recording environment of ~1m2. This is a dramatic example of a neuronal computation in which progressive hierarchical processing achieves greater representational specificity. Our main conclusion is that the formation of single place fields in the hippocampus can be achieved by a two-step process. In the initial step, grid cell inputs are converted to multiple place fields in granule cells. This process depends strongly on the fact that the randomness of connectivity and synaptic strength will lead, by chance, to DG cells with particularly strong excitatory input in a few places. A strong competitive WTA network process mediated by feedback inhibition allows a cell to fire only at places where its input is particularly strong (de Almeida et al., 2009b). This process yields DG cells that have an average of two place fields (Leutgeb et al., 2007). The next processing step occurs in CA3, where a refinement process produces cells having a single place field. We have found that this refinement can be simply accounted for in terms of the properties of its inputs and the same type of WTA process that operates in DG.
We have examined the factors that give rise to computations in CA3 that produce greater spatial selectivity than in DG (Figures 4 and 5) and found that the main factor involved is competitive WTA process operating on the DG inputs. This can be understood intuitively, as follows. CA3 cells generally receive input from one active DG cell that has multiple place fields; why is the CA3 cell active at one position but not the other? To see why this is the case, consider a given DG input with place fields at positions 1 and 2. The postsynaptic CA3 cell competes with other CA3 cells. Whereas the input at location 1 may make the cell among the winners, the same input at location 2 may be unsuccessful because other CA3 cells have much stronger inputs at that location. It is also possible that the MEC input at locations 1 and 2 may be so different that location 1 is a winner, whereas location 2 is not. Finally, it is possible that two active DG cells with overlapping place fields excite CA3 cells; these DG inputs may superpose at one location but not the other.
Although interactions between the DG and MEC inputs to CA3 normally occur (see below), our results show that if the MEC input is set to zero, CA3 cells still achieve enhanced spatial selectivity compared to DG cells (i.e., have ~1 place field). This constitutes an important prediction of our model and raises the question of what function the MEC inputs might have. One possibility is that its function would become apparent if we considered the nonspatial input from the LEC. The dual inputs to CA3 might aid in finding conjunctions of spatial information from the MEC and nonspatial information from the LEC (Fyhn et al., 2007). Another possibility is suggested by the finding that distal inputs to CA1 show slow NMDAR-mediated plateau potentials (Takahashi and Magee, 2009). Perhaps similar events occur in CA3 and therefore smear (superpose) information about different events encoded in the entorhinal cortex at different theta phase (Hafting et al., 2008). Such smearing might function to form a representation of temporal context, a representation that, according to several models, has an important role in hippocampal function (Howard and Kahana, 2002; Howard et al., 2006; Howard and Natu, 2005).
Our results provide perspective on a general property of pyramidal cell function: the interaction between inputs in different lamina. One simplifying concept is that fields require coincidence of peaks in the two inputs. We find, however, that CA3 cell firing occurs because there is a peak in both inputs in only 30% of cases. Thus, the concept of coincident peaks is only of limited utility and cannot be taken as a general rule. It should be stressed, however, that, although a peak in MEC input is only moderately predictive of a CA3 place field, the MEC input is still important; were a cell not to receive MEC input, the probability that it would be selected to fire by the WTA process is vanishingly small.
The fact that place fields survive in CA3 (McNaughton et al., 1989) after destruction of the dentate (and similarly in CA1 after destruction of CA3 (Brun et al., 2002)) has led to the idea that normal place fields are driven by the direct cortical inputs. The framework that we have developed for understanding place field formation suggests a more nuanced interpretation. Our results show that, indeed, a competitive mechanism that allows the most excited cells to fire will generate place fields in CA3 when there is only cortical input. However, under normal conditions, the DG input is an important determinant of which cells fire; without DG input, CA3 cells would have multiple place fields (like DG) rather than a single place field (Figure 4A).
Although we have emphasized how CA3 cells could come to have single place fields, it is also important to emphasize that such “ultimate” spatial selectivity breaks down if the environment is made much larger. As shown in Figure 5C, the average number of place fields per cell increases linearly with the area of the environment and becomes much larger than one for large areas. Consistent with this, when standard recording chambers on the order of 1 square meter are utilized, CA3 cells have ~1 place field (Leutgeb et al., 2007). However, when larger environments are tested, there is a nearly linear increase in the number of place fields per CA1 cell (Fenton et al., 2008). Similar experiments have not been reported for CA3.
Our results are relevant to several previous models of CA3. Because the large size of the synaptic contact of DG mossy fibers onto CA3 pyramidal cells, the mossy fiber has been suspected to be “detonator” of CA3 firing (McNaughton and Morris, 1987). While we agree that this can sometimes be the case, as seen in dual recordings of DG and CA3 cells (Montgomery et al., 2008), it cannot always be the case. This follows from the fact that DG cells fire in multiple places, but CA3 cells generally do not fire in all these places. An important model in the field (Treves and Rolls, 1992) has postulated that in a known environment, CA3 firing is driven directly by cortical inputs and that the role of DG inputs is restricted to learning. Our results are inconsistent with this view because we find that cortical inputs alone cannot give rise to CA3 cells with single place fields. Moreover, it is difficult to see why DG cells would have no impact on CA3 given their robust place cell activity. Finally, whereas the Treves-Rolls models postulates a recall function of CA3, consistent with its autoassociative function (Nakazawa et al., 2002), the data and our results point to an additional function of CA3: the formation of a more specific representation of space than seen in DG.
Our simulations show how single place fields in CA3 can arise through a two-stage process that does not require learning at either stage. The unimportance of learning is consistent with experimental work showing the presence of place fields as soon as a rat enters a new environment (Frank et al., 2004; Hill, 1978; Wilson and McNaughton, 1993). However, we emphasize that learning-dependent processes are likely to be important in the refinement and stabilization of place fields. Several lines of evidence point to the importance of NMDAR-mediated plasticity (Kentros et al., 1998) and dopamine function (which is required for late LTP) (Kentros et al., 2004) in stabilizing place fields (i.e., in having the same position on multiple days). Therefore, it is likely that stable place fields require dependence on two processes, the initial formation of place fields that can arise without learning and a learning-dependent process (Rolls et al., 2006; Savelli and Knierim, 2010; Si and Treves, 2009) that sharpens and stabilizes the fields. The strong role of learning-independent processes, first demonstrated by (de Almeida et al., 2009a), had not been previously suspected, and it will be of interest to determine whether learning-independent processes can contribute to other forms of representational specificity, such as cells in inferotemporal cortex that are specific to objects or faces (Quiroga et al., 2008).
Acknowledgments
Grant Sponsor: NIH/NIMH Grant P50 MH060450.
Grant Sponsor: NIH/NIDA CRCNS Grant R01DA027807.
Grant Sponsor: European Commission; Grant number: 217148.
We thank Jim Knierim for helpful comments on the manuscript. Marco Idiart and Licurgo de Almeida acknowledge partial financial support from Brazilian agencies CNPq and CAPES.
References
- Berzhanskaya J, Urban NN, Barrionuevo G. Electrophysiological and pharmacological characterization of the direct perforant path input to hippocampal area CA3. J Neurophysiol. 1998;79(4):2111–8. doi: 10.1152/jn.1998.79.4.2111. [DOI] [PubMed] [Google Scholar]
- Bischofberger J, Engel D, Frotscher M, Jonas P. Timing and efficacy of transmitter release at mossy fiber synapses in the hippocampal network. Pflugers Arch. 2006;453(3):361–72. doi: 10.1007/s00424-006-0093-2. [DOI] [PubMed] [Google Scholar]
- Blair HT, Welday AC, Zhang K. Scale-invariant memory representations emerge from moire interference between grid fields that produce theta oscillations: a computational model. J Neurosci. 2007;27(12):3211–29. doi: 10.1523/JNEUROSCI.4724-06.2007. [DOI] [PMC free article] [PubMed] [Google Scholar]
- Brun VH, Otnass MK, Molden S, Steffenach HA, Witter MP, Moser MB, Moser EI. Place cells and place recognition maintained by direct entorhinal-hippocampal circuitry. Science. 2002;296(5576):2243–6. doi: 10.1126/science.1071089. [DOI] [PubMed] [Google Scholar]
- Chawla MK, Guzowski JF, Ramirez-Amaya V, Lipa P, Hoffman KL, Marriott LK, Worley PF, McNaughton BL, Barnes CA. Sparse, environmentally selective expression of Arc RNA in the upper blade of the rodent fascia dentata by brief spatial experience. Hippocampus. 2005;15(5):579–86. doi: 10.1002/hipo.20091. [DOI] [PubMed] [Google Scholar]
- Csicsvari J, Jamieson B, Wise KD, Buzsaki G. Mechanisms of gamma oscillations in the hippocampus of the behaving rat. Neuron. 2003;37(2):311–22. doi: 10.1016/s0896-6273(02)01169-8. [DOI] [PubMed] [Google Scholar]
- de Almeida L, Idiart M, Lisman JE. A second function of gamma frequency oscillations: an E%-max winner-take-all mechanism selects which cells fire. J Neurosci. 2009a;29(23):7497–503. doi: 10.1523/JNEUROSCI.6044-08.2009. [DOI] [PMC free article] [PubMed] [Google Scholar]
- de Almeida L, Idiart M, Lisman JE. The input-output transformation of the hippocampal granule cells: from grid cells to place fields. J Neurosci. 2009b;29(23):7504–12. doi: 10.1523/JNEUROSCI.6048-08.2009. [DOI] [PMC free article] [PubMed] [Google Scholar]
- Emptage NJ, Reid CA, Fine A, Bliss TV. Optical quantal analysis reveals a presynaptic component of LTP at hippocampal Schaffer-associational synapses. Neuron. 2003;38(5):797–804. doi: 10.1016/s0896-6273(03)00325-8. [DOI] [PubMed] [Google Scholar]
- Fenton AA, Kao HY, Neymotin SA, Olypher A, Vayntrub Y, Lytton WW, Ludvig N. Unmasking the CA1 ensemble place code by exposures to small and large environments: more place cells and multiple, irregularly arranged, and expanded place fields in the larger space. J Neurosci. 2008;28(44):11250–62. doi: 10.1523/JNEUROSCI.2862-08.2008. [DOI] [PMC free article] [PubMed] [Google Scholar]
- Frank LM, Stanley GB, Brown EN. Hippocampal plasticity across multiple days of exposure to novel environments. J Neurosci. 2004;24(35):7681–9. doi: 10.1523/JNEUROSCI.1958-04.2004. [DOI] [PMC free article] [PubMed] [Google Scholar]
- Fyhn M, Hafting T, Treves A, Moser MB, Moser EI. Hippocampal remapping and grid realignment in entorhinal cortex. Nature. 2007;446(7132):190–4. doi: 10.1038/nature05601. [DOI] [PubMed] [Google Scholar]
- Hafting T, Fyhn M, Bonnevie T, Moser MB, Moser EI. Hippocampus-independent phase precession in entorhinal grid cells. Nature. 2008;453(7199):1248–52. doi: 10.1038/nature06957. [DOI] [PubMed] [Google Scholar]
- Hafting T, Fyhn M, Molden S, Moser MB, Moser EI. Microstructure of a spatial map in the entorhinal cortex. Nature. 2005;436(7052):801–806. doi: 10.1038/nature03721. [DOI] [PubMed] [Google Scholar]
- Henze DA, Wittner L, Buzsaki G. Single granule cells reliably discharge targets in the hippocampal CA3 network in vivo. Nat Neurosci. 2002;5(8):790–5. doi: 10.1038/nn887. [DOI] [PubMed] [Google Scholar]
- Hill AJ. First occurrence of hippocampal spatial firing in a new environment. Exp Neurol. 1978;62(2):282–97. doi: 10.1016/0014-4886(78)90058-4. [DOI] [PubMed] [Google Scholar]
- Howard MW, Kahana MJ. A Distributed Representation of Temporal Context. Journal of Mathematical Psychology. 2002;46(3):31. [Google Scholar]
- Howard MW, Kahana MJ, Wingfield A. Aging and contextual binding: modeling recency and lag recency effects with the temporal context model. Psychon Bull Rev. 2006;13(3):439–45. doi: 10.3758/bf03193867. [DOI] [PMC free article] [PubMed] [Google Scholar]
- Howard MW, Natu VS. Place from time: Reconstructing position from a distributed representation of temporal context. Neural networks: the official journal of the International Neural Network Society. 2005;18(9):1150–62. doi: 10.1016/j.neunet.2005.08.002. [DOI] [PMC free article] [PubMed] [Google Scholar]
- Johnston D, Amaral DG. Hippocampus. In: Shepherd GM, editor. The synaptic organization of the brain. 4. New York: Oxford University Press; 1998. pp. 417–458. [Google Scholar]
- Kentros C, Hargreaves E, Hawkins RD, Kandel ER, Shapiro M, Muller RV. Abolition of long-term stability of new hippocampal place cell maps by NMDA receptor blockade. Science. 1998;280(5372):2121–6. doi: 10.1126/science.280.5372.2121. [DOI] [PubMed] [Google Scholar]
- Kentros CG, Agnihotri NT, Streater S, Hawkins RD, Kandel ER. Increased attention to spatial context increases both place field stability and spatial memory. Neuron. 2004;42(2):283–95. doi: 10.1016/s0896-6273(04)00192-8. [DOI] [PubMed] [Google Scholar]
- Leutgeb JK, Leutgeb S, Moser MB, Moser EI. Pattern separation in the dentate gyrus and CA3 of the hippocampus. Science. 2007;315(5814):961–6. doi: 10.1126/science.1135801. [DOI] [PubMed] [Google Scholar]
- McNaughton BL, Barnes CA, Meltzer J, Sutherland RJ. Hippocampal granule cells are necessary for normal spatial learning but not for spatially-selective pyramidal cell discharge. Exp Brain Res. 1989;76(3):485–96. doi: 10.1007/BF00248904. [DOI] [PubMed] [Google Scholar]
- McNaughton BL, Morris RG. Hippocampal synaptic enhancement and information. Trends Neurosci. 1987;(10):408–415. [Google Scholar]
- Megias M, Emri Z, Freund TF, Gulyas AI. Total number and distribution of inhibitory and excitatory synapses on hippocampal CA1 pyramidal cells. Neuroscience. 2001;102(3):527–40. doi: 10.1016/s0306-4522(00)00496-6. [DOI] [PubMed] [Google Scholar]
- Miles R. Synaptic excitation of inhibitory cells by single CA3 hippocampal pyramidal cells of the guinea-pig in vitro. J Physiol. 1990;428:61–77. doi: 10.1113/jphysiol.1990.sp018200. [DOI] [PMC free article] [PubMed] [Google Scholar]
- Montgomery SM, Buzsaki G. Gamma oscillations dynamically couple hippocampal CA3 and CA1 regions during memory task performance. Proc Natl Acad Sci U S A. 2007;104(36):14495–500. doi: 10.1073/pnas.0701826104. [DOI] [PMC free article] [PubMed] [Google Scholar]
- Montgomery SM, Sirota A, Buzsaki G. Theta and gamma coordination of hippocampal networks during waking and rapid eye movement sleep. J Neurosci. 2008;28(26):6731–41. doi: 10.1523/JNEUROSCI.1227-08.2008. [DOI] [PMC free article] [PubMed] [Google Scholar]
- Muller RU, Kubie JL, Ranck JB., Jr Spatial firing patterns of hippocampal complex-spike cells in a fixed environment. J Neurosci. 1987;7(7):1935–50. doi: 10.1523/JNEUROSCI.07-07-01935.1987. [DOI] [PMC free article] [PubMed] [Google Scholar]
- Nakazawa K, Quirk MC, Chitwood RA, Watanabe M, Yeckel MF, Sun LD, Kato A, Carr CA, Johnston D, Wilson MA, et al. Requirement for hippocampal CA3 NMDA receptors in associative memory recall. Science. 2002;297(5579):211–8. doi: 10.1126/science.1071795. [DOI] [PMC free article] [PubMed] [Google Scholar]
- O’Keefe J. Place units in the hippocampus of the freely moving rat. Exp Neurol. 1976;51(1):78–109. doi: 10.1016/0014-4886(76)90055-8. [DOI] [PubMed] [Google Scholar]
- Quiroga RQ, Kreiman G, Koch C, Fried I. Sparse but not ‘grandmother-cell’ coding in the medial temporal lobe. Trends Cogn Sci. 2008;12(3):87–91. doi: 10.1016/j.tics.2007.12.003. [DOI] [PubMed] [Google Scholar]
- Raghavachari S, Lisman JE. Properties of quantal transmission at CA1 synapses. J Neurophysiol. 2004;92(4):2456–67. doi: 10.1152/jn.00258.2004. [DOI] [PubMed] [Google Scholar]
- Rollenhagen A, Satzler K, Rodriguez EP, Jonas P, Frotscher M, Lubke JH. Structural determinants of transmission at large hippocampal mossy fiber synapses. J Neurosci. 2007;27(39):10434–44. doi: 10.1523/JNEUROSCI.1946-07.2007. [DOI] [PMC free article] [PubMed] [Google Scholar]
- Rolls ET, Stringer SM, Elliot T. Entorhinal cortex grid cells can map to hippocampal place cells by competitive learning. Network. 2006;17(4):447–65. doi: 10.1080/09548980601064846. [DOI] [PubMed] [Google Scholar]
- Sabolek HR, Penley SC, Hinman JR, Bunce JG, Markus EJ, Escabi M, Chrobak JJ. Theta and gamma coherence along the septotemporal axis of the hippocampus. J Neurophysiol. 2009;101(3):1192–200. doi: 10.1152/jn.90846.2008. [DOI] [PubMed] [Google Scholar]
- Salin PA, Scanziani M, Malenka RC, Nicoll RA. Distinct short-term plasticity at two excitatory synapses in the hippocampus. Proc Natl Acad Sci U S A. 1996;93(23):13304–9. doi: 10.1073/pnas.93.23.13304. [DOI] [PMC free article] [PubMed] [Google Scholar]
- Sargolini F, Fyhn M, Hafting T, McNaughton BL, Witter MP, Moser MB, Moser EI. Conjunctive representation of position, direction, and velocity in entorhinal cortex. Science. 2006;312(5774):758–62. doi: 10.1126/science.1125572. [DOI] [PubMed] [Google Scholar]
- Savelli F, Knierim JJ. Hebbian analysis of the transformation of medial entorhinal grid-cell inputs to hippocampal place fields. J Neurophysiol. 2010;103(6):3167–83. doi: 10.1152/jn.00932.2009. [DOI] [PMC free article] [PubMed] [Google Scholar]
- Si B, Treves A. The role of competitive learning in the generation of DG fields from EC inputs. Cogn Neurodyn. 2009;3(2):177–87. doi: 10.1007/s11571-009-9079-z. [DOI] [PMC free article] [PubMed] [Google Scholar]
- Solstad T, Moser EI, Einevoll GT. From grid cells to place cells: a mathematical model. Hippocampus. 2006;16(12):1026–31. doi: 10.1002/hipo.20244. [DOI] [PubMed] [Google Scholar]
- Takahashi H, Magee JC. Pathway interactions and synaptic plasticity in the dendritic tuft regions of CA1 pyramidal neurons. Neuron. 2009;62(1):102–11. doi: 10.1016/j.neuron.2009.03.007. [DOI] [PubMed] [Google Scholar]
- Treves A, Rolls ET. Computational constraints suggest the need for two distinct input systems to the hippocampal CA3 network. Hippocampus. 1992;2(2):189–99. doi: 10.1002/hipo.450020209. [DOI] [PubMed] [Google Scholar]
- Trommald M, Hulleberg G. Dimensions and density of dendritic spines from rat dentate granule cells based on reconstructions from serial electron micrographs. J Comp Neurol. 1997;377(1):15–28. doi: 10.1002/(sici)1096-9861(19970106)377:1<15::aid-cne3>3.0.co;2-m. [DOI] [PubMed] [Google Scholar]
- Turner DA, Schwartzkroin PA. Electrical characteristics of dendrites and dendritic spines in intracellularly stained CA3 and dentate hippocampal neurons. J Neurosci. 1983;3(11):2381–94. doi: 10.1523/JNEUROSCI.03-11-02381.1983. [DOI] [PMC free article] [PubMed] [Google Scholar]
- Urban NN, Barrionuevo G. Active summation of excitatory postsynaptic potentials in hippocampal CA3 pyramidal neurons. Proc Natl Acad Sci U S A. 1998;95(19):11450–5. doi: 10.1073/pnas.95.19.11450. [DOI] [PMC free article] [PubMed] [Google Scholar]
- Urban NN, Henze DA, Barrionuevo G. Revisiting the role of the hippocampal mossy fiber synapse. Hippocampus. 2001;11(4):408–17. doi: 10.1002/hipo.1055. [DOI] [PubMed] [Google Scholar]
- Wilson MA, McNaughton BL. Dynamics of the hippocampal ensemble code for space. Science. 1993;261(5124):1055–8. doi: 10.1126/science.8351520. [DOI] [PubMed] [Google Scholar]