

Abstract
Timing and pattern of mitochondrial potential (ΔΨm) depolarization during no-flow ischaemia–reperfusion (I–R) remain controversial, at least in part due to difficulties in interpreting the changes in the fluorescence of ΔΨm-sensitive dyes such as TMRM. The objective of this study was to develop a new approach for interpreting confocal TMRM signals during I–R based on spatial periodicity of mitochondrial packaging in ventricular cardiomyocytes. TMRM fluorescence (FTMRM) was recorded from Langendorff-perfused rabbit hearts immobilized with blebbistatin using either a confocal microscope or an optical mapping system. The hearts were studied under normal conditions, during mitochondrial uncoupling using the protonophore FCCP, and during I–R. Confocal images of FTMRM were subjected to spatial Fourier transform which revealed distinct peaks at a spatial frequency of ∼2 μm−1. The area under the peak (MPA) progressively decreased upon application of increasing concentrations of FCCP (0.3–20 μm), becoming undetectable at 5–20 μm FCCP. During ischaemia, a dramatic decrease in MPA, reaching the low/undetectable level comparable to that induced by 5–20 μm FCCP, was observed between 27 and 69 min of ischaemia. Upon reperfusion, a heterogeneous MPA recovery was observed, but not a de novo MPA decrease. Both confocal and wide-field imaging registered a consistent decrease in spatially averaged FTMRM in the presence of 5 μm FCCP, but no consistent change in this parameter during I–R. We conclude that MPA derived from confocal images provides a sensitive and specific indicator of significant mitochondrial depolarization or recovery during I–R. In contrast, spatially averaged FTMRM is not a reliable indicator of ΔΨm changes during I–R.
Key points
Mitochondrial inner membrane potential (ΔΨm) collapse during myocardial ischaemia is one of the key events determining the physiological consequences of ischaemic attack in terms of post-ischaemic arrhythmias and cell survival.
Timing and pattern of ΔΨm collapse during ischaemia remain controversial, in part due to difficulties in interpreting the fluorescence of potentiometric cationic probes commonly used for assessment of ΔΨm in cellular and multicellular experimental models.
This manuscript presents a new method for monitoring ΔΨm in whole hearts based on the regular arrangement of mitochondria in cardiac myocytes, thus permitting detection of ΔΨm collapse using spectral analysis of fluorescence.
The proposed method will help to ascertain the role of mitochondrial function in acute cardiovascular conditions, such as acute myocardial infarction or sudden cardiac arrest.
Introduction
The dynamics of ΔΨm loss and recovery during I–R have been implicated in the immediate (loss of excitability, post-ischaemic arrhythmias; Akar et al. 2005) and long-term (cell survival or death; Petronilli et al. 2001) outcomes of a regional ischaemic event due to coronary occlusion, or global ischaemia due to cardiac arrest or trauma. To date, however, most of these concepts are based on knowledge obtained in isolated mitochondria or isolated cardiomyocytes, model systems which cannot fully recapitulate all the essential features of I–R in whole hearts. In recent years, several groups started studying the dynamics of ΔΨm during I–R or its surrogates in whole hearts by monitoring fluorescence emitted by the rhodamine-based cationic dyes TMRM and TMRE using either confocal microcopy (Matsumoto-Ida et al. 2006; Slodzinski et al. 2008; Kato et al. 2009; Davidson et al. 2012) or wide-field optical mapping (Jin et al. 2010; Lyon et al. 2010). Reviewing these studies, one cannot fail to notice a diversity of outcomes with regard to the timing (early (Lyon et al. 2010) or late: (Matsumoto-Ida et al. 2006; Slodzinski et al. 2008; Kato et al. 2009) in ischaemia, or upon reperfusion (Matsumoto-Ida et al. 2006; Slodzinski et al. 2008; Davidson et al. 2012)) and spatial pattern (mosaic (Matsumoto-Ida et al. 2006; Slodzinski et al. 2008; Davidson et al. 2012), diffuse (Kato et al. 2009), or propagating as a wave (Lyon et al. 2010)) of delta ΔΨm depolarization during I–R. Without better understanding of the actual dynamics of ΔΨm during realistic I–R, it will be impossible to translate the vast amount of prior knowledge obtained in reductionist approaches to the level of integrative physiology and eventually to the level of human cardiac disease.
At least in part, the variability in results may be due to the difficulty of interpreting changes in fluorescence emitted by the dyes used to monitor ΔΨm (superbly reviewed by Duchen et al. (2003)). In the first approximation, the cationic dyes TMRM and TMRE distribute across the extracellular space, cytosol and mitochondrial matrix based on a 3-chamber Nernstian system which is governed by both ΔΨm and the sarcolemmal transmembrane potential (ΔΨs). This leads to the highest concentration of the dye in the most negatively charged compartment, the mitochondrial matrix. Mitochondrial depolarization causes a redistribution of the dye between the mitochondrial matrix and the cytosol, with subsequent redistribution to extracellular space. The difficulty stems from the fact that individual mitochondria in cardiac myocytes cannot be reliably resolved as separate objects, even using confocal microscopy, and therefore the event and the degree of the dye redistribution has to be assessed from spatially averaged measurements that unavoidably include contributions from compartments other than the mitochondrial matrix. In the worst-case scenario, if the total pool of dye molecules in the compartments contributing to the recorded fluorescence does not change, then ΔΨm loss may not be detectable at all. Notably, during no-flow ischaemia the total pool of the fluorophores in all myocardial compartments does remain the same, thus the ability to detect ΔΨm depolarization is critically dependent on separating the movement of the dye between mitochondria and cytosol from other redistributions, including those which might be unrelated to ΔΨm dissipation.
Amid these inherent difficulties and the diversity of previous observations, we sought to develop a new approach, which would be a more reliable and sensitive index of ΔΨm loss in intact ventricular myocardium during no-flow ischaemia. Here we present a method taking advantage of spectral properties of confocally recorded TMRM fluorescence (FTMRM), resulting from the spatially periodic arrangement of mitochondria within ventricular myocytes. This method permits detection of redistribution of a cationic fluorophore which is highly specific to mitochondrial depolarization. We provide evidence that, in confocal imaging, the spectral method is superior to tracking the mean FTMRM level or its spatial dispersion (Brennan et al. 2006) and, unlike the other two measures, allows detection of the complete ΔΨm loss event with a high degree of certainty.
Methods
Ethical approval
All procedures involving animals were approved by the Animal Care and Use Committee of the University of Utah and complied with the National Institutes of Health Guide for the Care and Use of Laboratory Animals 1996.
Isolated adult rabbit ventricular myocytes
Adult ventricular myocytes were isolated from rabbit hearts (n= 3) by enzymatic digestion as previously described (Skolnick et al. 1998; Ajiro et al. 2011). Animals were killed by i.v. injection of 130 mg kg−1 sodium pentobarbital, then the excised heart was attached to an aortic cannula and perfused with solutions gassed with 100% O2 and held at 37°C, pH 7.3. The heart was first perfused for 5 min with a 0 mm Ca2+ solution containing (in mm): 92.0 NaCl, 4.4 KCl, 11.0 dextrose, 5.0 MgCl2, 20.0 taurine, 5.0 creatine, 5.0 sodium pyruvate, 1.0 NaH2PO4, 24.0 Hepes, and 12.5 NaOH. This was followed by 13–15 min of perfusion with the same solution containing 0.075 mg ml−1 collagenase P (Roche Diagnostic, Manheim, Germany), 0.05 mg ml−1 protease (type XIV, Sigma Chemical, St Louis, MO, USA), and 0.05 mm CaCl2. The heart was then perfused for 5 min with the same solution containing no enzymes. The left ventricle was minced and shaken for 10 min, and then filtered through a nylon mesh. Cells were stored at room temperature in normal Hepes-buffered solution containing 1.1 mm CaCl2. All myocytes used in this study were rod shaped, had well-defined striations, and did not spontaneously contract. Experiments were performed within 10 h of isolation.
Cells were incubated in 400 nm tetramethyl rhodamine perchlorate methyl ester (TMRM) for 3–10 min at ambient temperature, placed in a perfusion chamber mounted on the stage of an inverted confocal microscope (Zeiss LSM 510, Carl Zeiss, Germany) and perfused with normal Hepes solution (126 mm NaCl, 1.0 mm MgCl2, 4.4 mm KCl, 1.1 mm CaCl2, 11 mm dextrose, 24 mm Hepes) at 37°C. Cells were confocally imaged using an oil-immersion 40× objective lens. FTMRM was excited using a 543 nm laser and collected using a 560 long pass filter. To uncouple mitochondria and induce ΔΨm depolarization, perfusion was rapidly switched to Hepes solution containing various concentrations of protonophore carbonylcyanide-p-trifluoromethoxyphenylhydrazone (FCCP).
Langendorff-perfused rabbit heart
Adult rabbits of either sex were killed by i.v. injection of 130 mg kg−1 sodium pentobarbital. Hearts were removed and attached to the Langendorff apparatus in less than 3 min. Hearts were perfused with Tyrode's solution (130 mm NaCl, 24 mm NaHCO3, 1.2 mm NaH2PO4, 1.0 mm MgCl2, 5.6 mm glucose, 4.0 mm KCl, 1.8 mm CaCl2 and 0.1 g l−1 albumin) at a fixed rate of 30 ml min−1. After an equilibration period of 35 min the heart was perfused with Tyrode's solution containing TMRM (450 nm) and the electromechanical uncoupler blebbistatin (5.7 μm, Sigma-Aldrich, St Louis, USA; Fedorov et al. 2007) for 30 min, unless stated otherwise. For the remainder of the experiment, hearts were perfused with Tyrode's solution containing blebbistatin. In some experiments the mitochondrial uncoupler FCCP (5 μm) and an inhibitor of glycolysis, sodium iodoacetate (15 mm), were added to the perfusate. Global ischaemia was initiated by cessation of aortic perfusion and maintained for at least 60 min, followed by reperfusion. Volume-conducted ECG was monitored continuously throughout the protocol. A bipolar pacing electrode was inserted into the depth of the left ventricular (LV) anterio-basal free wall and the pacing threshold was periodically measured throughout the experiment.
Confocal imaging in the whole heart
Langendorff-perfused hearts (n= 12) were placed in a custom confocal imaging chamber (Supplemental Fig. 1). Temperature was monitored in the right ventricular (RV) chamber and near the imaged epicardial area and was maintained in both sites at 37.7 ± 0.5°C throughout the experimental protocol. During ischaemia the temperature was maintained by the combined action of superfusion with Tyrode's solution bypassed from the aortic cannula and inflow of warm moisturized air into the imaging chamber (see Supplemental Fig. 1). The posterior LV epicardial surface was imaged in a line scan mode using a Zeiss LSM 510 confocal microscope with a 20× objective lens, giving a field of view of 450 μm × 450 μm, with resolution of 0.439 μm per pixel. The slice thickness was 2.7 μm. When z-stacks were obtained, 9 to 14 slices were taken at the distance of 2.7 μm between the centres of each slice. TMRM was excited using a 543 nm laser; emission was collected using a 560 nm long pass filter. The laser power and detector gain was adjusted to ensure the TMRM signal was not saturated. The mean TMRM fluorescence (FTMRM) was calculated after applying manual masking to exclude grossly areas not containing solid sheets of myocardial cells. The identification and quantification of mitochondrial spectral peaks was performed using the Fourier transform function available in ImageJ and custom software routines as described in the Results.
Wide-field optical mapping in the whole heart
Hearts (n= 11) were fully immersed in a superfusion solution inside the imaging chamber to maintain the temperature at 37°C both during normoxic perfusion and no-flow ischaemia. During no-flow ischaemia the superfusion was switched to a hypoxic solution gassed with 95% N2–5% CO2. TMRM was excited by a 532 nm solid-state laser (Coherent, Santa Clara, CA, USA). Emitted fluorescence was collected by an EMCCD camera (iXon DU-860D, Andor Technology, Belfast, UK) using a 600 ± 40 nm bandpass filter. The imaging area was 3 cm × 3 cm encompassing the entire posterior view of the right and left ventricles (see Supplemental Fig. 8). Wide-field images were analysed using Scroll (Sergey Mironov, Center for Arrhythmia Research, University of Michigan, USA) after a careful manual selection of the area exclusive to RV and LV in each heart. The details of different measurements applied to the wide-field TMRM images are described in Results.
Results
Spectral analysis and MPA computation
The idea of using spectral analysis to track mitochondrial polarization was suggested by a highly regular, ‘crystal-like’ pattern of mitochondrial arrangement in ventricular myocytes, such that individual mitochondria usually span a sarcomere (Vendelin et al. 2005). Thus, fluorescence emitted by dyes preferentially accumulating in mitochondria might reflect the highly periodic spacing of the z-disks. We first validated this idea in isolated cells. Figure 1 shows TMRM fluorescence and transmitted light images of an isolated ventricular cardiomyocyte taken in the absence (panels Aa and Ac) and in the presence (panels Ab and Ad) of the mitochondrial uncoupler FCCP (20 μm). The high concentration of the uncoupler was chosen to ensure complete dissipation of ΔΨm. Indeed, one can see that the brightness of FTMRM is greatly reduced in the presence of FCCP (Fig. 1Ab), as is expected due to redistribution between mitochondrial matrix, cytosol and the (virtually infinite) perfusion bath. In addition, the spatial pattern of FTMRM image is dramatically altered. Specifically, the ‘granularity’ apparent in the control image (Fig. 1Aa) is completely lost in the presence of FCCP (Fig. 1Ab). A zoomed-in fluorescent image of the cardiomyocyte (Fig. 1B) shows an example of regular mitochondrial arrangement (with a period of ∼2 μm, see red arrows in Fig. 1Ba) along the longitudinal axis of the cell, which is abolished by application of FCCP (Fig. 1Bb). Such periodic features, even those not obvious by eye, can be revealed by spectral analysis.
Figure 1. Spatial Fourier transform (SFT) reveals ΔΨm-dependent spatial periodicity in confocal images of FTMRM.
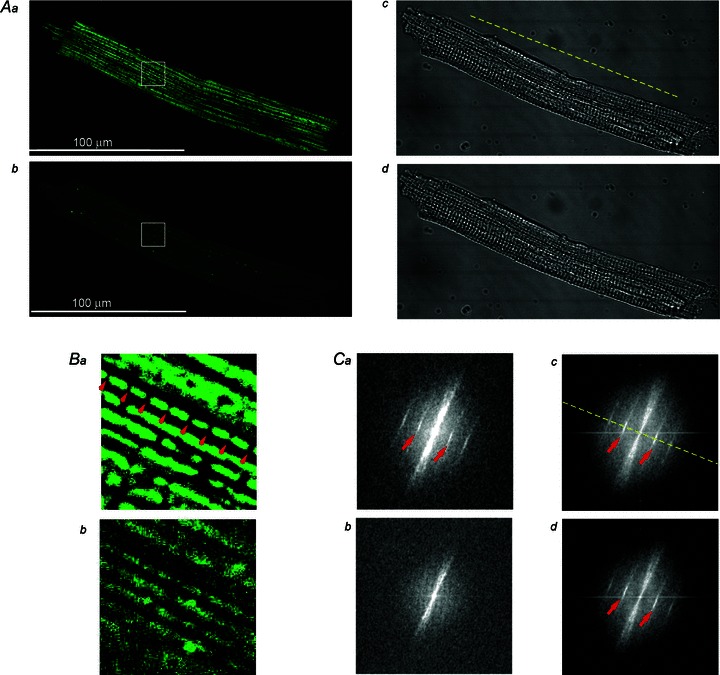
Aa and b, FTMRM image of a single ventricular cardiomyocyte before and after, respectively, administration of 20 μm FCCP. Ac and d, transmitted light images corresponding to those shown in Aa and b, respectively. Ba and b, zoomed-in region of interests indicated by the white square in Aa and b, respectively. Note the presence of a highly periodic array of mitochondria at baseline spaced at ∼2 μm (red arrows in Ba) and lack thereof after application of FCCP (Bb). Ca–d, SFT spectra of images shown in Aa–d, respectively. The spectral peaks (red arrows) in Ca, Cc, and Cd correspond to the spatial period of ∼2 μm. The fact that after mitochondrial uncoupling by FCCP these peaks are absent in the SFT of the FTMRM image (Cb), but are preserved in the SFT of the transmitted light image (Cd) suggests that these peaks are specific to TMRM accumulation in charged mitochondria. Yellow dashed line, the longitudinal axis of the myocyte.
Figure 1Ca–d shows spatial Fourier transformations (SFTs) of the images shown in Fig. 1Aa–d, respectively. By convention, the SFT spectra are displayed in polar coordinates, where the distance from the centre (radius) represents the size of periodic features and the angle represents the orientation of the features (see Supplemental Fig. 2). Note that in the absence of FCCP the SFT spectra of both the FTMRM and transmitted light images (Fig. 1Ca and c) show distinct bands (see red arrows) at the radius corresponding to a spacing interval of ∼2 μm and at the angle corresponding to the longitudinal axis of the cell (see yellow dashed line). In the presence of FCCP, however, the bands corresponding to spacing interval of ∼2 μm are visible only in the SFT spectrum of the transmitted light image (Fig. 1Cd), but are absent in the SFT spectrum of FTMRM image (Fig. 1Cb). These observations suggest that the periodic features imposed by structure (presumably z-disks) are not affected by FCCP, whereas the periodic fluctuations of TMRM concentration along the longitudinal axis of the cell have dissipated.
Figure 2 shows that the essential spectral features observed in single myocytes are fully present in the spectrum of a FTMRM image obtained from a whole heart (Fig. 2A). In particular, the bands corresponding to spatial intervals of ∼2 μm and aligned with the longitudinal axis of the myocytes are readily recognizable (Fig. 2B). We will refer to these bands/peaks as ‘mitochondrial peaks’. In order to quantify the magnitude of these peaks we developed an algorithm illustrated in Fig. 2. Angles from 0 to π rad were scanned at small angular increments. At each angle Θ, the spectral power within the sector centred at Θ and having a user-defined angular half-width (ΔΘ) was computed as the function of radius (r) and normalized to the arc length. Due to two-fold rotational symmetry of the SFT spectrum, the same calculation was performed for the sector centred at the angle of Θ+π rad (see the two red lines in Fig. 2B) and the results were added at each value of r. At the angle Θ approximately corresponding to the longitudinal axis of the myocytes (Θaxis), the resulting one-dimensional spectral profile showed a well-defined mitochondrial peak and sometimes its first harmonic (see Fig. 2C). In order to assess, at least semi-quantitatively, the degree of mitochondrial polarization, we estimated the area under the peak. The algorithm first searched for the absolute maximum in the user-defined search range. This range should be based on the expected range of variation of the sarcomere length, which should be quite narrow for any particular species and experimental model. We found, however, that the position of the mitochondrial peak is different between isolated cardiomyocytes (∼1.95 μm cycle−1), normoxemic ventricular tissue (∼2.4 μm cycle−1) and ischaemic ventricular tissue (∼2.0 μm cycle−1) (see Supplemental Figs 3 and 5). When the maximum was found, the background-subtracted area within the user-defined half-width on each side of the peak (red arrowheads in Fig. 2C) was computed yielding MPA (green area in Fig. 2C). The algorithm selected the highest MPA values among all scanned angles Θ. Whenever mitochondrial peaks were detectable, the highest MPA value was always found at the angle approximately corresponding to Θaxis. However, when mitochondrial peaks were not present (due to ΔΨm dissipation), the algorithm could yield a low MPA value picked at a random angle and a random spatial frequency. Such cases are easily identifiable upon close inspection and can be classified as ‘non-detectable’. Alternatively, the false-detected peaks can be tolerated, or MPA can be re-measured at a fixed, user-defined Θ and spatial frequency. In our experience, the choice among these options did not affect the principal conclusion of a significant ΔΨm loss. The values of input parameters used in this study are shown in Supplemental Table 1.
Figure 2. Spectral analysis of FTMRM in confocal images obtained from subepicardial ventricular myocytes in intact heart.
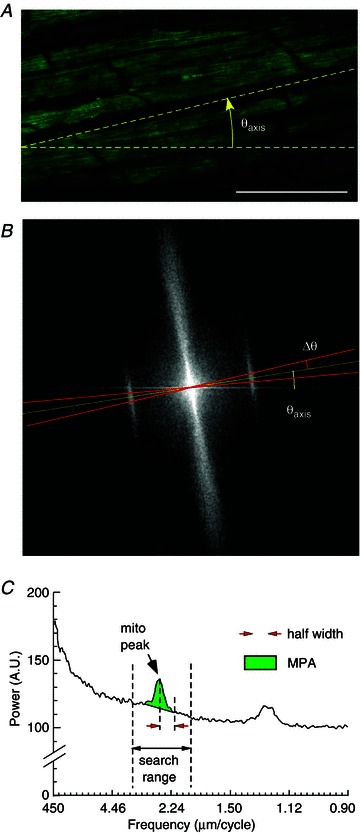
A, FTMRM image. Θaxis, the angle of the longitudinal axis of the myocytes. B, SFT of the image shown in A. ΔΘ, the half-angular width of the sector (red lines) centred at Θaxis and used for computing the linear spectral profile shown in C. C, the spectral profile obtained from the SFT spectrum shown in B. The x axis is the size of spatial features, from the largest (450 μm) to the smallest (0.9 μm). The profile reveals the mitochondrial peak and its first harmonic. The position of the mitochondrial peak is at 2.4 μm cycle−1 with corresponds to the sarcomere length. The algorithm searched for the maximum in the user-defined search range and then computed the area under the peak within a user-defined half-width, subtracting the background level. MPA, mitochondrial peak area.
Sensitivity of MPA, mean FTMRM, and SD/mean of FTMRM to mitochondrial uncoupling by FCCP
In the past, either mean FTMRM or standard deviation of FTMRM divided by the mean (SD/mean of FTMRM, a measure of spatial heterogeneity; Duchen et al. 2003; Brennan et al. 2006) were used for tracking changes in ΔΨm. In order to compare MPA to these other metrics, we first had to ensure stability of these parameters at baseline conditions. Supplemental Fig. 3 shows that even during long perfusion with TMRM (of the order of 1 h), mean FTMRM did not reach steady state and kept increasing. In contrast, after TMRM washout all three parameters were reasonably stable (see Supplemental Fig. 4), even though MPA and SD/mean of FTMRM typically fluctuated more than mean FTMRM.
Figure 3 shows results from an experiment in which the response of MPA to mitochondrial uncoupling by FCCP was compared to that of mean FTMRM and SD/mean of FTMRM. The three parameters were measured as functions of FCCP concentration, laser power, and the size of the region of interest (ROI). The top row in Fig. 3A shows the full image under control conditions and indicates how the large ROI and the small ROI were selected from the full image. The small ROI roughly encompassed just two myocytes. Note that for the purposes of computing MPA for ROIs, the black peripheral areas were included in the image in order to preserve the spatial frequency resolution. The bottom row in Fig. 3A shows the full image recorded at different FCCP concentrations. All images shown in Fig. 3A were obtained at a laser power of 0.48 mW (40% of maximum power of 1.2 mW). One can see that the brightness of the images changes very little up to an FCCP concentration of 5 μm, and then decreases dramatically at 20 μm FCCP. Figure B–D shows mean FTMRM, SD/mean of FTMRM and MPA, respectively, for different FCCP concentrations and ROIs. There were slight differences between measurements of the same parameter in different ROIs, reflecting local heterogeneities in the image features. Note, however, the principally different response to increasing levels of mitochondrial uncoupling between mean FTMRM, SD/mean FTMRM, and MPA. In agreement with visual perception of images shown in Fig. 3A, mean FTMRM changed very little, at most by 10%, at FCCP concentrations up to 5 μm and then dropped abruptly to an almost background level at 20 μm FCCP (see Fig. 3B). SD/mean of FTMRM exhibited a slightly higher sensitivity, with 15–20% decrease between 0 and 5 μm FCCP followed by a dramatic decrease between 5 and 20 μm FCCP (Fig. 3C). In contrast, the largest decrease in MPA value (40–50% depending on the ROI) occurred in response to 1 μm FCCP (Fig. 3D). Subsequent increases in FCCP concentrations to 5 and 20 μm caused further progressive decreases in MPA, by an additional 20–30%, approaching zero at 20 μm.
Figure 3. The dependence of MPA, mean FTMRM and SD/mean FTMRM on FCCP concentration, laser power, and the size of the region of interest.
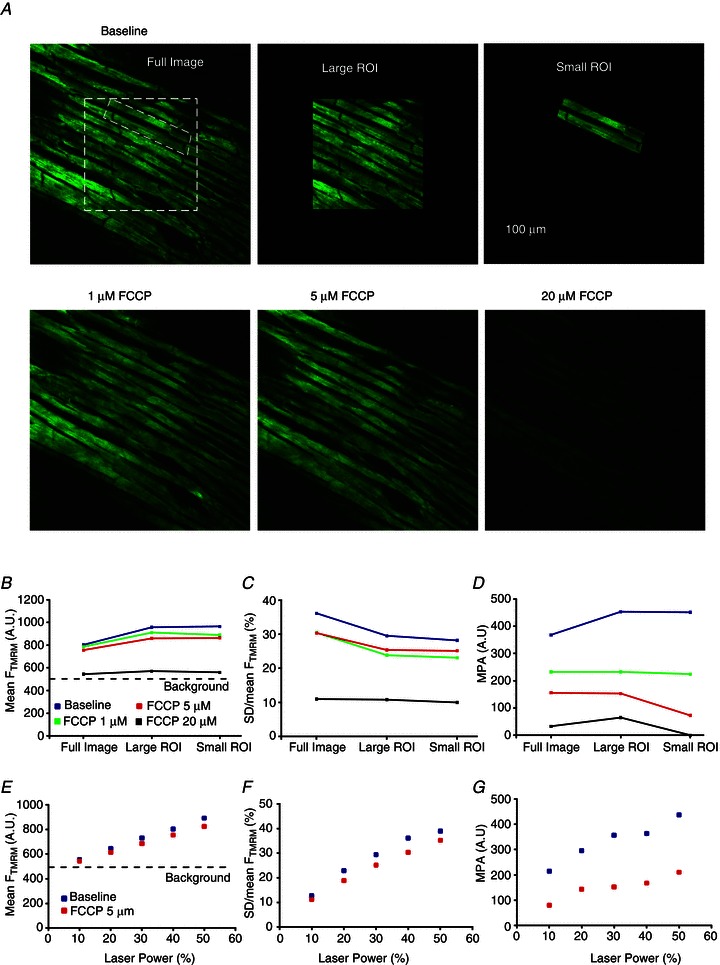
A, confocal images of FTMRM. Top row, left to right: three different areas (full image, large ROI and small ROI) in which the parameters were calculated. Bottom row, left to right: full image at 1, 5 and 20 μm FCCP. At each FCCP concentration, the parameters of TMRM fluorescence were calculated for the full image and the two ROIs. B–D, mean FTMRM, SD/mean FTMRM and MPA, respectively, computed for the full image and the two ROIs in the absence and the presence of FCCP (1, 5 and 20 μm). E–G, mean FTMRM, SD/mean FTMRM and MPA, respectively, computed for the full image in the absence and in the presence of FCCP (5 μm) as the function of laser power.
We also assessed how the sensitivity of mean FTMRM, SD/mean FTMRM and MPA to mitochondrial depolarization caused by 5 μm FCCP depends on the variation in laser power (Fig. 3E–G, respectively). The data are from the ‘full image’ (see Fig. 3A, top row, left image). As expected, mean FTMRM linearly decreases with attenuation of laser power, approaching the threshold of detection at 10% of maximum power (see Fig. 3E). Note that the difference in the mean FTMRM in the absence and in the presence of 5 μm FCCP is minor, and is further diminished at reduced levels of laser power. SD/mean FTMRM (Fig. 3F) showed a slightly better sensitivity, again dependent on the laser power. However, MPA (shown in Fig. 3G) showed a significant improvement in sensitivity over SD/mean FTMRM. Even though MPA also tended to decrease with decreasing laser power (which might be due to increasing contribution of background noise to the Fourier spectrum), the mitochondrial depolarization caused by 5 μm FCCP was still clearly detectable, even under the low-light conditions observed at the lowest laser power, due to a decrease of ∼63% in the value of MPA.
Supplemental Figs 5–8 provide additional examples of FCCP effects on mean FTMRM and MPA under various experimental conditions. Note that the invariable decrease of mean FTMRM upon application of FCCP seen in Supplemental Figs 5, 7 and 8 rules out the presence of TMRM quenching (Duchen et al. 2003) in our experiments. Regarding the dose dependence of the FCCP effect, the smallest concentration of FCCP having detectable effect was between 300 nM and 1 μm, which is similar to published data (Brennan et al. 2006). However, even at the concentration of 5 μm we could still see residual mitochondrial peaks (see Supplemental Figs 6 and 8), suggesting the presence of residual mitochondrial polarization. The peaks were no longer visually discernible from noise when FCCP concentration was raised to 20 μm (see Supplemental Fig. 6) or when the glycolytic inhibitor iodoacetate was added after 5 μm FCCP (see Supplemental Fig. 8). Thus, it appears that a relatively high concentration of FCCP (>5 μm) is necessary to fully dissipate ΔΨm and that anaerobic glycolysis might contribute to ΔΨm maintenance in partially uncoupled mitochondria. Note also that, even though in isolated cells both MPA and mean FTMRM responded relatively quickly to ΔΨm depolarization by FCCP, in whole hearts MPA still responded fast, but mean FTMRM responded very slowly (see Supplemental Fig. 8). The slower speed of TMRM loss from cells within the tissue might be due to the presence of additional diffusional barriers for TMRM in the intact heart. In summary, our data suggest that in whole hearts MPA is a more sensitive marker of mitochondrial polarization than the mean FTMRM and SD/mean FTMRM, and it is conceivable that the absence of mitochondrial peak (MPA ≍ 0) signifies a complete or near-complete ΔΨm loss.
The dynamics of MPA, mean FTMRM and SD/mean of FTMRM during no-flow ischaemia
Confocal imaging during ischaemia–reperfusion was seriously confounded by massive changes in the heart shape, which invariably occurred upon the onsets of both ischaemia and reperfusion (see Fig. 5 below and Supplemental Fig. 9). Therefore, it was virtually impossible to keep the same field of view throughout the entire ischaemia–reperfusion protocol. We lost the pre-ischaemic field of view after the onset of ischaemia in seven out eight cases, and we lost the ischaemic field of view after the onset of reperfusion in eight out of eight cases. In none of the experiments were we able to maintain the same field of view throughout the entire ischaemia–reperfusion protocol. The average duration of blind periods were 8.1 ± 1.9 min and 4.6 ± 3.2 min upon the onset of ischaemia and resumption of flow, respectively.
Figure 5. The dynamics of mean FTMRM recorded using an optical mapping setup during global ischaemia and reperfusion.
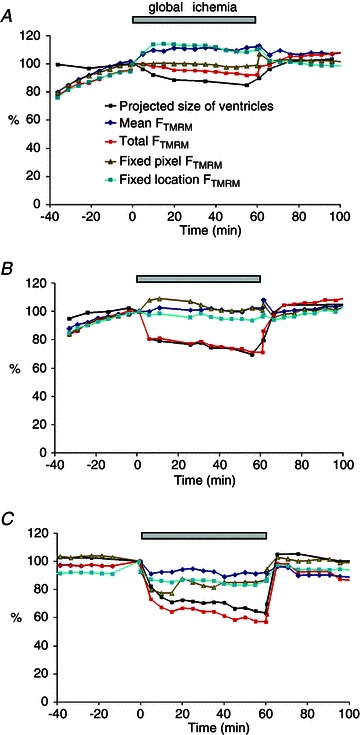
A–C, recordings obtained from 3 different hearts. The measured parameters included the projected size of the ventricles (pixel count of the mapped area), mean FTMRM, total FTMRM, and examples of recordings obtained from a fixed pixel (i.e. the fixed position in the CCD sensor regardless of the changes in the heart shape) and a fixed location (i.e. the same physical point on the heart surface which is projected on different pixels as the heart shape changes). Note that the total FTMRM decreased in all hearts at least partially due to the decrease in the size of the ventricles. However, the dynamics of other types of FTMRM measurements were in general inconsistent.
Despite these limitations, the MPA analysis enabled us to extract definitive information about the dynamics of ΔΨm depolarization and recovery during ischaemia–reperfusion. Figure 4 shows an example of confocal imaging of FTMRM before, during, and after a 70 min episode of no-flow ischaemia. The plots in Fig. 4A shows the time course of MPA (green), mean FTMRM (blue), and SD/mean FTMRM (light blue). The gaps in the curves indicate changes in the field of view upon both the start of ischaemia and the start of reperfusion, and the ‘blind periods’ during which no stable images could be obtained. Figure 4Ba–f shows the spectral profiles and mitochondrial peaks at the respective time points a–f indicated in panel A. Before ischaemia, a robust mitochondrial peak can be seen in the SFT spectrum (see Fig. 4Ba). The field of view was re-established after 10 min of ischaemia. Between 10 and 25 min of ischaemia the value of MPA was close to the pre-ischaemic value, despite the fact that the field of view was different. Note, however, that the position of the peak changed from 2.39 μm cycle−1 to 1.98 μm cycle−1 (compare panels Ba and Bb), which is consistent with a decrease in sarcomere length and shrinking of the heart (see Supplemental Fig. 9). After 25 min of ischaemia the MPA began to drop, a process that took about 36 min to reach the level below detectability at approximately 60 min of ischaemia (see Fig. 4Bc). Although mean FTMRM and SD/mean FTMRM also decreased during ischaemia, MPA exhibited the largest fractional decrease and, unlike mean FTMRM and SD/mean FTMRM, MPA dynamics enabled a definitive statement of complete or near-complete ΔΨm loss at around 60 min of ischaemia.
Figure 4. The dynamics of MPA, mean FTMRM and SD/mean FTMRM FTMRM during global ischaemia and reperfusion.
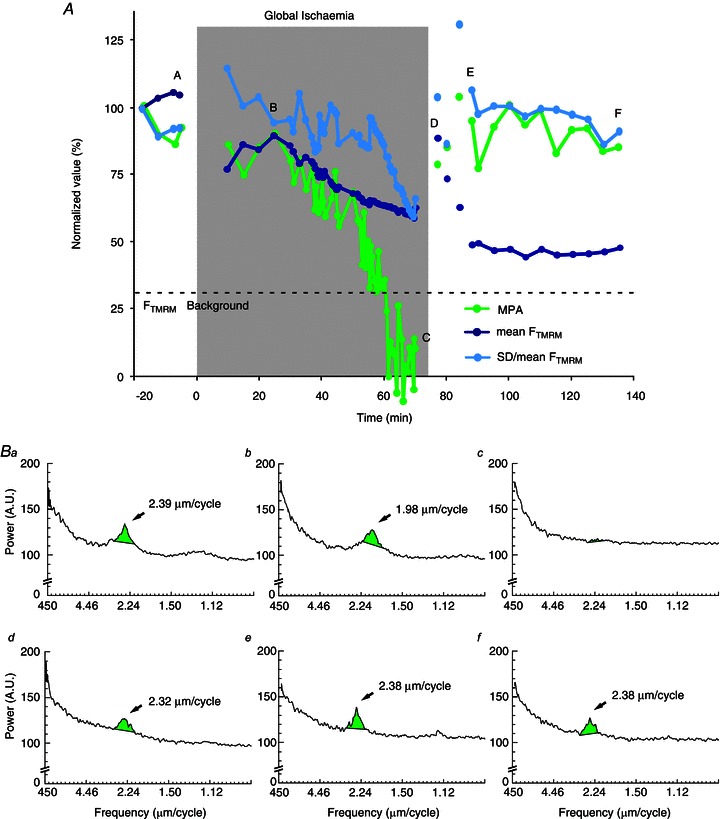
A, the plots of MPA (green), mean FTMRM (blue) and SD/mean FTMRM (light blue) before, during and after 70 min episode of ischaemia. Continuous curves indicate recordings from the same field of view. The field of view had to be changed during early ischaemia and early reperfusion because of macroscopic changes in the heart shape. Note that MPA rapidly decreases to an undetectable level between 50 and 60 min of ischaemia and recovers to the level comparable to that before ischaemia within 5 min of reperfusion. Changes in mean FTMRM and SD/mean FTMRM during ischaemia–reperfusion are much less prominent and inconclusive. Panels Ba–f show the spectral profiles and mitochondrial peaks at the respective time points indicated in A. Note that the mitochondrial peak shifts to a shorter spatial period (1.98 μm cycle−1) during ischaemia and returns to the pre-ischaemic position (2.38 μm cycle−1) upon reperfusion.
Upon reperfusion, the field of view had to be re-established four times due to the continuous expansion of the heart. The earliest reperfusion image was taken at 2 min of reperfusion (see point d in Fig. 4A and the respective spectrum in Fig. 4Bd) and already showed a robust recovery to near pre-ischaemic levels of all measured parameters. The second and third post-ischaemic fields of view yielded somewhat discordant fluctuations of mean FTMRM and SD/mean FTMRM reflecting a high dependence of these parameters on the specific features of individual fields of view. The fourth field of view was retained for another 50 min (between points e and f in Fig. 4A) without showing any major changes either in MPA, or mean FTMRM, or SD/mean of FTMRM. Note that during this time frame MPA and SD/mean of FTMRM maintained highly stable levels suggestive of a maintained recovery whereas mean FTMRM showed stable low level, which per se could be interpreted as the lack of recovery of ΔΨm upon reperfusion.
In six out of seven experiments MPA exhibited a dramatic decrease during ischaemia approaching values comparable to those induced by 5–20 μm of FCCP, but only after a delay ranging between 30 and 70 min (see Supplemental Fig. 10). Thus, MPA analysis suggests a much later timing of ΔΨm collapse during myocardial ischaemia than reported previously (Lyon et al. 2010). Sampling of MPA in multiple fields of view during reperfusion suggested spatially heterogeneous and incomplete recovery of ΔΨm, not entirely unexpected after these long episodes of global ischaemia (see Supplemental Fig. 10).
Cell-to-cell heterogeneities in parameters of TMRM fluorescence
Although the MPA method was mainly tested on multicellular fields of view, differences in the TMRM parameters between individual myocytes were frequently observed and could be potentially quantified in terms of mean FTMRM, SD/mean FTMRM and MPA. In qualitative terms, two principally different alterations of TMRM fluorescence could be observed during I–R at the level of individual cells. The first pattern, and by far the most widespread during ischaemia, was a radical decrease in MPA amid a small (<20%) decrease in mean FTMRM (see Fig. 4 above and Supplemental Fig. 11 and 12). Visually such pattern was perceived as a transition from a ‘granular’ to a ‘smooth’ cell appearance, which could initially occur in individual cells and propagate as a wave (see Supplemental Video 1). MPA computed for the area exhibiting wave-like mitochondrial depolarization showed a monotonic decrease of MPA (see Supplemental Fig. 11). Thus, in essence, MPA decreased whenever any portion of the analysed region exhibited ΔΨm loss.
The second pattern was an abrupt appearance of individual myocytes or small groups of myocytes exhibiting a radical decrease in both mean FTMRM and MPA (see Supplemental Fig. 13 and 14). Such ‘dropouts’ were observed in five out of eight hearts at late stages of ischaemia or during reperfusion and are probably similar to those reported previously.(Matsumoto-Ida et al. 2006; Slodzinski et al. 2008; Davidson et al. 2012) The abrupt and catastrophic loss of TMRM from ‘dropouts’ appears to be a distinct and independent phenomenon from the slow and more global decrease in MPA not accompanied by a major dye loss (see more in Discussion).
The dynamics of FTMRM derived from optical mapping during mitochondrial uncoupling and I–R
Previous reports using wide-field optical mapping indicated large changes in FTMRM within the first few minutes of no-flow ischaemia (Lyon et al. 2010), which is in apparent contradiction with the confocal data presented above. Optical mapping provides data averaged over many cells, and at a larger spatial scale (millimetres). To test the possibility that the signs of early mitochondrial depolarization can be detected at this larger scale, we investigated the dynamics of spatially averaged FTMRM using a standard optical mapping technique in the same species (rabbit) and under exactly the same experimental conditions as we used in confocal experiments described above.
Whereas application of FCCP (5 μm) in normally perfused hearts induced an expected (albeit slow) decrease of mean FTMRM in optical maps (see Supplemental Fig. 15), no unequivocal conclusion could be made with regard to changes in FTMRM in hearts subjected to global I–R. The interpretation of these data was seriously confounded by shrinking of the heart upon the onset of ischaemia and recovery of the shape (sometimes incomplete) upon reperfusion (see Supplemental Fig. 9). Figure 5A–C shows results from three different hearts subjected to I–R. In each heart we tracked changes in the size of the ventricles (as the number of pixels covering the projected image) in parallel to changes in FTMRM. Four different FTMRM measurements are shown for each heart: total FTMRM (fluorescence integrated over the mapped area); mean FTMRM (total FTMRM divided by the pixel count); fixed pixel FTMRM (fluorescence recorded from a single pixel with fixed coordinates) and fixed location FTMRM (our best effort to track fluorescence coming from the same physical point on the surface of the heart, based on anatomical landmarks). One can see that the total FTMRM decreased during ischaemia, closely following the decrease in the projected surface area. At the same time, the mean FTMRM did not show any consistent change. Likewise, measurements from a ‘fixed pixel’ and even ‘fixed location’ could show either an increase or a decrease during ischaemia. Amid these inconsistent outcomes, we concluded that, at least in our experimental model, FTMRM derived from wide-field optical mapping could not faithfully represent ΔΨm changes during ischaemia.
Discussion
In this methodological study we developed and validated a novel spectral method (the MPA method) for tracking significant changes in ΔΨm during I–R in confocally imaged ventricular tissue. Below we will discuss the strengths and limitations of this method in comparison to other approaches, as well as general limits of our ability to image ΔΨm during real ischaemia–reperfusion.
The major advantage of the MPA method is that it is highly sensitive and selective to the accumulation of the dye in the mitochondrial matrix. The method takes advantage of the mitochondrial packaging specific to cardiac myocytes, such that many (although not all) mitochondria are constrained between the z-disks (Vendelin et al. 2005). When the mitochondria are well polarized, the spatially periodic increases in FTMRM corresponding to the mitochondrial arrays (see Fig. 1Ba) create a distinct mitochondrial peak in the spatial Fourier spectrum (see Fig. 1Ca). The observation that this peak fully disappears upon mitochondrial uncoupling by a high concentration of FCCP (see Fig. 1Cb) provides strong evidence that the absence of the peak heralds a complete or almost complete loss of ΔΨm. While we cannot completely exclude the possibility that mitochondrial fusion/fission may affect the MPA value, available evidence suggests a quantitatively modest change in the mitochondrial size distribution during ischaemia in the whole heart (Ong et al. 2010), which can hardly explain the essentially all-or-none changes in MPA observed during I–R in our study.
To the best of our knowledge, none of the previous approaches afforded such a definitive conclusion with regard to the event of ΔΨm loss. Since the MPA method relies on the specific pattern of mitochondrial packaging in sarcomeres, it is limited to myocardium and presumably skeletal muscle where mitochondrial organization is somewhat similar (Vendelin et al. 2005). However, knowledge of specific shape/size constraints of mitochondria in other cell types can potentially help to develop image-processing approaches for a more mitochondria-specific interpretation of those fluorescent dyes which are present in multiple cellular compartments (Gerencsér & Adam-Vizi, 2001).
A serious obstacle for continuous assessment of MPA in the same field of view during I–R, inherent to microscopic imaging in ischaemic hearts, is the large change in the heart shape accompanying both ischaemia and reperfusion. This phenomenon effectively prevented us from tracking the same group of cells throughout the entire ischaemia–reperfusion protocol in the vast majority of hearts. It should also be noted that tissue drift (albeit at a smaller scale) usually occurred during the rapid phase of ischaemic mitochondrial depolarization (see for example Supplemental Video 1) and could also diminish our ability to make a definitive statement regarding the timing of ΔΨm loss in a specific group of cells. Note also that the tissue displacement, in general, occurred not only in the plane of view but also in depth, further complicating tracking the same group of cells during relevant events. Our approach to alleviate this problem was acquiring z-stacks (10 to 15 slices, at ∼3 μm steps) and then automatically selecting the slice with the largest value of MPA (other criteria of selection, including algorithms of image correlation and visual recognition of image traits, can be applied). Trade-offs of acquiring z-stacks include reduced maximal temporal resolution and increased laser exposure. A recently reported approach for automated real-time tracking/stabilization of confocal images in whole hearts (Schroeder et al. 2010), combined with the MPA method described here, may provide an ultimate tool for the analysis of ΔΨm dynamics during I–R in whole hearts. Also, multi-photon imaging may improve the robustness of the MPA technique due to inherently sharper spatial resolution and decrease in blur, especially in deeper myocardial layers.
Another significant limitation of MPA is the lack of a simple method to calibrate MPA values in terms of actual millivolts of ΔΨm. Again, this limitation is shared with all prior work in perfused myocardial preparations (or in isolated cardiomyocytes, for that matter). In that regard, we presented the data of MPA titration with different concentrations of FCCP (Fig. 3 and Supplemental Fig. 4), which may serve as a semi-quantitative approach for interpretation of MPA values. A dose–response function of ΔΨm versus[FCCP] can be obtained in a mitochondrial assay (Scaduto & Grotyohann, 1999). The validity of such calibration, however, will rely on the (rather strong) assumption that isolated mitochondria have the same sensitivity to FCCP as the mitochondria in intact myocardium. In any case, values of MPA obtained during ischaemia can be compared to those obtained in the same experimental model in the presence of FCCP. In previous studies FCCP concentrations in the micromolar range were considered to be sufficient to completely dissipate ΔΨm (Johnson et al. 1981; Petronilli et al. 2001; Duchen et al. 2003). In our study 1 μm FCCP decreased MPA by 50%, and 5 μm FCCP brought MPA values to the level of 136 ± 21 but still did not fully eliminated mitochondrial peaks. At the end of ischaemia, we observed MPA values below 136 in all experiments (see Supplemental Fig. 10), and in some cases the mitochondrial peak was visually undetectable (comparable to the effect of 20 μm FCCP). Thus, we can conclude that during ischaemia the degree of ΔΨm depolarization was comparable to, or exceeded that, of ΔΨm depolarization caused by 5 μm FCCP.
It is more difficult to form conclusions regarding intermediate levels of MPA. Even during normal perfusion, the variability of MPA was quite high, ranging from 550 to 210 (see Supplemental Fig. 10). Whereas we cannot exclude heterogeneities in ΔΨm at baseline, we have an impression that this variability was mostly due to variability in the quality and sharpness of the image. Note, however, that in those cases when we were able to maintain the same field of view during ischaemia, the observation of a continuous monotonic decrease in MPA provided valuable information about the timing and the speed of ΔΨm loss and recovery. For example, the ischaemic data obtained in this study suggest that a significant ΔΨm depolarization occurs relatively late in ischaemia (after ∼30 min) and is a relatively slow process (takes at least 10–15 min), but can be essentially complete by 60–70 min of ischaemia. However, even after such a prolonged time of ischaemia, a relatively fast recovery of ΔΨm could be observed upon reperfusion at least in some hearts, without evidence of massive and fatal ΔΨm loss up to 1 h following reperfusion. Also, the recovery upon reperfusion appeared to be heterogeneous (see Supplemental Fig. 10).
The comparative analysis of the dynamics of MPA and mean FTMRM gave us a new perspective on previous observations in the setting of I–R in whole hearts. Several prior publications were focused on the ‘dropouts’– cells exhibiting ‘rapid, complete, and irreversible’ (Matsumoto-Ida et al. 2006) loss of mean FTMRM during I–R (Matsumoto-Ida et al. 2006; Slodzinski et al. 2008; Davidson et al. 2012). We also observed accidental ‘dropouts’ during I–R in our experiments (see Supplemental Fig. 13 and 14). The abrupt and catastrophic decline in both MPA and mean FTMRM observed in ‘dropouts’ appears to be a distinct and independent phenomenon from the slow and global decrease in MPA (which reflected mitochondrial dye loss) amid only a minor change in mean FTMRM. Why the ‘dropouts’ lose TMRM so quickly from the cytoplasm is not clear, but might reflect a significant loss of sarcolemmal polarization and/or integrity in addition to the loss of the mitochondrial potential. Further studies are needed to resolve the timing and possible cause–effect relationships between critical mitochondrial and sarcolemmal events during I–R.
We should also comment on the previously published notion of ‘waves of mitochondrial membrane potential collapse’ occurring within the first 5 min of ischaemia (Lyon et al. 2010). The timing of ΔΨm loss during ischaemia is relevant to explaining electrical depression and arrhythmias during early ischaemia or cardiac arrest, which might be related to mitochondrial depolarization (Akar et al. 2005). We have to mention that, based on our study, any conclusions regarding fluorescence changes in this very acute phase of global ischaemia are severely confounded by the attendant changes in the heart shape (see Supplemental Fig. 9). In our confocal experiments we were unable to track myocytes during this stage, but even after 10–15 min of ischaemia all the measured TMRM parameters (mean FTMRM, SD/mean of FTMRM, and MPA) were typically not different from those before ischaemia. At the same time, a major decrease in MPA was typically observed only after 30–40 min of ischaemia (see Supplemental Fig. 10). Moreover, performing optical mapping experiments in the same species (rabbit) and using the same experimental conditions as in our confocal experiments, we realized that the complex dynamical changes in the projection of the heart image to the imaging sensor, in the presence of inherent heterogeneities in dye distribution and illumination, makes the local estimate of FTMRM dynamics dependent on a large number of unknown geometric factors. As a result, changes in per-pixel FTMRM signal cannot be disentangled from changes in the heart geometry. Thus, the timing and the dynamics of ΔΨm loss/recovery during I–R in whole hearts remain to be settled.
Summary and conclusions
Quantification of mitochondrial spectral peaks derived from confocal TMRM images may be the most sensitive method for tracking significant ΔΨm changes during no-flow ischaemia and reperfusion in intact hearts. Using this method, we conclude that a significant ΔΨm depolarization occurs no earlier than 30 min of ischaemia, and at least a partial recovery of ΔΨm occurs upon reperfusion following 60+ min of ischaemia. This phenomenon is different from a catastrophic and irreversible loss of FTMRM in individual myocytes (‘dropouts’) amid neighboring cells maintaining high FTMRM level. The relationship between the two ‘modes’ of presumed ΔΨm depolarization remains unclear. In the isolated Langendorff-perfused rabbit heart, wide-field imaging of FTMRM can be used for detection of ΔΨm loss in the presence of coronary perfusion, but does not provide reliable information during no-flow ischaemia and subsequent reperfusion.
Acknowledgments
The critical contributions of Dennis King, Bruce Steadman and Philip Ershler (CVRTI, University of Utah) into the technical aspect of this study is greatly appreciated. This study was supported by NIH NHLBI Grants 5-R01-HL-088444, 5 R01 HL103877 and Nora Eccles Treadwell Foundation research grant (A.V.Z.), NIH NRSA fellowship 5-F32-HL-097576 (J.S.), and NIH NHLBI Grant 5R37 HL0042873-24 (K.W.S.). The authors disclose no conflict of interests.
Glossary
- ΔΨm
mitochondrial membrane potential
- FCCP
carbonylcyanide-p-trifluoromethoxyphenyl hydrazone (a protonophore and potent uncoupler of oxidative phosphorylation)
- FTMRM
fluorescence of TMRM
- mean FTMRM
spatially averaged fluorescence of TMRM
- IAA
sodium iodoacetate (an inhibitor of anaerobic glycolysis)
- I–R
ischaemia–reperfusion
- LV
left ventricle
- MPA
mitochondrial peak area
- ROI
region of interest
- RV
right ventricle
- SD/mean of FTMRM
standard deviation of TMRM fluorescence over space divided by the mean
- SFT
spatial Fourier transform
- TMRM
tetramethylrhodamine methyl ester (a cationic fluorescent dye)
Author contributions
Experiments described in this article were performed in the laboratory of Dr Zaitsev at the Nora Eccles Harrison Cardiovascular Research and Training Institute (CVRTI), University of Utah, Salt Lake City, Utah. The Zeiss confocal system is a shared facility at the CVRTI. The authors’ contributions are as follows. Conception and design of the experiments: A.V.Z., P.W.V., K.W.S.; collection, analysis and interpretation of data: P.W.V., K.W.S., A.V.Z., M.W., J.S., K.J.S., J.Z., T.G.T.; drafting the article or revising it critically for important intellectual content: P.W.V., A.V.Z., K.W.S., T.G.T. All authors read and approved the final version of the manuscript.
Supplementary material
Supplemental Figure 1.
Supplemental Figure 2.
Supplemental Figure 3.
Supplemental Figure 4.
Supplemental Figure 5.
Supplemental Figure 6.
Supplemental Figure 7.
Supplemental Figure 8.
Supplemental Figure 9.
Supplemental Figure 10.
Supplemental Figure 11.
Supplemental Figure 12.
Supplemental Figure 13.
Supplemental Figure 14.
Supplemental Figure 15.
Supplemental Table 1.
Supplemental Video 1.
References
- Ajiro Y, Saegusa N, Giles WR, Stafforini DM, Spitzer KW. Platelet-activating factor stimulates sodium-hydrogen exchange in ventricular myocytes. Am J Physiol Heart Circ Physiol. 2011;301:H2395–H2401. doi: 10.1152/ajpheart.00607.2011. [DOI] [PMC free article] [PubMed] [Google Scholar]
- Akar FG, Aon MA, Tomaselli GF, O’Rourke B. The mitochondrial origin of postischemic arrhythmias. J Clin Invest. 2005;115:3527–3535. doi: 10.1172/JCI25371. [DOI] [PMC free article] [PubMed] [Google Scholar]
- Brennan JP, Berry RG, Baghai M, Duchen MR, Shattock MJ. FCCP is cardioprotective at concentrations that cause mitochondrial oxidation without detectable depolarisation. Cardiovasc Res. 2006;72:322–330. doi: 10.1016/j.cardiores.2006.08.006. [DOI] [PubMed] [Google Scholar]
- Davidson SM, Yellon DM, Murphy MP, Duchen MR. Slow calcium waves and redox changes precede mitochondrial permeability transition pore opening in the intact heart during hypoxia and reoxygenation. Cardiovasc Res. 2012;93:445–453. doi: 10.1093/cvr/cvr349. [DOI] [PubMed] [Google Scholar]
- Duchen MR, Surin A, Jacobson J. Imaging mitochondrial function in intact cells. Methods Enzymol. 2003;361:353–389. doi: 10.1016/s0076-6879(03)61019-0. [DOI] [PubMed] [Google Scholar]
- Fedorov VV, Lozinsky IT, Sosunov EA, Anyukhovsky EP, Rosen MR, Balke CW, Efimov IR. Application of blebbistatin as an excitation-contraction uncoupler for electrophysiologic study of rat and rabbit hearts. Heart Rhythm. 2007;4:619–626. doi: 10.1016/j.hrthm.2006.12.047. [DOI] [PubMed] [Google Scholar]
- Gerencsér ÁA, Adam-Vizi V. Selective, high-resolution fluorescence imaging of mitochondrial Ca2+ concentration. Cell Calcium. 2001;30:311–321. doi: 10.1054/ceca.2001.0238. [DOI] [PubMed] [Google Scholar]
- Jin H, Nass RD, Joudrey PJ, Lyon AR, Chemaly ER, Rapti K, Akar FG. Altered spatiotemporal dynamics of the mitochondrial membrane potential in the hypertrophied heart. Biophys J. 2010;98:2063–2071. doi: 10.1016/j.bpj.2010.01.045. [DOI] [PMC free article] [PubMed] [Google Scholar]
- Johnson LV, Walsh ML, Bockus BJ, Chen LB. Monitoring of relative mitochondrial membrane potential in living cells by fluorescence microscopy. J Cell Biol. 1981;88:526–535. doi: 10.1083/jcb.88.3.526. [DOI] [PMC free article] [PubMed] [Google Scholar]
- Kato M, Akao M, Matsumoto-Ida M, Makiyama T, Iguchi M, Takeda T, Shimizu S, Kita T. The targeting of cyclophilin D by RNAi as a novel cardioprotective therapy: evidence from two-photon imaging. Cardiovasc Res. 2009;83:335–344. doi: 10.1093/cvr/cvp094. [DOI] [PubMed] [Google Scholar]
- Lyon AR, Joudrey PJ, Jin D, Nass RD, Aon MA, O’Rourke B, Akar FG. Optical imaging of mitochondrial function uncovers actively propagating waves of mitochondrial membrane potential collapse across intact heart. J Mol Cell Cardiol. 2010;49:565–575. doi: 10.1016/j.yjmcc.2010.07.002. [DOI] [PMC free article] [PubMed] [Google Scholar]
- Matsumoto-Ida M, Akao M, Takeda T, Kato M, Kita T. Real-time 2-photon imaging of mitochondrial function in perfused rat hearts subjected to ischemia/reperfusion. Circulation. 2006;114:1497–1503. doi: 10.1161/CIRCULATIONAHA.106.628834. [DOI] [PubMed] [Google Scholar]
- Ong S-B, Subrayan S, Lim SY, Yellon DM, Davidson SM, Hausenloy DJ. Inhibiting mitochondrial fission protects the heart against ischemia/reperfusion injury. Circulation. 2010;121:2012–2022. doi: 10.1161/CIRCULATIONAHA.109.906610. [DOI] [PubMed] [Google Scholar]
- Petronilli V, Penzo D, Scorrano L, Bernardi P, Di Lisa F. The mitochondrial permeability transition, release of cytochrome c and cell death. J Biol Chem. 2001;276:12030–12034. doi: 10.1074/jbc.M010604200. [DOI] [PubMed] [Google Scholar]
- Scaduto RC, Jr, Grotyohann LW. Measurement of mitochondrial membrane potential using fluorescent rhodamine derivatives. Biophys J. 1999;76:469–477. doi: 10.1016/S0006-3495(99)77214-0. [DOI] [PMC free article] [PubMed] [Google Scholar]
- Schroeder JL, Luger-Hamer M, Pursley R, Pohida T, Chefd’Hotel C, Kellman P, Balaban RS. Short Communication: Subcellular motion compensation for minimally invasive microscopy, in vivo: Evidence for oxygen gradients in resting muscle. Circ Res. 2010;106:1129–1133. doi: 10.1161/CIRCRESAHA.109.211946. [DOI] [PMC free article] [PubMed] [Google Scholar]
- Skolnick RL, Litwin SE, Barry WH, Spitzer KW. Effect of ANG II on pHi, [Ca2+]i, and contraction in rabbit ventricular myocytes from infarcted hearts. Am J Physiol Heart Circ Physiol. 1998;275:H1788–H1797. doi: 10.1152/ajpheart.1998.275.5.H1788. [DOI] [PubMed] [Google Scholar]
- Slodzinski MK, Aon MA, O’Rourke B. Glutathione oxidation as a trigger of mitochondrial depolarization and oscillation in intact hearts. J Mol Cell Cardiol. 2008;45:650–660. doi: 10.1016/j.yjmcc.2008.07.017. [DOI] [PMC free article] [PubMed] [Google Scholar]
- Vendelin M, Béraud N, Guerrero K, Andrienko T, Kuznetsov AV, Olivares J, Kay L, Saks VA. Mitochondrial regular arrangement in muscle cells: a ‘crystal-like’ pattern. Am J Physiol Cell Physiol. 2005;288:C757–C767. doi: 10.1152/ajpcell.00281.2004. [DOI] [PubMed] [Google Scholar]
Associated Data
This section collects any data citations, data availability statements, or supplementary materials included in this article.