

SUMMARY
Escherichia coli react to changes from aerobic to anaerobic conditions of growth using the ArcA-ArcB two-component signal transduction system. This system, in conjunction with other proteins, regulates the respiratory metabolic pathways in the organism. ArcA is a member of the OmpR/PhoB subfamily of response regulator transcription factors that are known to regulate transcription by binding in tandem to target DNA direct repeats. It is still unclear in this subfamily how activation by phosphorylation of the regulatory domain of response regulators stimulates DNA binding by the effector domain and how dimerization and domain orientation, as well as intra- and intermolecular interactions, affect this process. In order to address these questions we have solved the crystal structure of the regulatory domain of ArcA in the presence and absence of the phosphoryl analog, BeF3−. In the crystal structures, the regulatory domain of ArcA forms a symmetric dimer mediated by the α4-β5-α5 face of the protein and involving a number of residues that are highly conserved in the OmpR/PhoB subfamily. It is hypothesized that members of this subfamily use a common mechanism of regulation by dimerization. Additional biophysical studies were employed to probe the oligomerization state of ArcA, as well as its individual domains, in solution. The solution studies show the propensity of the individual domains to associate into oligomers larger than the dimer observed for the intact protein, and suggest that the C-terminal DNA-binding domain also plays a role in oligomerization.
Keywords: ArcA, transcription regulation, response regulator, anoxic redox control, crystal structure
INTRODUCTION
Rapid responses to changes in the environment are crucial for bacterial competitiveness and survival, as well as for virulence. Many of these responses are coordinated through signaling systems known as two-component signal transduction systems.1,2 A typical two-component system (TCS) is comprised of a sensor histidine protein kinase (HK) and a response regulator (RR) protein. The HK senses environmental signals that regulate the equilibrium between its kinase and phosphatase activities. This in turn modulates the activity of the RR, facilitating transfer or removal of a phosphoryl group at a conserved aspartate in its regulatory domain. Phosphorylation of the RR induces conformational changes that result in an output response specific to the system. TCSs have not yet been identified in the animal kingdom and some have been shown to be essential for the survival of Gram-positive and Gram-negative pathogens. Therefore they are considered attractive targets for the development of antimicrobial drugs.3–5
In Escherichia coli, as in other facultative anaerobic bacteria, a complex regulatory network involving several transcription factors mediates adaptation to changes in various respiratory growth conditions.6,7 The ArcA-ArcB TCS is an important member of these regulatory systems involved in cell growth during anaerobiosis.8,9 The sensor ArcB is a member of the group of so-called unorthodox HKs that mediate multiple phosphoryl transfer reactions via several cytoplasmic His-Asp-containing domains.10,11 ArcB is comprised of a histidine kinase core, a central receiver domain and a C-terminal phosphotransfer domain. These catalytic domains are connected to the N-terminal transmembrane region by a putative leucine zipper and a sensing PAS (Per-Arnt-Sim) domain.12 Quinones have been identified as the redox signal sensed by this TCS13 and more recently a model for a quinone-sensitive redox switch in the HK ArcB has been proposed.12 The RR of this TCS is ArcA14, a global regulator known to control more than 30 operons involved in redox regulation (the Arc modulon).15 More recently its been reported that ArcA is involved in the direct regulation of at least 55 other operons implicated in numerous cell functions and that 9% of all open reading frames in E. coli are affected directly or indirectly by phosphorylated ArcA.16 ArcA, like the majority of RRs, is a transcription factor that, in addition to its N-terminal regulatory domain, contains a C-terminal helix-turn-helix DNA-binding domain. In recent years the ArcA-ArcB TCS has been implicated in the direct or indirect regulation of virulence and resistance in a number of clinically important human pathogens including Salmonella enterica serovar Enteritidis,17 Haemophilus influenzae18 and Vibrio cholerae.19
ArcA is a member of the OmpR/PhoB subfamily of RR transcription factors, by far the largest subfamily of RRs, accounting for 15 of the 34 RRs presently identified in E. coli.20,21 RRs of this subfamily are distinguished by a C-terminal winged helix-turn-helix DNA-binding motif22,23 and the most extensively characterized members of this subfamily are known to bind as tandem dimers to DNA direct repeat recognition sequences.24–26 Phosphorylation of the regulatory domain enhances DNA binding, ultimately resulting in regulation of transcription, but a detailed mechanism of this process has not been elucidated.
The crystal structures of two full-length RRs from other subfamilies, transcription factor NarL27 and methylesterase CheB,28 revealed the recognition helix of NarL and the active site of CheB to be occluded by their regulatory domains in their unphosphorylated states. This suggested a mechanism of regulation in which phosphorylation of the regulatory domain relieved an inhibitory interaction with the effector domain. This has been supported by subsequent biochemical and biophysical studies.29–32 In contrast, the crystal structures of two full-length RRs of the OmpR/PhoB subfamily from Thermotoga maritima, DrrD33 and DrrB,34 showed their recognition helices to be completely exposed, making them readily available for DNA binding. The structural data, together with several biochemical studies that point to the significance of dimerization for members of the OmpR/PhoB subfamily,34–38 are suggestive of a different mechanism for transcriptional regulation.
Details of the phosphorylation-mediated activation of regulatory domains are well understood.39 For the OmpR/PhoB subfamily, as for most RRs, questions remain as to how phosphorylation affects the DNA-binding domain, specifically with regard to domain orientations upon dimer and oligomer formation, and the contributions of both intra- and intermolecular interactions resulting in tandem DNA binding and ultimately in transcriptional regulation. Crystallographic studies of activated full-length RRs might provide insight to some of these questions. However, crystallization of such proteins has so far been unsuccessful, possibly due to intrinsic flexibility of the linker region between the regulatory and effector domains in the active state. Additionally, even though the OmpR/PhoB subfamily is the most represented subfamily in E. coli and other bacteria, no structures of phosphorylated isolated regulatory domains have been reported to date. This has prompted us to pursue structures of isolated regulatory domains in their active forms.
In this article, we report an analysis of the crystal structures of the N-terminal regulatory domain of E. coli ArcA (ArcAN) in the presence and absence of the previously described phosphoryl analog, BeF3−.40–42 This is the first report of the structure of an activated regulatory domain for a member of the OmpR/PhoB subfamily, providing insight into how the regulatory domain regulates the activities of the effector domain, and consequently, activation of transcription. The structures show a symmetric dimer mediated by the α4-β5-α5 face of the protein via the combination of a hydrophobic patch and a network of salt bridges which are both highly conserved exclusively in the OmpR/PhoB subfamily. We propose that most OmpR/PhoB subfamily members are activated by a common mode of dimerization. Additionally, we present solution studies showing that ArcA dimerizes using its N-terminal regulatory domain. The results also indicate a role for the C-terminal DNA-binding domain (ArcAC) in multimerization and regulation of the oligomerization state of the intact protein.
RESULTS
Structures of ArcAN and BeF3−-bound ArcAN
The structure of the regulatory domain of ArcA was determined using unbiased experimental phases obtained from single-wavelength anomalous dispersion data from a single crystal of selenomethionine-derivatized ArcAN. Phasing information from 8 selenium atoms, corresponding to two molecules in the asymmetric unit, was used to calculate an initial experimental electron density map taking advantage of density modification with two-fold non-crystallographic symmetry (NCS) averaging. After manual building of the initial model the structure was refined using NCS restraints to a final resolution of 2.5 Å. The final model includes residues 2–122 of monomer A, residues 2–123 of monomer B and 62 solvent molecules with a final Rcryst of 0.213 and Rfree of 0.256 (Table 1). For ArcAN-BeF3−, crystals of ArcAN were soaked for 9 h in a solution of mother liquor containing appropriate amounts of BeCl2, NaF and MgCl2. The structure was solved by molecular replacement using an alanine model of ArcAN lacking the β4-α4 and β5-α5 loops. After density modification, using NCS averaging, inspection of the resulting solvent-flattened electron density map showed clear strong density for the BeF3− and Mg2+ ions at the active site in both monomers. This was later corroborated by inspection of difference maps during the initial stages of refinement. The final model was refined using NCS restraints to a resolution of 2.15 Å and includes residues 2–122 of monomer A, residues 1–122 of monomer B and 124 solvent molecules with a final Rcryst of 0.187 and Rfree of 0.212 (Table 1).
Table 1.
Data collection and refinement statistics
| Data set | Native ArcAN | SeMeta ArcAN | SeMet ArcAN-BeF3− |
|---|---|---|---|
| Data collection | |||
| Space group | P6522 | ||
| Resolution limits (Å) | 30.0-2.50 (2.59-2.50) | 30.0-2.50 (2.59-2.50) | 30.0-2.15 (2.23-2.15) |
| Wavelength (Å) | 0.97139 | 0.97896 | 0.97176 |
| Unit-cell parameters: | |||
| a = b, c (Å) | 86.70, 214.71 | 87.04, 214.09 | 86.17, 213.08 |
| No. of reflections | 17,085 | 16,949 | 26,280 |
| Completeness (%) | 98.3 (95.6) | 97.4 (82.9) | 100 (100) |
| Rsymb | 0.10 (0.54) | 0.10 (0.45) | 0.11 (0.53) |
| I/σ (I) | 19.1 (2.9) | 26.7 (5.2) | 18.8 (3.7) |
| Refinement | |||
| Resolution limits (Å) | 30.0-2.50 (2.56-2.50) | - | 30.0-2.15 (2.21-2.15) |
| No. of protein monomersc | 2 | - | 2 |
| No. of protein atoms | 1,921 | - | 1,923 |
| No. of solvent molecules | 69 | - | 124 |
| No. of reflections (work/test) | 16,212/864 | - | 23,565/2,641 |
| Rcryst/Rfreed | 0.213/0.256 | - | 0.187/0.212 |
| rmsd bond length (Å) | 0.017 | - | 0.017 |
| rmsd bond angle (°) | 1.615 | - | 1.445 |
| Mean temperature factor (Å2) | 42.62 | - | 29.17 |
Values in parenthesis correspond to the highest resolution shell.
Selenomethionine-substituted protein.
Rsym = Σ|Iobs − Iavg|/ΣIavg
Protein monomers in the asymmetric unit.
R factor = Σ||Fobs|(hkl) − |Fcalc|(hkl)|/Σ|Fobs|(hkl)
The overall structure of ArcAN follows the signature CheY-like α/β fold architecture of regulatory domains shared by all RRs.43 The two molecules in the asymmetric unit form a symmetric dimer mediated by the α4-β5-α5 face of the protein (Fig. 1). In the crystal structures, ArcAN and ArcAN-BeF3− are almost identical, except for differences at the active site and the β4-α4 loop, with the two dimers having an rmsd of 0.553 Å for all Cα atoms (Fig. 2(a)).
Figure 1.
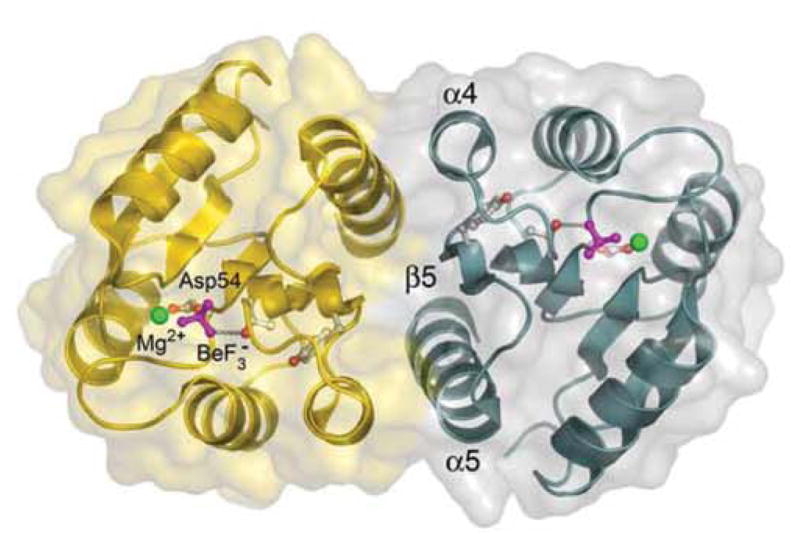
Ribbon diagram and surface representation of the BeF3−-activated regulatory domain of ArcA. The protomers that make up the dimer are shown in gold and teal. The two-fold rotationally symmetric dimer is mediated by the α4-β5-α5 face, which buries 850 Å2 of surface area at the interface. Side chains of Asp54 and Tyr100 (gray and red), BeF3− (magenta) and the catalytic Mg2+ ion (green) are shown as ball-and-stick models. Figures were created using Pymol (http://www.pymol.org/).
Figure 2.

(a) Superposition of the Cα backbone of ArcAN-BeF3− (teal) versus that of ArcAN (yellow). Circles identify the β4-α4 loops, which are found to be in different conformations in the two dimers. (b) Superposition of ArcAN-BeF3− versus MicAN, an OmpR/PhoB subfamily member from S. pneumoniae (red, PDB accession code 1NXW).49
Although crystals grown in the presence of BeF3− were obtained, we faced difficulties with successfully reproducing crystals of this form sufficiently large for data collection. To overcome this problem we soaked apo-ArcAN crystals in solutions containing BeF3−. Based on several factors, we consider both crystal structures to be mimicking the active dimer conformation of ArcAN. First, crystallization screens using protein solutions containing either inactive or BeF3−-activated ArcAN were set up in parallel and, in most cases, crystals of identical morphology grew with either sample. Preliminary X-ray diffraction analysis showed that crystals from both samples had the same unit cell parameters. Second, crystals soaked in BeF3− did not crack, as might be expected in the case of a domain undergoing structural changes upon activation. This suggested that no marked changes occurred in the overall conformation of the individual domains, and that the dimer interface observed between the two molecules present in the asymmetric unit was not disrupted upon addition of BeF3−. Finally, addition of BeF3− to the crystals improved resolution markedly and it appeared to stabilize the molecules as evident from a drop in mean B values for all atoms from 42 Å2 to 29 Å2. We attribute this active-like state to a combination of the high protein concentrations and chemical conditions used for crystallization from which a few nucleation events, driven by phase transition, could drive the equilibrium towards an active dimer conformation without the need for phosphorylation. In other words, the conditions required for crystal formation artificially created an active dimer conformation that would otherwise not be prevalent in solution under physiological conditions. Because we believe that both structures represent the active conformational state of the regulatory domain, the ArcAN-BeF3− structure will be used for subsequent discussions, unless indicated otherwise.
Coordination at the active site and differences in the two structures
ArcA is phosphorylated at Asp54, the residue that corresponds to the conserved phosphorylation site shared by the regulatory domains of RRs.39 In the crystal structure, the BeF3− is non-covalently bound to Asp54 centered within the active site (Fig. 3(a)). The BeF3− and Mg2+ ions are extensively coordinated to residues within the active site (Fig. 3(b)). In addition to binding Asp54, BeF3− also participates in a hydrogen bond and salt bridge with Thr81 and Lys103, respectively. Other atoms that further stabilize the BeF3− include the catalytic Mg2+ ion and the backbone nitrogens of Ile55, Asn56 and Gly82. The octahedrally coordinated Mg2+ ion binds to a fluorine of BeF3−, the side chain oxygens of Asp11 and Asp54, the carbonyl oxygen of Asn56 and two water molecules which are further stabilized by interactions with the side chain oxygens of Glu10, Asp11 and Glu12. Other signature residues involved in rearrangements associated with phosphorylation involve the movement of the conserved residues Ser/Thr and Phe/Tyr located in the β4-α4 loop and β5, respectively (Thr81 and Tyr100 in ArcA).2,44 In the ArcAN-BeF3− structure, Thr81 is oriented toward the active site to coordinate the BeF3− while Tyr100 adopts an inward position (Fig. 1) forming a hydrogen bond with the main chain carbonyl oxygen of Arg83 situated at the middle of the β4-α4 loop. Similar interactions have been reported for many structures of the activated regulatory domains, such as of Spo0A,45 FixJ46 and CheY.47,48
Figure 3.

Stereo views of the active site of ArcAN-BeF3−. (a) Close up view of the active site showing the Fo-Fc electron density for the BeF3− (magenta), Mg2+ (green) and two water molecules (red spheres). The Mg2+ ion is octahedrally coordinated to Asp54, Asn56, Asp11, BeF3− and the two water molecules. The difference density map was calculated with the occupancies of the BeF3−, Mg2+ and two water molecules set to zero and contoured at 3 σ. (b) Extended view of the active site. The BeF3− moiety, in addition to serving as a ligand for Mg2+, makes contacts with the side chain oxygen of Thr81, the Nζ of Lys103 and the backbone nitrogens of Gly82, Ile55 and Asn56. Tyr100 stabilizes the β4-α4 loop by forming a hydrogen bond with the carbonyl oxygen of Arg83. Three side chain atoms of Asn56 have been removed for clarity. Carbon, oxygen and nitrogen atoms from the protein chain are shown in gray, red and blue, respectively.
The area that differs most between the two structures is the β4-α4 loop, specifically residues Thr81, Gly82 and Arg83 (Fig. 2(a)). In the ArcAN structure Tyr100 is in an inward position, but Arg83 is too far away to make the hydrogen bond seen in the presence of BeF3−. When comparing ArcAN to ArcAN-BeF3− it is apparent that binding of BeF3− promotes movement of Thr81 and Gly82 into the active site to hydrogen bond to BeF3−. This in turn brings the backbone carbonyl oxygen of Arg83 to within hydrogen bond distance of the side chain hydroxyl group of Tyr100, further stabilizing the β4-α4 loop in a fixed conformation. In the absence of interactions with Tyr100 and BeF3− the β4-α4 loop appears to be very flexible as evident from the poor density for these residues in the ArcAN structure. Average B values for all atoms in residues Thr81, Gly82 and Arg83 in the ArcAN and ArcAN-BeF3− structures are 69 and 31 Å2, respectively, further indicating stabilization of the β4-α4 loop upon BeF3− binding.
Dimer interface
The asymmetric unit of the crystal is composed of a two-fold rotationally symmetric dimer mediated by the α4-β5-α5 face of the protein (Fig. 1). The total surface area buried at the dimer interface is 850 Å2. Analysis of the interface reveals the presence of a large number of intra- and intermolecular interactions involving hydrophobic and polar residues. The α4 helix of one monomer packs against the α5 helix of the other monomer through a hydrophobic patch formed between Ile90 (α4), Leu93 (α4), Ile112 (α5) and the aliphatic portions of side chains Lys89 (α4), Glu109 (α5) and Arg113 (α5) (Fig. 4(a)). The interface is further stabilized by a number of side chains involved in bifurcated salt bridges, creating an extensive network that surrounds the hydrophobic packing between the α4 and α5 helices, especially toward the center of the interface. The intermolecular salt bridges are formed between Lys89 (α4)-Glu109 (α5) at the top, Asp99 (β5)-Arg113 (α5) at the center, Glu94 (α4)-Arg115 (α5) at the outer sides and Asp98 (α4-β5 loop)-Arg120 (α5) at the bottom of the interface as depicted in Figure 4(b). Additionally, Lys89 (α4) is stabilized by an intramolecular salt bridge with Glu86 (α4). In the ArcAN structure, this interaction is disrupted at one of the Lys89 (α4) residues by a hydrogen bond to a nearby water molecule. Similarly, the guanidinium group of Arg120 (α4) is further stabilized by two hydrogen bonds to the carbonyl oxygen of Asn74 (α3-β4 loop). Another intermolecular polar interaction is seen at the bottom of the interface between the amide side chain nitrogen of Asn116 (α5) and the carbonyl oxygens of Leu93 (α4) and Ala97 (α4-β5 loop). These polar interactions are coupled to the Glu94 (α4)-Arg115 (α5) salt bridge by the amide side chain oxygen of Asn116 (α5) which interacts with the guanidinium group of Arg115 (α5). Because of the two-fold symmetric nature of the packing, each of these interactions mentioned above occurs twice, resulting in an extensively coordinated interface.
Figure 4.
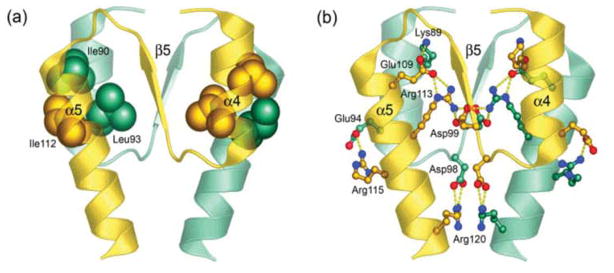
Intermolecular interactions at the α4-β5-α5 dimer interface. (a) The core of a hydrophobic patch (spheres) that brings helices α4 and α5 together is formed between Ile90 (α4), Leu93 (α4) and Ile112 (α5). (b) The interface is further stabilized by an extensive network of salt bridges (ball-and-stick models, yellow dotted lines) formed between Lys89 (α4)-Glu109 (α5), Asp99 (β5)-Arg113 (α5), Glu94 (α4)-Arg115 (α5) and Asp98 (α4-β5 loop)-Arg120 (α5). Protomers are distinguished by colors gold and teal.
The structure of ArcAN is strikingly similar to that of the regulatory domain of MicA (RR02), an OmpR/PhoB subfamily RR from Streptococcus pneumoniae, recently reported by Bent et al.49 In the unphosphorylated apo-structure, they found an extensive dimer interface created by a two-fold crystallographic axis and suggested that it represented of the active dimer conformation. The ArcAN and MicAN dimers superimpose very well with an rmsd of 1.265 Å for all Cα atoms (Fig. 2(b)). The interface of MicAN contains analogous interactions found in ArcAN such as the intermolecular salt bridges formed by Asp99-Arg113 and Asp98-Arg120, the intramolecular pairing between Glu109 and the Asp99-Arg113 salt bridge, as well as the hydrophobic patch. However, the other salt bridges seen in ArcAN between Lys89-Glu109 and Glu94-Arg115 do not occur between the analogous residues of MicAN. This is not surprising giving the fact that these intermolecular salt bridges, unlike the other interactions in the interface, occur at the periphery of the protein making these residues prone to interact with symmetry related molecules formed by crystal packing or susceptible to solvation. In fact, the analogous residues of the Glu94-Arg115 salt bridge are involved in lattice contacts in MicAN, while a water molecule is found bridging the interaction between the analogous residues of the Lys89-Glu109 salt bridge. In addition to the structure of ArcAN reported here, X-ray structures have been determined for the activated regulatory domains of E. coli PhoB, PhoP, TorR, KdpE, and T. maritima DrrB and DrrD, all members of the OmpR/PhoB subfamily (manuscripts in preparation). In all cases, the regulatory domains exist as dimers with the interface mediated by the α4-β5-α5 face suggesting a common dimerization mechanism upon activation.
The recurrence of this dimer interface reflects similar primary structure within the OmpR/PhoB subfamily. A multiple sequence alignment of the regulatory domains of all members of this subfamily from E. coli,20 in addition to subfamily members from other organisms for which structures of the regulatory domain are available,33,34,49,50 revealed that the residues involved in key dimer interface interactions are highly conserved within this subfamily (Fig. 5). Moreover, an alignment of the α4-β5-α5 sequences from members of other subfamilies of RR transcription factors from E. coli revealed a lack of similarity with the α4-β5-α5 sequences of the OmpR/PhoB subfamily (data not shown). These sequence analyses of E. coli RRs provide evidence for a subfamily-specific common mechanism of dimerization that appears to be unique to members of the OmpR/PhoB subfamily.
Figure 5.

Sequence alignment of the α4-β5-α5 face of members from the OmpR/PhoB subfamily from E. coli and other organisms for which structures of the regulatory domain are available. Sequence numbering is for ArcA. Abbreviations are as follow: E.c., E. coli; T.m., T. maritima; S.p., S. pneumoniae; B.s., Bacillus subtilis. Residues mediating the dimer interface of ArcAN-BeF3− are highly conserved in this subfamily. Residues involved in formation of the hydrophobic patch and the intermolecular salt bridges are highlighted in blue and gold, respectively. A red highlight represents residue pairs that are not conserved but could complement each other at the interface. The alignment was performed using sequence data corresponding to the complete regulatory domains. Members used for the alignment are E. coli ArcA (sp: P03026), TorR (sp: P38684), KdpE (sp: P21866), PhoB (sp: P08402), PhoP (sp: P23836), OmpR (sp: P03025), CpxR (sp: P16244), RstA (gb: AAC74680), BasR (sp: P30843), QseB (gb: AAC76061), CusR (gb: AAC73672), PcoR (sp: Q47456), YedW (gb: AAC75035), BaeR (sp: P30846), and CreB (sp: P08368); T. maritima DrrD (gb: AAD35484) and DrrB (gb: AAD35220); S. pneumoniae MicA (emb: CAB54568); B. subtilis PhoP (sp: P13792). Accession numbers are from GenBank (gb), Swiss-Prot (sp), NCBI Reference Sequence (ref) and EMBL Data Library (emb). Members for which a structure is available are E. coli PhoB (PDB accession code 1B00),64 T. maritima DrrD and DrrB (1KGS and 1P2F, respectively),33,34 S. pneumoniae MicA (1NXW),49 and B. subtilis PhoP (1MVO).50
ArcA phosphorylation and oligomerization analyzed by liquid chromatography
Members of the OmpR/PhoB subfamily are known to form dimers or oligomers upon activation or DNA binding. It has been reported that full-length ArcA exists as a dimer in solution in its inactive state and forms an octamer upon phosphorylation, with a 1:1 ratio of unphosphorylated to phosphorylated protein.51 We have further examined the behavior of ArcA in solution by analyzing the contributions of the individual domains to oligomerization. First, we examined the phosphorylation state of ArcA and ArcAN in the presence of the small molecule phosphodonor phosphoramidate52 by using reverse-phase high performance liquid chromatography (HPLC) to separate the unphosphorylated and phosphorylated proteins. Figures 6(a) and (b) show the HPLC profiles of ArcA and ArcAN, respectively. In both cases, most of the protein in the sample is phosphorylated in the presence of phosphoramidate with a small percentage of ArcA (11%) remaining unphosphorylated, suggesting that ArcA and ArcAN can be fully phosphorylated in vitro. This contrasts with the 1:1 ratio of unphosphorylated and phosphorylated ArcA reported previously. ArcA and ArcAN were subjected to analytical size-exclusion chromatography in the presence and absence of phosphoramidate to detect changes in their oligomerization states resulting from phosphorylation (Fig. 6(c) and (d), respectively). The analyses show that both ArcA and ArcAN change their oligomeric states as a result of phosphorylation, migrating with earlier retention times suggestive of either a monomer to dimer or dimer to tetramer transition. The results also suggest that the phosphorylated regulatory domain alone is sufficient to promote dimerization.
Figure 6.
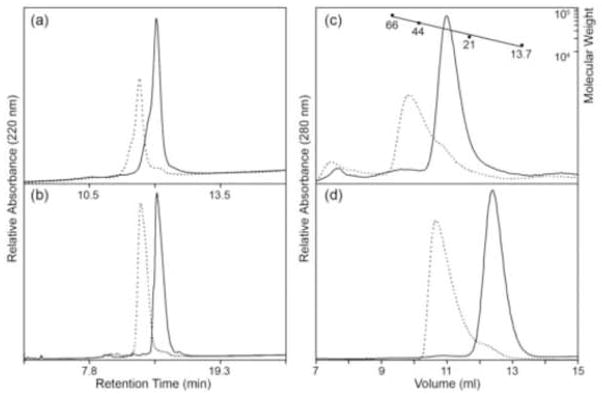
Analysis of ArcA phosphorylation and oligomerization. Unphosphorylated and phosphorylated proteins are represented by solid and dotted lines, respectively. Phosphoramidate was used as a small molecule phosphodonor. (a and b) Reverse-phase HPLC analysis of the phosphorylation of ArcA (a) and ArcAN (b) at loading concentrations of 128.7 μM and 3.7 μM, respectively. The ability of ArcA and ArcAN to completely phosphorylate in vitro was evident from the observed shifts in migration in the presence of phosphodonor. (c and d) Analytical size-exclusion chromatography of unphosphorylated and phosphorylated ArcA (c) and ArcAN (d). Earlier retention times of the phosphorylated species are consistent with either a monomer to dimer or dimer to tetramer transition. The following molecular weight standards were used for calibration (c) of the size-exclusion column as described in the Materials and Methods: albumin (66 KDa), ovalbumin (44 KDa), trypsin inhibitor (21 KDa), and RNAse A (13.7 KDa). Loading concentrations of 2.2 μM and 128.7 μM were used for ArcA and ArcAN, respectively.
Analytical ultracentrifugation analysis of ArcA, ArcAN and ArcAC
ArcAN was analyzed by both sedimentation velocity (SV) and sedimentation equilibrium (SE) at concentrations ranging from 36 to 143 μM. Continuous sedimentation (c(s)) distributions of ArcAN show a single feature at a sedimentation coefficient of ~1.7 S (Fig. 7(a)). Furthermore, there is no change in the position of this peak as a function of concentration, suggesting that the 1.7 S species does not exist in a reversible equilibrium with a higher order species. In addition to SV analysis, ArcAN was also analyzed by SE at concentrations of 36, 71 and 143 μM (Fig. 7(a), inset). ArcAN was spun at 27 and 33 K rpm resulting in a total of six data sets that were simultaneously fit to a single species model using the program NONLIN.53 The quality of the fit was good with an rmsd value of 5.9577E-3 and a converged molecular weight value of 13,541 [12,996, 14,072] which agrees well with the theoretical value of 13,989 g/mol (bracketed values represent 95% confidence intervals).
Figure 7.

Continuous sedimentation coefficient (c(s)) distributions and sedimentation equilibrium (SE) profiles of ArcAN, ArcAC, and ArcA. (a) c(s) distributions of ArcAN run at loading concentrations of 36 μM (solid), 71 μM (dashed), 143 μM (dotted) collected using an interference optical system. The c(s) distributions were generated as described in the Methods section. The inset shows the SE distributions, collected using absorbance optics (280 nm), for the 36 μM concentration spun at 27 K (circles) and 33 K (triangles) rpm and the residual plots of the fits to a single species model. (b) c(s) distributions for ArcA at 18 μM (solid), 37 μM (dashed), and 73 μM (dotted) collected using interference optics. The inset shows the SE profiles for the 9 μM concentration spun at 27 K (circles) and 33 K (triangles) rpm and the residual plot of the fits to a monomer-dimer model. (c) ArcAC c(s) distributions run at loading concentrations of 20 μM (solid), 41 μM (dashed), and 81 μM (dotted) collected using absorbance optics. (d) ArcAN-P c(s) distributions for ArcAN-P at 36 μM (solid), 71 μM (dashed), and 143 μM (dotted) collected using absorbance optics. The buffer for the SV experiments was 25 mM Tris-Cl, 100 mM NaCl, 1 mM DTT and 1 mM EDTA, pH 7.5 while for the SE experiments it was 25 mM Tris-Cl, 100 mM NaCl and 1 mM DTT, pH 7.5. All sedimentation coefficients have been corrected to the density and viscosity of water at 20 °C.
Full-length ArcA was also analyzed by SV and SE at concentrations ranging from 9 to 73 μM (Fig. 7(b)). In contrast to ArcAN, which shows a single feature on the c(s) distribution that does not vary with concentration, ArcA shows larger features that appear with increasing concentration. This suggests that the ArcA monomer exists in a reversible equilibrium with a higher order structure. These larger features only become apparent at loading concentrations above 20 μM suggesting that the Kd is greater than 20 μM. Because SV does not give a definitive answer to the oligomeric state of ArcA, SE analysis was also conducted at concentrations ranging from 9 to 37 μM. Three different concentrations were run at three different speeds, with the nine data sets fitting well to a monomer–dimer model with a Kd of 435 [297, 657] μM.
ArcAC was then subjected to SV at loading concentrations ranging from 20 to 80 μM. As can be seen from Figure 7(c) the c(s) distributions of ArcAC are quite broad, ranging from ~2 S to ~6 S, indicating the presence of multiple species. The concentration dependence of the c(s) profiles suggest that these species are in reversible equilibrium with each other and that irreversible aggregation is not occurring. Given an ArcAC molecular weight of 12,566 g/mol the largest sedimentation coefficient that an ArcAC monomer can have, that of a perfect sphere, is ~2.0 S. The corresponding values for dimer, tetramer and octamer are ~3.1, ~5.0 and ~7.9 S, respectively. It is clear from Figure 7(c) that even at loading concentrations as low as 20 μM there are features above the maximum S value for a monomer and a dimer, and that at higher concentrations there are features greater than a tetramer. These data suggest that at high concentrations ArcAC can exist at least as a tetramer of monomers.
Since there is a great deal of evidence that phosphorylation of the regulatory domain alters the oligomeric state of many RRs, both ArcA and ArcAN were activated with phosphoramidate and subjected to SV analysis. The half-life of phosphorylation of ArcA is short but can be significantly increased by the removal of divalent cations.51 Specifically, HPLC analysis of phosphorylated ArcAN (ArcAN-P) treated with 50 mM ethylene diamine tetraacetic acid (EDTA) subsequent to phosphorylation indicated >95% phosphorylation after 24 h (unpublished data), longer than the 12 h required for SV analysis. Figure 7(d) shows a c(s) distribution of ArcAN-P at concentrations ranging from 36 to 143 μM. As in the case of ArcA and ArcAC there is a shift in the position of the peaks as a function of concentration, suggesting the existence of a reversible equilibrium. Surprisingly, however, the distribution extends to S values greater than a dimer. The SE profiles are complex and cannot be modeled by a simple monomer-dimer-tetramer equilibrium. Phosphorylated ArcA was also subjected to SV analysis, but no conclusive results were obtained. Significant precipitation occurred during the run precluding conclusive interpretation of the results.
DISCUSSION
ArcA oligomerization and functional implications
Modulation of the phosphorylated state of ArcA by ArcB during transition from aerobic to anaerobic growth regulates the activation of genes needed for respiration during anaerobiosis and the repression of genes encoding elements of aerobic metabolism. Previous studies using electrophoretic mobility shift and DNAse I protection assays have shown that phosphorylation of ArcA is required for specific binding to target sites, that broad regions of DNA are protected by ArcA-P suggesting formation of multimers and that this multimerization can occur independently of DNA binding.51,54,55
Solution studies, both size-exclusion chromatography and sedimentation, indicate that the isolated regulatory domain of ArcA exits exclusively as a monomer. Yet ArcAN crystallizes as a dimer in both the absence and presence of BeF3−. As described earlier, the two structures of ArcAN are almost identical to each other and in both of them the residues that have been previously identified to participate in the activation switch assume conformations that have been associated with the activated state of RRs. Thus both crystal structures reflect the active state of ArcAN. It has been shown that some RRs, such as CheY56,57 and the regulatory domain of NtrC,58 exist in conformational equilibrium between inactive and active states even in the absence of phosphorylation. If this conformational equilibrium exists in ArcA as well then it is possible that the combination of high concentrations, the removal of the C-terminal DNA-binding domain and the conditions required for the formation of crystals might trap the molecules in an active state in the absence of phosphorylation or phosphoryl analogs.
The oligomerization of ArcA that we observe differs at least quantitatively from that reported previously.51 Based on gel-filtration and glycerol gradient sedimentation analyses, Jeon et al. concluded that unphosphorylated ArcA exists as a dimer and active ArcA exists as an octamer. Our SE and SV results also indicate that unphosphorylated ArcA exists as a dimer, but in equilibrium with a monomer with a Kd ~400 μM. Given this low affinity, the monomeric form of ArcA would be expected to predominate at the concentrations examined by Jeon et al. It is possible that the presence of 10% glycerol in Jeon’s experiments promoted dimerization.
The DNA-binding domain of ArcA also participates in oligomerization. While unphosphorylated ArcAN exists as a monomer in solution, intact ArcA has some propensity for dimerization. The observation that the DNA-binding domain associates into oligomers greater than tetramers suggests that dimerization of full-length ArcA may at least in part be mediated by the DNA-binding domain and that the unphosphorylated regulatory domain may inhibit higher order oligomerization. Both size-exclusion chromatography and sedimentation data indicate that phosphorylation promotes formation of large oligomers. Aggregation of phosphorylated intact ArcA has precluded sedimentation analysis of its oligomerization state. While in vitro studies suggest that oligomerization is likely to play an important role in transcriptional regulation by ArcA, the details of ArcA associations in vivo are likely to be at least quantitatively different and substantially influenced by intracellular conditions, localization, and the presence of DNA and other protein components of transcription complexes.
The α4-β5-α5 face
The α4-β5-α5 face of the regulatory domain of RRs is the region of greatest phosphorylation-induced conformational perturbation. It is not surprising therefore that many RRs utilize the α4-β5-α5 face for regulatory protein-protein interactions, the affinities of which are altered by phosphorylation. These interactions form the basis for a variety of different inter- and intramolecular regulatory mechanisms such as the binding of CheY-P to FliM59 and CheZ,60 the formation of homodimers of phosphorylated FixJ,46 the alternation between different dimeric states in DctD,61,62 and the inhibitory contacts between the unphosphorylated regulatory and effector domains of NarL27 and CheB.28
An analysis of residue conservation at the α4-β5-α5 face of the three major subfamilies of RR transcription factors (OmpR/PhoB, NarL/FixJ, and NtrC/DctD) revealed important differences that distinguish the OmpR/PhoB subfamily from the others. The Consurf Server63 (http://consurf.tau.ac.il) was used to map the conservation of residues identified in a multiple sequence alignment of members of each subfamily onto the three-dimensional structure of one of its representative members in an activated state (Fig. 8). The analysis shows that the α4-β5-α5 face is highly conserved in the OmpR/PhoB subfamily whereas it is not in the NarL/FixJ and NtrC/DctD subfamilies. The side chains of these conserved residues are exposed, making them available for intermolecular interactions as are observed in the active structures of ArcAN. The other face of these proteins, the α1-β2-α2 face, is not conserved in any of the three subfamilies. Residues at the variable α1-β2-α2 face in the OmpR/PhoB subfamily, as well as other nonconserved residues in the regulatory domain, might be involved in other protein-protein interactions specific to individual subfamily members. Such interactions might include, for example, the formation of active higher order oligomers, or the formation of alternate inactive dimer interfaces as seen in E. coli PhoB64 and B. subtilis PhoP.50
Figure 8.
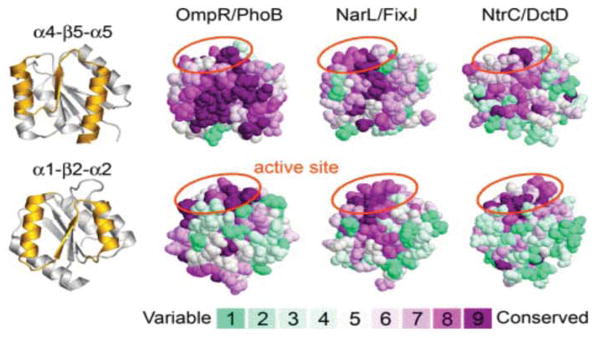
Consurf63 (http://consurf.tau.ac.il) analysis of the conservation of surface residues of the regulatory domain for members of the three major subfamilies of RR transcription factors (OmpR/PhoB, NarL/FixJ, and NtrC/DctD). Results from ClustalW multiple sequence alignments were used to map the conservation of residues, using the Consurf maximum likelihood method for calculating conservation scores, onto the structures of ArcAN-BeF3−, Sinorhizobium meliloti FixJN-P (PDB accession code 1D5W)46 and S. enterica NtrCN-P (1DC7)82 as model members of the OmpR/PhoB, NarL/FixJ and NtrC/DctD subfamilies, respectively. Ribbon diagrams of ArcAN at the far left represent the face of the protein that is shown (gold) for each model. The coloring scheme for conservation ranges from cyan (variable) to dark red (conserved). The results show a highly conserved α4-β5-α5 face for members of the OmpR/PhoB subfamily, in contrast to the other two subfamilies, consistent with a common mechanism of dimerization upon activation. Aside from the active site, marked by orange ellipses, the α1-β2-α2 face is not conserved in any of the three subfamilies. Members of the OmpR/PhoB subfamily used for the sequence alignment are E. coli ArcA (sp: P03026), PhoP (sp: P23836), PhoB (sp: P08402), TorR (sp: P38684), KdpE (sp: P21866), CpxR (sp: P16244), OmpR (sp: P03025), BaeR (sp: P30846), RstA (gb: AAC74680), CusR (gb: AAC73672), BasR (sp: P30843), CreB (sp: P08368), YedW (gb: AAC75035) and QseB (gb: AAC76061); T. maritima DrrB (gb: AAD35220) and DrrD (gb: AAD35484); S. pneumoniae MicA (emb: CAB54568); Shewanella oneidensis YgiX (ref: NP_717707); Staphylococcus epidermidis SrrA (ref: NP_764731); B. subtilis PhoP (sp: P13792). Members of the NarL/FixJ subfamily are E. coli NarL (emb: CAA33023), FimZ (emb: CAA35973), UvrY (gb: AAC74981), RcsB (gb: AAC75277), EvgA (ref: NP_416870), NarP (gb: AAA16411) and UhpA (gb: AAC76692); S. meliloti FixJ (ref: NP_435915); Agrobacterium tumefaciens TraR (ref: NP_059701); Bacillus licheniformis ComA (gb: AAU24816); Listeria monocytogenes DegU (gb: AAT74538); Bordetella bronchiseptica NodW (ref: NP_887648). Members of the NtrC/DctD subfamily are E. coli AtoC (gb: AAC75280), YfhA (gb: AAC75607) and HydG (gb: AAC76978); S. enterica NtrC (gb: AAV79614); Rhodopirellula baltica SasR (ref: NP_869833); Brucella suis NtrC (gb: AAN30037); Xanthomonas axonopodis NtrC (ref: NP_644040); Helicobacter hepaticus FlgR (ref: NP_861166); Burkholderia pseudomallei DctD (emb: CAH37507); A. tumefaciens NtrC (ref: NP_532136). Accession numbers are from GenBank (gb), Swiss-Prot (sp), NCBI Reference Sequence (ref) and EMBL Data Library (emb).
A common mechanism of regulation by dimerization
A notable feature of the OmpR/PhoB subfamily of winged-helix transcription factors is that the majority of the members that have been experimentally characterized have been shown to bind in tandem to DNA direct repeat half-sites.24–26 Other RR transcription factors, such as members of the NarL/FixJ subfamily, bind to DNA in a variety of arrangements including inverted repeats with two-fold dyad symmetry.65 In E. coli, the OmpR/PhoB subfamily consists of 15 of the 34 RRs encoded by the genome,20,21 representing 45% of the total. In the OmpR/PhoB subfamily, the α4-β5-α5 face of the receiver domain, used in dimer formation upon activation, shows a high degree of conservation not seen in any of the other subfamilies (see previous section). Moreover, this conservation comes from residues involved in the formation of important intermolecular contacts. Interestingly, in the NtrC/DctD subfamily, which lacks conservation in the α4-β5-α5 face, different members have been shown to use distinctly different surfaces of the regulatory domain for multimerization.61 Another notable feature of the OmpR/PhoB subfamily is that in the inactive state the DNA recognition helix of the effector domain is freely exposed to the solvent33,34 making it readily available for DNA binding in contrast to other RRs in which the functional regions of the effector domains are occluded by the unphosphorylated regulatory domains.27,28 Taking into account these marked differences, it is hypothesized that members of the OmpR/PhoB subfamily use a common mechanism of regulation by dimerization.
It is important to note that the rotationally symmetric orientation of the ArcAN active dimer is different than the expected head to tail orientation adopted by the C-terminal effector domains bound to direct repeat DNA recognition sites. Furthermore, the α4-β5-α5 face involved in the active dimer interface is the same surface that forms the regulatory–effector domain interface in inactive DrrB.34 If the structure of DrrB is representative of OmpR/PhoB subfamily members, then the tight domain interface mediated by the α4-β5-α5 face of the regulatory domain must be disrupted upon phosphorylation to allow for the separation of the two domains tethered by a flexible linker. This would leave the α4-β5-α5 face of the regulatory domain available for formation of an active symmetric dimer and the effector domain free to bind DNA with a different symmetry. Additionally, the formation of the α4-β5-α5 dimer interface juxtaposes the linkers of the RRs on the same plane, as opposed to the dimers formed in inactive E. coli PhoB64 and B. subtilis PhoP,50 facilitating association of the effector domains into dimers for DNA binding. While this model is compatible with tandem binding to direct repeats, it does not exclude the possibility of other binding modes such as symmetric binding to inverted repeats as has been postulated for some OmpR/PhoB subfamily members.66 If the regulatory domain exerts no constrains on the orientation of the effector domains then their positioning will be determined by the arrangement of DNA recognition sequences and/or the specificity of protein-protein interactions at the interface of effector domain dimers.
MATERIALS AND METHODS
Cloning, expression and purification of ArcA
The gene encoding ArcA was amplified from E. coli DH5α genomic DNA using the polymerase chain reaction (PCR) and subsequently inserted into the pT7 vector pJES30767 at the NdeI and BamHI restriction sites to create pEF23. Plasmid pEF23 was then transformed into E. coli strain BL21(DE3) (Novagen). Cells were grown at 37 °C in Luria-Bertani medium supplemented with ampicillin at a final concentration of 100 μg/ml. After reaching mid-log phase, induction of ArcA expression was achieved by addition of 0.5 mM isopropyl-β-D-thiogalactopyranoside (IPTG) followed by incubation for an additional 3–5 h. All subsequent steps were carried out at 4 °C. Cells were harvested by centrifugation for 20 min at 4,000 × g, washed with 50 mM Tris-Cl, 300 mM NaCl, 1 mM dithiothreitol (DTT), 1 mM EDTA and 1 mM phenylmethylsulfonyl fluoride, pH 8.0, and lysed by sonication in the same buffer. The lysate was clarified by ultracentrifugation for 60 min at 80,000 × g. The soluble portion was retained and a saturated solution of (NH4)2SO4 was added to 55% saturation. The (NH4)2SO4 pellet was resuspended and dialyzed overnight in 20 mM Tris-Cl, 200 mM NaCl and 2 mM β-mercaptoethanol (βME), pH 7.5 (buffer A). The dialyzed ArcA sample was loaded onto two tandem 5-ml HiTrap Blue dye affinity columns (Amersham Biosciences) and eluted with a 100-ml gradient of 0 to 2.0 M NaCl in buffer A. Fractions containing ArcA were pooled and a saturated (NH4)2SO4 solution was slowly added to the solution to ~45% saturation. The sample was then filtered through a 0.45-μm filter and loaded onto a HiLoad phenyl Sepharose 16/10 column (Amersham Biosciences) equilibrated in 20 mM Tris-Cl, 1.0 M (NH4)2SO4 and 2 mM βME, pH 7.8 (buffer B). ArcA was eluted with a 300-ml gradient of 1.0 to 0 M (NH4)2SO4 in buffer B. Fractions containing ArcA were pooled, precipitated with a saturated solution of (NH4)2SO4 to 60% saturation, resuspended in 25 mM Tris-Cl, 100 mM NaCl and 1 mM DTT, pH 7.5 (buffer C) and finally subjected to gel filtration chromatography using a Superdex75 26/60 column (Amersham Biosciences) equilibrated in buffer C.
Cloning, expression and purification of ArcAN
ArcAN, encompassing residues 1–123 (N123Q), was PCR-amplified and subcloned from pEF23 into pJES307 at the NdeI and BamHI restriction sites to create pEF29. Plasmid pEF29 was transformed into E. coli BL21(DE3). Cells were grown and lysed as described above for ArcA except that after induction with IPTG the cells were incubated overnight at 20 °C. The soluble portion of the lysate was precipitated with a saturated solution of (NH4)2SO4 to 30% saturation. The (NH4)2SO4 pellet was resuspended and dialyzed overnight in 25 mM Tris-Cl, 200 mM NaCl and 2 mM βME, pH 8.0 (buffer D). The dialyzed protein sample was loaded onto two tandem 5-ml HiTrap Q Sepharose anion exchange columns (Amersham Biosciences) and eluted with a 150-ml gradient of 0 to 0.35 M NaCl in buffer D. Fractions containing ArcAN were pooled and a saturated solution of (NH4)2SO4 was added until ~20% saturation. The sample was then loaded onto a HiLoad phenyl Sepharose 16/10 column equilibrated in 20 mM potassium phosphate, 0.8 M (NH4)2SO4 and 2 mM βME, pH 7.0 (buffer E). ArcAN was eluted with a 200-ml gradient of 0.8 to 0 M (NH4)2SO4 in buffer E. Fractions containing ArcAN were pooled, precipitated with a saturated solution of (NH4)2SO4 to 40% saturation, resuspended in buffer C and finally chromatographed on a Superdex75 26/60 column equilibrated in buffer C.
For preparation of selenomethionine-derivatized ArcAN (SeMet ArcAN) plasmid pEF29 was transformed into the methionine auxotroph strain B834(DE3)-pLysS (Novagen). The protocol for cell growth was adapted from Hendrickson et al.68 as described elsewhere69 with the exception that after induction with 0.5 mM IPTG cells were incubated overnight at 20 °C. SeMet ArcAN was subsequently isolated and purified following the procedure for the wild-type protein except for the inclusion of 10 mM βME in all solutions.
Cloning, expression and purification of ArcAC
The effector domain of ArcA, residues 132–238 (R132Q), was PCR-amplified and subcloned from pEF23 into pJES307 at the NdeI and BamHI restriction sites to create pEF34. Plasmid pEF34 was transformed into E. coli BL21(DE3). Cells were grown and lysed as described above for ArcA followed by fractionation with a saturated solution of (NH4)2SO4 to 60% saturation. The (NH4)2SO4 pellet was resuspended and dialyzed overnight in 25 mM Tris-Cl and 2 mM βME, pH 8.0 (buffer F). The dialyzed protein sample was loaded onto two tandem 5-ml HiTrap Blue columns and eluted with a 200-ml gradient of 0 to 1.3 M NaCl in buffer F. Fractions containing ArcAC were pooled and concentrated and chromatographed on a Superdex75 26/60 column equilibrated in buffer C.
Analytical gel filtration and HPLC
Size exclusion chromatography was performed on a fast performance liquid chromatography AKTA system (Amersham Biosciences) using a Superdex75 10/30 column. Experiments were carried out at 4 °C at a flow rate of 0.5 ml/min using 25 mM Tris-Cl, 100 mM NaCl and 1 mM DTT, pH 7.5 as the mobile phase while monitoring absorbance at 280 nm. Each analysis was performed with a 200-μl aliquot. ArcAN samples were prepared by incubating 360 μg of protein in mobile phase buffer for 25 min at room temperature in the presence or absence of 50 mM ammonium hydrogen phosphoramidate,52,70 and 10 mM MgCl2. Prior to injection, samples were filtered through 0.22-μm filters. Limited solubility of phosphorylated ArcA has been reported before55 and this restricted its useful concentration limit to 0.1 mg/ml. Samples containing 12 μg of ArcA in the presence and absence of phosphoramidate and MgCl2 were prepared as described above for ArcAN.
Reverse-phase HPLC analysis was carried out using a Hitachi-7000 Series instrument and a 214TP5415 C-4 column (Grace-Vydac). Eluent A contained 0.1% trifluoroacetic acid and 99.9% H2O; eluent B contained 0.1% trifluoroacetic acid and 99.9% acetonitrile. ArcA (10 μg) and ArcAN (180 μg) samples in the presence and absence of phosphoramidate were prepared as described above, using the same buffer, in a volume of 100 μl. Chromatography was performed at room temperature with a 40-ml gradient from 35 to 65% of eluent B at a flow rate of 1.0 ml/min. Injected sample volumes for ArcA and ArcAN were 80 and 40 μl, respectively.
Analytical ultracentrifugation
Sedimentation velocity (SV) and sedimentation equilibrium (SE) experiments were carried out in a Beckman XL-I analytical ultracentrifuge utilizing both interference and absorbance optical systems. The SV experiments were conducted in epon charcoal-filled double sector centerpieces with quartz or sapphire windows (quartz for absorbance collection and sapphire for interference collection) while the SE experiments were done in epon charcoal-filled 6-channel centerpieces with quartz windows. All experiments were done at 4 °C in 25 mM Tris-Cl, 100 mM NaCl and 1 mM DTT, pH 7.5 either with or without 1 mM EDTA (Fig. 7 legend). The buffer density and viscosity, as well as the partial specific volumes for each of the proteins analyzed were determined using the software SEDNTERP.71 The density and viscosity for the buffer containing 1 mM EDTA are 1.00503 g/ml and 1.5946E-2 poise, respectively, while the density and viscosity of the EDTA free buffer are 1.00485 g/ml and 1.5928E-2 poise, respectively. The partial specific volume at 4 °C for ArcA is 0.7273 ml/g, for ArcAN is 0.7348 ml/g and for ArcAC is 0.7203 ml/g. Analysis of the SV data was accomplished using the program SEDFIT72 which allowed for the generation of c(s) distributions. Fixing the frictional ratio at 1.2 and floating the meniscus position generated c(s) distributions. The resolution setting for the continuous distributions is 200 and the regularization setting is 0.9. For the SE experiments the data were analyzed using the program WinNonLin.53
Crystallization of ArcAN
Prior to use, ArcAN was dialyzed into 50 mM Tris-Cl, pH 8.4, with the addition of 10 mM βME in the case of the SeMet-derivatized protein. After dialysis the protein was concentrated at 4 °C with a Biomax-10 concentrator to about 20–35 mg/ml as determined by absorbance at 280 nm. For BeF3− activation the concentrated protein sample was mixed with 5.3 mM BeCl2, 33 mM NaF and 6.7 mM MgCl2 in a total volume of 200 μl.40,59 Crystals were grown at 4 °C by the hanging drop vapor diffusion method by mixing equal amounts of protein sample and reservoir solution. Native and SeMet-derivatized protein crystals were grown side by side under the same conditions. Identical crystals of ArcAN and BeF3−-activated ArcAN, with the same unit cell parameters, grew in 0.2 M ammonium acetate, 0.1 M tri-sodium citrate dihydrate (pH 5.5) and 15% v/v 2-methyl-2,4-pentanediol. Crystals were difficult to reproduce using protein from different preparations and for data collection the inactive SeMet-derivatized crystals were soaked for ~9 h in a fresh solution of reservoir solution containing BeF3− in which the citrate buffer was substituted with sodium acetate trihydrate (pH 5.5). Inactive crystals remained stable after transferring them to the BeF3−-containing solutions, even improving resolution. Crystals were cryoprotected by increasing the 2-methyl-2,4-pentanediol concentration to 20% and transferring them to a 100 K nitrogen stream. Native and multiwavelength anomalous dispersion datasets were collected with crystals grown in the absence of BeF3−. A non-anomalous dataset was collected using a SeMet-derivatized ArcAN crystal soaked in BeF3−. Crystals belonged to space group P6522 with average cell constants of a = b = 87.0 Å, and c = 214.0 Å containing 2 molecules per asymmetric unit and an average solvent content of 70%. Data were collected at beamline X4A at the National Synchrotron Light Source at Brookhaven National Laboratory, Upton, N.Y. All data were processed and scaled with DENZO and SCALEPACK.73
Structure determination and refinement
The structure of ArcAN was solved by the single-wavelength anomalous dispersion technique using the program CNS 1.1.74 Eight out of ten possible selenium atom sites for the two molecules in the asymmetric unit were found. Initial phase estimates to 2.5 Å resolution in the form of Hendrickson-Lattman coefficients from CNS in addition to amplitudes from the native data set were input into DM75 from the CCP4 4.2.2 program suite76 and density modification was performed using solvent flattening, histogram matching and two-fold NCS with matrices derived from the heavy atom sites. The resulting electron density map was of excellent quality and permitted almost a complete model to be manually traced using XtalView.77 Multiple rounds of model building and restrained refinement were performed against the native data set with Refmac 5.1.2478 using the maximum likelihood target function. Tight NCS restraints were used at the initial stages of refinement and were gradually released until convergence. Waters were initially placed using the ARP_WATERS79 routine integrated in Refmac and later added or removed by manual inspection. Electron density for residues Met1-A, Met1-B and Gln123-A was not observed, as well as for side chains of residues Gln2-A, Glu45-A and Arg83-B.
The structure of ArcAN-BeF3− was solved by molecular replacement with Phaser 1.280 using a poly-alanine model of ArcAN lacking the β4-α4 and β5-α5 loops. After rigid body refinement in Refmac, initial iterative cycles of density modification and refinement (solvent flattening, histogram matching and two-fold NCS averaging) were performed automatically to a resolution of 2.15 Å with Refmac and DM as implemented in NCSref from CCP4. The resulting averaged map was of excellent quality, showing clear density for the BeF3− and Mg2+ atoms at the active site, and permitted easy manual reconstruction of the side chains and loops that were removed from the starting model. Iterative rounds of model building and refinement in XtalView and Refmac were performed until convergence. NCS restraints were treated and water molecules were added as in ArcAN. Electron density for residues Met1-A, Gln123-A and Gln123-B was not observed, as well as for side chains of residues Gln2-A, Met1-B and Glu71-B.
Both structures have good stereochemistry and show no residues in disallowed regions of the Ramachandran plot as defined by PROCHECK.81 Statistics of structure determination and refinement are shown in Table 1.
Protein Data Bank accession codes
The coordinates and structure factors of ArcAN and ArcAN-BeF3− have been deposited in the Protein Data Bank with ID codes 1XHE and 1XHF respectively.
Acknowledgments
We thank E. Fox and T. Wu for technical assistance with preparation of expression vectors and proteins; the staff at beamline X4A at the National Synchrotron Light Source at Brookhaven National Laboratory for technical assistance, Dr. J. Cole for his advice on analytical ultracentrifugation and for critically reviewing the manuscript, and Drs. V. Robinson and B. Benoff for valuable discussions. This work was supported by grant R37GM047958 from the National Institutes of Health. T.R.M. was supported by NIH grants T32GM08360 and T32GM08319. A.T.R. was supported by NIH grants T32GM08319 and 5F31GM070142 (NRSA-MARC). A.M.S. is an investigator of the Howard Hughes Medical Institute.
Abbreviations used
- TCS
two-component system
- RR
response regulator
- HK
histidine kinase
- ArcAN
ArcA regulatory domain
- ArcAC
ArcA effector domain
- NCS
non-crystallographic symmetry
- HPLC
high performance liquid chromatography
- SV
sedimentation velocity
- SE
sedimentation equilibrium
- PCR
polymerase chain reaction
- IPTG
isopropyl-β-D-thiogalactopyranoside
- EDTA
ethylene diamine tetraacetic acid
- βME
β-mercaptoethanol
- DTT
dithiothreitol
References
- 1.Stock AM, Robinson VL, Goudreau PN. Two-component signal transduction. Annu Rev Biochem. 2000;69:183–215. doi: 10.1146/annurev.biochem.69.1.183. [DOI] [PubMed] [Google Scholar]
- 2.West AH, Stock AM. Histidine kinases and response regulator proteins in two-component signaling systems. Trends Biochem Sci. 2001;26:369–376. doi: 10.1016/s0968-0004(01)01852-7. [DOI] [PubMed] [Google Scholar]
- 3.Barrett JF, Hoch JA. Two-component signal transduction as a target for microbial anti-infective therapy. Antimicrob Agents Chemother. 1998;42:1529–1536. doi: 10.1128/aac.42.7.1529. [DOI] [PMC free article] [PubMed] [Google Scholar]
- 4.Macielag MJ, Goldschmidt R. Inhibitors of bacterial two-component signalling systems. Expert Opin Investig Drugs. 2000;9:2351–2369. doi: 10.1517/13543784.9.10.2351. [DOI] [PubMed] [Google Scholar]
- 5.Stephenson K, Hoch JA. Developing inhibitors to selectively target two-component and phosphorelay signal transduction systems of pathogenic microorganisms. Curr Med Chem. 2004;11:765–773. doi: 10.2174/0929867043455765. [DOI] [PubMed] [Google Scholar]
- 6.Lin ECC, Iuchi S. Regulation of gene expression in fermentative and respiratory systems in Escherichia and related bacteria. Annu Rev Genet. 1991;25:361–387. doi: 10.1146/annurev.ge.25.120191.002045. [DOI] [PubMed] [Google Scholar]
- 7.Bauer CE, Elsen S, Bird TH. Mechanisms for redox control of gene expression. Annu Rev Microbiol. 1999;53:495–523. doi: 10.1146/annurev.micro.53.1.495. [DOI] [PubMed] [Google Scholar]
- 8.Gunsalus RP, Park SJ. Aerobic-anaerobic gene regulation in Escherichia coli: control by the ArcAB and Fnr regulons. Res Microbiol. 1994;145:437–450. doi: 10.1016/0923-2508(94)90092-2. [DOI] [PubMed] [Google Scholar]
- 9.Iuchi S, Lin ECC. Signal transduction in the Arc system for control of operons encoding aerobic respiratory enzymes. In: Hoch JA, Silhavy TJ, editors. Two-Component Signal Transduction. American Society for Microbiology Press; Washington, D.C: 1995. pp. 223–231. [Google Scholar]
- 10.Iuchi S, Cameron DC, Lin EC. A second global regulator gene (arcB) mediating repression of enzymes in aerobic pathways of Escherichia coli. J Bacteriol. 1989;171:868–873. doi: 10.1128/jb.171.2.868-873.1989. [DOI] [PMC free article] [PubMed] [Google Scholar]
- 11.Iuchi S, Matsuda Z, Fujiwara T, Lin EC. The arcB gene of Escherichia coli encodes a sensor-regulator protein for anaerobic repression of the Arc modulon. Mol Microbiol. 1990;4:715–727. doi: 10.1111/j.1365-2958.1990.tb00642.x. [DOI] [PubMed] [Google Scholar]
- 12.Malpica R, Franco B, Rodriguez C, Kwon O, Georgellis D. Identification of a quinone-sensitive redox switch in the ArcB sensor kinase. Proc Natl Acad Sci USA. 2004;101:13318–13323. doi: 10.1073/pnas.0403064101. [DOI] [PMC free article] [PubMed] [Google Scholar]
- 13.Georgellis D, Kwon O, Lin EC. Quinones as the redox signal for the Arc two-component system of bacteria. Science. 2001;292:2314–2316. doi: 10.1126/science.1059361. [DOI] [PubMed] [Google Scholar]
- 14.Iuchi S, Lin EC. arcA (dye), a global regulatory gene in Escherichia coli mediating repression of enzymes in aerobic pathways. Proc Natl Acad Sci USA. 1988;85:1888–1892. doi: 10.1073/pnas.85.6.1888. [DOI] [PMC free article] [PubMed] [Google Scholar]
- 15.Lynch AS, Lin ECC. Responses to molecular oxygen. In: Neidhardt FC, Curtiss R III, Ingraham JL, Lin ECC, Low KB, Magasanik B, Reznikoff WS, Riley M, Schaechter M, Umbarger HE, editors. Escherichia coli and Salmonella: Cellular and Molecular Biology. 2. Vol. 1. American Society for Microbiology; Washington, D.C: 1996. pp. 1526–1538. [Google Scholar]
- 16.Liu X, De Wulf P. Probing the ArcA-P modulon of Escherichia coli by whole genome transcriptional analysis and sequence recognition profiling. J Biol Chem. 2004;279:12588–12597. doi: 10.1074/jbc.M313454200. [DOI] [PubMed] [Google Scholar]
- 17.Lu S, Killoran PB, Fang FC, Riley LW. The global regulator ArcA controls resistance to reactive nitrogen and oxygen intermediates in Salmonella enterica serovar Enteritidis. Infect Immun. 2002;70:451–461. doi: 10.1128/IAI.70.2.451-461.2002. [DOI] [PMC free article] [PubMed] [Google Scholar]
- 18.De Souza-Hart JA, Blackstock W, Di Modugno V, Holland IB, Kok M. Two-component systems in Haemophilus influenzae: a regulatory role for ArcA in serum resistance. Infect Immun. 2003;71:163–172. doi: 10.1128/IAI.71.1.163-172.2003. [DOI] [PMC free article] [PubMed] [Google Scholar]
- 19.Sengupta N, Paul K, Chowdhury R. The global regulator ArcA modulates expression of virulence factors in Vibrio cholerae. Infect Immun. 2003;71:5583–5589. doi: 10.1128/IAI.71.10.5583-5589.2003. [DOI] [PMC free article] [PubMed] [Google Scholar]
- 20.Mizuno T. Compilation of all genes encoding two-component phosphotransfer signal transducers in the genome of Escherichia coli. DNA Res. 1997;4:161–168. doi: 10.1093/dnares/4.2.161. [DOI] [PubMed] [Google Scholar]
- 21.Brown NL, Barrett SR, Camakaris J, Lee BT, Rouch DA. Molecular genetics and transport analysis of the copper-resistance determinant (pco) from Escherichia coli plasmid pRJ1004. Mol Microbiol. 1995;17:1153–1166. doi: 10.1111/j.1365-2958.1995.mmi_17061153.x. [DOI] [PubMed] [Google Scholar]
- 22.Martinez-Hackert E, Stock AM. The DNA-binding domain of OmpR: crystal structure of a winged-helix transcription factor. Structure. 1997;5:109–124. doi: 10.1016/s0969-2126(97)00170-6. [DOI] [PubMed] [Google Scholar]
- 23.Kondo H, Nakagawa A, Nishihira J, Nishimura Y, Mizuno T, Tanaka I. Escherichia coli positive regulator OmpR has a large loop structure at the putative RNA polymerase interaction site. Nat Struct Biol. 1997;4:28–31. doi: 10.1038/nsb0197-28. [DOI] [PubMed] [Google Scholar]
- 24.Simon G, Jourlin C, Ansaldi M, Pascal MC, Chippaux M, Mejean V. Binding of the TorR regulator to cis-acting direct repeats activates tor operon expression. Mol Microbiol. 1995;17:971–980. doi: 10.1111/j.1365-2958.1995.mmi_17050971.x. [DOI] [PubMed] [Google Scholar]
- 25.Blanco AG, Sola M, Gomis-Ruth FX, Coll M. Tandem DNA recognition by PhoB, a two-component signal transduction transcriptional activator. Structure. 2002;10:701–713. doi: 10.1016/s0969-2126(02)00761-x. [DOI] [PubMed] [Google Scholar]
- 26.Harlocker SL, Bergstrom L, Inouye M. Tandem binding of six OmpR proteins to the ompF upstream regulatory sequence of Escherichia coli. J Biol Chem. 1995;270:26849–26856. doi: 10.1074/jbc.270.45.26849. [DOI] [PubMed] [Google Scholar]
- 27.Baikalov I, Schröder I, Kaczor-Grzeskowiak M, Grzeskowiak K, Gunsalus RP, Dickerson RE. Structure of the Escherichia coli response regulator NarL. Biochemistry. 1996;35:11053–11061. doi: 10.1021/bi960919o. [DOI] [PubMed] [Google Scholar]
- 28.Djordjevic S, Goudreau PN, Xu Q, Stock AM, West AH. Structural basis for methylesterase CheB regulation by a phosphorylation-activated domain. Proc Natl Acad Sci USA. 1998;95:1381–1386. doi: 10.1073/pnas.95.4.1381. [DOI] [PMC free article] [PubMed] [Google Scholar]
- 29.Anand GA, Goudreau PN, Lewis JK, Stock AM. Evidence for phosphorylation-dependent conformational changes in methylesterase CheB. Protein Sci. 2000;9:898–906. doi: 10.1110/ps.9.5.898. [DOI] [PMC free article] [PubMed] [Google Scholar]
- 30.Hughes CA, Mandell JG, Anand GS, Stock AM, Komives EA. Phosphorylation causes subtle changes in solvent accessibility at the interdomain interface of methylesterase CheB. J Mol Biol. 2001;307:967–976. doi: 10.1006/jmbi.2001.4523. [DOI] [PubMed] [Google Scholar]
- 31.Eldridge AM, Kang HS, Johnson E, Gunsalus R, Dahlquist FW. Effect of phosphorylation on the interdomain interaction of the response regulator, NarL. Biochemistry. 2002;41:15173–15180. doi: 10.1021/bi026254+. [DOI] [PubMed] [Google Scholar]
- 32.Zhang JH, Xiao G, Gunsalus RP, Hubbell WL. Phosphorylation triggers domain separation in the DNA binding response regulator NarL. Biochemistry. 2003;42:2552–2559. doi: 10.1021/bi0272205. [DOI] [PubMed] [Google Scholar]
- 33.Buckler DR, Zhou Y, Stock AM. Evidence of intradomain and interdomain flexibility in an OmpR/PhoB homolog from Thermotoga maritima. Structure. 2002;10:153–164. doi: 10.1016/s0969-2126(01)00706-7. [DOI] [PubMed] [Google Scholar]
- 34.Robinson VL, Wu T, Stock AM. Structural analysis of the domain interface in DrrB, a response regulator of the OmpR/PhoB subfamily. J Bacteriol. 2003;185:4186–4194. doi: 10.1128/JB.185.14.4186-4194.2003. [DOI] [PMC free article] [PubMed] [Google Scholar]
- 35.Liu W, Hulett FM. Bacillus subtilis PhoP binds to the phoB tandem promoter exclusively within the phosphate starvation-inducible promoter. J Bacteriol. 1997;179:6302–6310. doi: 10.1128/jb.179.20.6302-6310.1997. [DOI] [PMC free article] [PubMed] [Google Scholar]
- 36.Fiedler U, Weiss V. A common switch in activation of the response regulators NtrC and PhoB: phosphorylation induces dimerization of the receiver modules. EMBO J. 1995;14:3696–3705. doi: 10.1002/j.1460-2075.1995.tb00039.x. [DOI] [PMC free article] [PubMed] [Google Scholar]
- 37.McCleary WR. The activation of PhoB by acetylphosphate. Mol Microbiol. 1996;20:1155–1163. doi: 10.1111/j.1365-2958.1996.tb02636.x. [DOI] [PubMed] [Google Scholar]
- 38.Wösten MM, Groisman EA. Molecular characterization of the PmrA regulon. J Biol Chem. 1999;274:27185–27190. doi: 10.1074/jbc.274.38.27185. [DOI] [PubMed] [Google Scholar]
- 39.Cho HS, Pelton JG, Yan D, Kustu S, Wemmer DE. Phosphoaspartates in bacterial signal transduction. Curr Opin Struct Biol. 2001;11:679–684. doi: 10.1016/s0959-440x(01)00271-8. [DOI] [PubMed] [Google Scholar]
- 40.Yan D, Cho HS, Hastings CA, Igo MM, Lee SY, Pelton JG, Stewart V, Wemmer DE, Kustu S. Beryllofluoride mimics phosphorylation of NtrC and other bacterial response regulators. Proc Natl Acad Sci USA. 1999;96:14789–14794. doi: 10.1073/pnas.96.26.14789. [DOI] [PMC free article] [PubMed] [Google Scholar]
- 41.Cho H, Wang W, Kim R, Yokota H, Damo S, Kim SH, Wemmer DE, Kustu S, Yan D. BeF3− acts as a phosphate analog in proteins phosphorylated on aspartate: structure of a BeF3− complex with phosphoserine phosphatase. Proc Natl Acad Sci USA. 2001;98:8525–8530. doi: 10.1073/pnas.131213698. [DOI] [PMC free article] [PubMed] [Google Scholar]
- 42.Chabre M. Aluminofluoride and beryllofluoride complexes: a new phosphate analogues in enzymology. Trends Biochem Sci. 1990;15:6–10. doi: 10.1016/0968-0004(90)90117-t. [DOI] [PubMed] [Google Scholar]
- 43.Volz K. Structural conservation in the CheY superfamily. Biochemistry. 1993;32:11741–11753. doi: 10.1021/bi00095a001. [DOI] [PubMed] [Google Scholar]
- 44.Robinson VL, Buckler DR, Stock AM. A tale of two components: a novel kinase and a regulatory switch. Nat Struct Biol. 2000;7:628–633. doi: 10.1038/77915. [DOI] [PubMed] [Google Scholar]
- 45.Lewis RJ, Brannigan JA, Muchová K, Barák I, Wilkinson AJ. Phosphorylated aspartate in the structure of a response regulator protein. J Mol Biol. 1999;294:9–15. doi: 10.1006/jmbi.1999.3261. [DOI] [PubMed] [Google Scholar]
- 46.Birck C, Mourey L, Gouet P, Fabry B, Schumacher J, Rousseau P, Kahn D, Samama J-P. Conformational changes induced by phosphorylation of the FixJ receiver domain. Structure Fold Des. 1999;7:1505–1515. doi: 10.1016/s0969-2126(00)88341-0. [DOI] [PubMed] [Google Scholar]
- 47.Halkides CJ, McEvoy MM, Casper E, Matsumura P, Volz K, Dahlquist FW. The 1.9 Å resolution crystal structure of phosphono-CheY, an analogue of the active form of the response regulator, CheY. Biochemistry. 2000;39:5280–5286. doi: 10.1021/bi9925524. [DOI] [PubMed] [Google Scholar]
- 48.Lee SY, Cho HS, Pelton JG, Yan D, Berry EA, Wemmer DE. Crystal structure of activated CheY. Comparison with other activated receiver domains. J Biol Chem. 2001;276:16425–16431. doi: 10.1074/jbc.M101002200. [DOI] [PubMed] [Google Scholar]
- 49.Bent CJ, Isaacs NW, Mitchell TJ, Riboldi-Tunnicliffe A. Crystal structure of the response regulator 02 receiver domain, the essential YycF two-component system of Streptococcus pneumoniae in both complexed and native states. J Bacteriol. 2004;186:2872–2879. doi: 10.1128/JB.186.9.2872-2879.2004. [DOI] [PMC free article] [PubMed] [Google Scholar]
- 50.Birck C, Chen Y, Hulett FM, Samama JP. The crystal structure of the phosphorylation domain in PhoP reveals a functional tandem association mediated by an asymmetric interface. J Bacteriol. 2003;185:254–261. doi: 10.1128/JB.185.1.254-261.2003. [DOI] [PMC free article] [PubMed] [Google Scholar]
- 51.Jeon Y, Lee YS, Han JS, Kim JB, Hwang DS. Multimerization of phosphorylated and non-phosphorylated ArcA is necessary for the response regulator function of the Arc two-component signal transduction system. J Biol Chem. 2001;276:40873–40879. doi: 10.1074/jbc.M104855200. [DOI] [PubMed] [Google Scholar]
- 52.Lukat GS, McCleary WR, Stock AM, Stock JB. Phosphorylation of bacterial response regulator proteins by low molecular weight phospho-donors. Proc Natl Acad Sci USA. 1992;89:718–722. doi: 10.1073/pnas.89.2.718. [DOI] [PMC free article] [PubMed] [Google Scholar]
- 53.Johnson ML, Correia JJ, Yphantis DA, Halvorson HR. Analysis of data from the analytical ultracentrifuge by nonlinear least-squares techniques. Biophys J. 1981;36:575–588. doi: 10.1016/S0006-3495(81)84753-4. [DOI] [PMC free article] [PubMed] [Google Scholar]
- 54.Lee YS, Han JS, Jeon Y, Hwang DS. The Arc two-component signal transduction system inhibits in vitro Escherichia coli chromosomal initiation. J Biol Chem. 2001;276:9917–9923. doi: 10.1074/jbc.M008629200. [DOI] [PubMed] [Google Scholar]
- 55.Lynch AS, Lin EC. Transcriptional control mediated by the ArcA two-component response regultor protein of Escherichia coli: characterization of DNA binding at target promoters. J Bacteriol. 1996;178:6238–6249. doi: 10.1128/jb.178.21.6238-6249.1996. [DOI] [PMC free article] [PubMed] [Google Scholar]
- 56.Volz K, Matsumura P. Crystal structure of Escherichia coli CheY refined at 1.7 Å resolution. J Biol Chem. 1991;266:15511–15519. doi: 10.2210/pdb3chy/pdb. [DOI] [PubMed] [Google Scholar]
- 57.Simonovic M, Volz K. Atomic resolution structure of a succinimide intermediate in E. coli CheY. J Mol Biol. 2002;322:663–667. doi: 10.1016/s0022-2836(02)00821-5. [DOI] [PubMed] [Google Scholar]
- 58.Volkman BF, Lipson D, Wemmer DE, Kern D. Two-state allosteric behavior in a single domain signaling protein. Science. 2001;291:2429–2433. doi: 10.1126/science.291.5512.2429. [DOI] [PubMed] [Google Scholar]
- 59.Lee S-Y, Cho HS, Pelton JG, Yan D, Henderson RK, King DS, Huang L-S, Kustu S, Berry EA, Wemmer DE. Crystal structure of an activated response regulator bound to its target. Nat Struct Biol. 2001;8:52–56. doi: 10.1038/83053. [DOI] [PubMed] [Google Scholar]
- 60.Zhao R, Collins EJ, Bourret RB, Silversmith RE. Structure and catalytic mechanism of the E. coli chemotaxis phosphatase CheZ. Nat Struct Biol. 2002;9:570–575. doi: 10.1038/nsb816. [DOI] [PubMed] [Google Scholar]
- 61.Park S, Meyer M, Jones AD, Yennawar HP, Yennawar NH, Nixon BT. Two-component signaling in the AAA+ ATPase DctD: binding Mg2+ and BeF3− selects between alternate dimeric states of the receiver domain. FASEB J. 2002;16:1964–1966. doi: 10.1096/fj.02-0395fje. [DOI] [PubMed] [Google Scholar]
- 62.Park S, Zhang H, Jones AD, Nixon BT. Biochemical evidence for multiple dimeric states of the Sinorhizobium meliloti DctD receiver domain. Biochemistry. 2002;41:10934–10941. doi: 10.1021/bi0260031. [DOI] [PubMed] [Google Scholar]
- 63.Glaser F, Pupko T, Paz I, Bell RE, Bechor-Shental D, Martz E, Ben-Tal N. ConSurf: identification of functional regions in proteins by surface-mapping of phylogenetic information. Bioinformatics. 2003;19:163–164. doi: 10.1093/bioinformatics/19.1.163. [DOI] [PubMed] [Google Scholar]
- 64.Solà M, Gomis-Rüth FX, Serrano L, González A, Coll M. Three-dimensional crystal structure of the transcription factor PhoB receiver domain. J Mol Biol. 1999;285:675–687. doi: 10.1006/jmbi.1998.2326. [DOI] [PubMed] [Google Scholar]
- 65.Li J, Kustu S, Stewart V. In vitro interaction of nitrate-responsive regulatory protein NarL with DNA target sequences in the fdnG, narG, narK, and frdA operon control regions of Escherichia coli K-12. J Bacteriol. 1994;241:150–165. doi: 10.1006/jmbi.1994.1485. [DOI] [PubMed] [Google Scholar]
- 66.Federle MJ, Scott JR. Identification of binding sites for the group A streptococcal global regulator CovR. Mol Microbiol. 2002;43:1161–1172. doi: 10.1046/j.1365-2958.2002.02810.x. [DOI] [PubMed] [Google Scholar]
- 67.Tabor S, Richardson CC. A bacteriophage T7 RNA polymerase/promoter system for controlled exclusive expression of specific genes. Proc Natl Acad Sci USA. 1985;84:1074–1078. doi: 10.1073/pnas.82.4.1074. [DOI] [PMC free article] [PubMed] [Google Scholar]
- 68.Hendrickson WA, Horton JR, LeMaster DM. Selenomethionyl proteins produced for analysis by multiwavelength anomalous diffraction (MAD): a vehicle for direct determination of three-dimensional structure. EMBO J. 1990;9:1665–1672. doi: 10.1002/j.1460-2075.1990.tb08287.x. [DOI] [PMC free article] [PubMed] [Google Scholar]
- 69.Robinson VL, Hwang J, Fox E, Inouye M, Stock AM. Domain arrangement of Der, a switch protein containing two GTPase domains. Structure. 2002;10:1649–1658. doi: 10.1016/s0969-2126(02)00905-x. [DOI] [PubMed] [Google Scholar]
- 70.Sheridan RC, McCullough JF, Wakefield ZT. Phosphoramidic acid and its salts. Inorg Synth. 1971;13:23–26. [Google Scholar]
- 71.Laue TM, Shah BD, Ridgeway TM, Pelletier SL. Computer-aided interpretation of analytical sedimentation data for proteins. In: Harding S, Rowe A, Horton J, editors. Analytical Ultracentrifugation in Biochemistry and Polymer Science. Royal Society of Chemistry; Cambridge, UK: 1992. pp. 90–125. [Google Scholar]
- 72.Schuck P. Size-distribution analysis of macromolecules by sedimentation velocity ultracentrifugation and Lamm equation modeling. Biophys J. 2000;78:1606–1619. doi: 10.1016/S0006-3495(00)76713-0. [DOI] [PMC free article] [PubMed] [Google Scholar]
- 73.Otwinowski Z, Minor W. Processing of X-ray diffraction data collected in oscillation mode. Methods Enzymol. 1997;276 (part A):307–326. doi: 10.1016/S0076-6879(97)76066-X. [DOI] [PubMed] [Google Scholar]
- 74.Brünger AT, Adams PD, Clore GM, DeLano WL, Gros P, Grosse-Kunstleve RW, Jiang JS, Kuszewski J, Nilges M, Pannu NS, Read RJ, Rice LM, Simonson T, Warren GL. Crystallography & NMR system: A new software suite for macromolecular structure determination. Acta Crystallogr D. 1998;54:905–921. doi: 10.1107/s0907444998003254. [DOI] [PubMed] [Google Scholar]
- 75.Cowtan K. ‘dm’: An automated procedure for phase improvement by density modification. Joint CCP4 and ESF-EACBM Newsletter on Protein Crystallography. 1994;31:34–38. [Google Scholar]
- 76.Collaborative Computational Project N. The CCP4 suite: programs for protein crystallography. Acta Crystallogr D. 1994;50:760–763. doi: 10.1107/S0907444994003112. [DOI] [PubMed] [Google Scholar]
- 77.McRee DE. XtalView/Xfit-A versatile program for manipulating atomic coordinates and electron density. J Struct Biol. 1999;125:156–165. doi: 10.1006/jsbi.1999.4094. [DOI] [PubMed] [Google Scholar]
- 78.Murshudov GN. Refinement of macromolecular structures by the maximum-likelihood method. Acta Crystallogr D. 1997;53:240–255. doi: 10.1107/S0907444996012255. [DOI] [PubMed] [Google Scholar]
- 79.Lamzin VS, Wilson KS. Automated refinement of protein models. Acta Crystallogr D. 1993;49:129–147. doi: 10.1107/S0907444992008886. [DOI] [PubMed] [Google Scholar]
- 80.Storoni LC, McCoy AJ, Read RJ. Likelihood-enhanced fast rotation functions. Acta Crystallogr D. 2004;60:432–438. doi: 10.1107/S0907444903028956. [DOI] [PubMed] [Google Scholar]
- 81.Laskowski RA, McArthur MW, Moss DS, Thornton JM. PROCHECK: a program to check the stereochemical quality of protein structures. J Appl Crystallogr. 1993;26:282–291. [Google Scholar]
- 82.Kern D, Volkman BF, Luginbuhl P, Nohaile MJ, Kustu S, Wemmer DE. Structure of a transiently phosphorylated switch in bacterial signal transduction. Nature. 1999;40:894–898. doi: 10.1038/47273. [DOI] [PubMed] [Google Scholar]