

Abstract
The ultimate goal of structural biology is to understand the structural basis of proteins in cellular processes. In structural biology, the most critical issue is the availability of high-quality samples. “Structural biology-grade” proteins must be generated in the quantity and quality suitable for structure determination using X-ray crystallography or nuclear magnetic resonance (NMR) spectroscopy. The purification procedures must reproducibly yield homogeneous proteins or their derivatives containing marker atom(s) in milligram quantities. The choice of protein purification and handling procedures plays a critical role in obtaining high-quality protein samples. With structural genomics emphasizing a genome-based approach in understanding protein structure and function, a number of unique structures covering most of the protein folding space have been determined and new technologies with high efficiency have been developed. At the Midwest Center for Structural Genomics (MCSG), we have developed semi-automated protocols for high-throughput parallel protein expression and purification. A protein, expressed as a fusion with a cleavable affinity tag, is purified in two consecutive immobilized metal affinity chromatography (IMAC) steps: (i) the first step is an IMAC coupled with buffer-exchange, or size exclusion chromatography (IMAC-I), followed by the cleavage of the affinity tag using the highly specific Tobacco Etch Virus (TEV) protease; [1] the second step is IMAC and buffer exchange (IMAC-II) to remove the cleaved tag and tagged TEV protease. These protocols have been implemented on multidimensional chromatography workstations and, as we have shown, many proteins can be successfully produced in large-scale. All methods and protocols used for purification, some developed by MCSG, others adopted and integrated into the MCSG purification pipeline and more recently the Center for Structural Genomics of Infectious Diseases (CSGID) purification pipeline, are discussed in this chapter.
Keywords: domain design, expression vectors, gene cloning, protein purification, crystallization screening, quality assessment
Introduction
Currently, the DNA sequences of over 1,650 genomes are publicly available (http://www.microbesonline.org/). A typical microbial genome codes for 1,500 to 8,000 proteins, whereas a typical eukaryotic genome codes for 10,000 to 60,000 proteins. The majority of chemical reactions and cellular functions necessary for sustaining life are performed by proteins, which often work in cells as components of larger assemblies. In order to grasp the function of all cellular components, we need to be able to identify proteins, predict their properties and function from their primary sequence using computational methods, and produce proteins in quantities suitable for comprehensive studies (biophysical, biochemical, and functional characterizations, the identification of post-translational modifications, structural analysis and map interactions, and temporal relationships). This is not a trivial task; predicting protein function, biophysical properties and structure from the amino acid sequence is still a very challenging undertaking. Using the Gene Ontology approach, only approximately half of the predicted protein genes have some functional association [2].
Recombinant DNA technologies are available that allow researchers to express foreign genes in bacteria, yeast, mammalian, and insect cells or in vitro [3]. Through these technologies, many proteins have been made available for biochemical, biological, and biotechnological applications. Many key developments mark the progress of protein expression. The use of T7 polymerase is perhaps the most noteworthy [4]. Others include the development of E. coli strains that contain low levels of proteases or those that overproduce molecular chaperones and allow “problem” proteins to be overexpressed as a fusion with “helper” proteins [5]. Moreover, expression of recombinant proteins allows isotopic enrichment with selenium atoms that can replace the sulfur atoms in methionines for structure phasing in X-ray crystallography, or with C13 and N15 for structure determination using NMR, or tag proteins with other labels, such as biotin, for functional experiments [6]. These developments have dramatically changed the field of biology, specifically structural biology, and made it possible to produce large numbers of proteins from many different organisms, including those that are difficult or impossible to cultivate in the laboratory [7].
Structural biology—both X-ray crystallography and NMR spectroscopy—is one of the few areas that still demands milligram quantities of high quality protein samples. In addition, the emergence of structural genomics has promoted rapid technological advances in gene cloning, protein expression, protein purification and characterization. These new technologies take advantage of robotics hardware, process parallelization, new expression vectors, the use of affinity tags, improved fermentation protocols, semi-automated protein purification methods, integrated protein characterization and storage, and semi-automated crystallization screening [8]. It is clear that as the new technology matures, it can be expanded and applied to other areas of biology. Improvements in protein expression have already made a major impact on many aspects of biology. Certainly, a large- or even medium-scale cloning and expression program cannot be run efficiently using manual procedures. The only economically acceptable solution to this problem is the use of automation, robotics, standardized operating protocols, and well understood alternative pathways that can address specific classes of recalcitrant proteins. Several key technologies are needed for such an approach:
-
▪
Bioinformatics component for the annotation and selection of protein targets and the design of their fragments for gene cloning and protein expression.
-
▪
Methods for large-scale protein expression, effective affinity purification of milligram quantities of active, full-length proteins, protein domains and stable protein-protein complexes, including proteins difficult to produce and characterize, such as trans-membrane or membrane associated proteins and protein-protein or protein-nucleic acid assemblies.
-
▪
Methods for improving protein solubility and refolding.
-
▪
High-throughput methods for quality control to characterize proteins by a variety of biochemical and biophysical assays.
-
▪
Computational tools to efficiently collect, analyze, and interpret the production and characterization data to guide the decision making process. These would include tools for initial genome annotation, analysis of successful and unsuccessful expression, and identification of previously known protein associations with other proteins and ligands.
-
▪
Laboratory Information Management Systems (LIMS) for tracking all aspects of the workflow, such as managing samples, protein-production data, and protein characterization data.
In this manuscript, we will focus on experimental aspects of protein production, crystallization, and quality control. Results from a number of international structural genomics and proteomics efforts showed that these new approaches are feasible and have been quite successful in purifying hundreds of thousands of proteins with highly diverse properties and origins [8]. The largest such effort in the USA, the NIH-funded Protein Structure Initiative, cloned over 150,000 genes and purified over 50,000 different proteins [9]. Some important trends emerged from this large-scale effort.
The high-throughput approach involves processing numerous proteins through standardized protocols that are not optimized for any given protein but work reasonably well and can be applied to many samples in a “pipeline-like” process (Figure 1). Here we include protocols recommended as a first choice to produce a protein selected from a genome. Obviously, these methods are not designed to produce all proteins and protocols will need to be altered and optimized for a specific protein that failed the standard purification procedure. For example, one of the major bottlenecks in protein expression is obtaining soluble proteins. Approximately 50% of proteins (including bacterial proteins) are not soluble when expressed in E. coli. Understanding and overcoming these and other bottlenecks are critical for these methods to be useful for protein production. The protocols applied within the MCSG approximate the consensus approach of many structural genomics projects [8]. They involve ligation-independent-cloning [10] of amplified genes into vectors that attach a cleavable N-terminal His-tag to the proteins, purification by Ni-IMAC, specific protease treatment to cleave, and a subtractive IMAC to remove the tag [11-13]. In addition, several methods have been implemented to salvage proteins that failed using these standard protocols, including reductive methylation, limited proteolysis in situ and in vitro, use of orthologs, nested truncations, co-expression of interacting proteins, ligand screening, mutagenesis and surface entropy reduction [14-21]. Also, recloning a problematic protein or its domains with or without specific mutations, with alternative tags, using fusion partners, or using a cell free expression system can sometimes yield structures where the initial efforts failed [22, 23].
Figure 1.
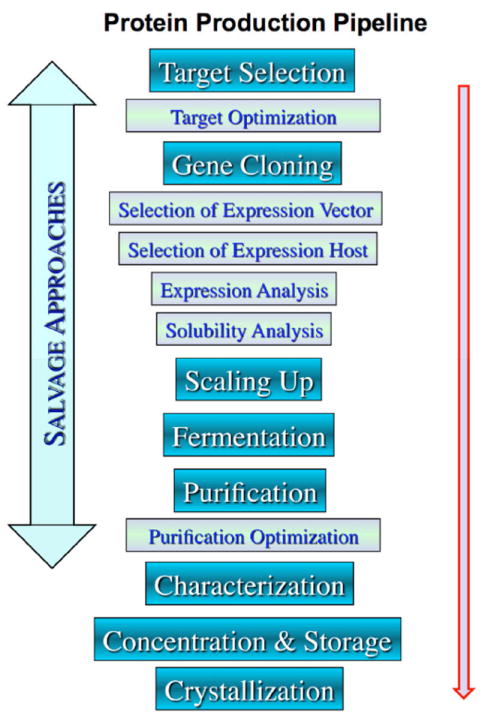
Main steps in protein production.
The genome and proteome and their interaction within cellular and organismal systems will be the focus of 21st century biology. The impact of technologies that can make thousands of proteins available as specific reagents and markers is difficult to overestimate. A unique protein resource can be created that can be exploited for basic research and biotechnology applications. The approach to develop an efficient system for gene cloning, protein expression and purification at the scale of an entire genome is inherently different from classical methods. The establishment of semi-automated systems requires a more general approach for the evaluation and implementation of new protocols. To achieve a high-throughput format, protocols must be capable of uniform application to all input and output resources. This requires a universal approach that permits cloning and expression of targets from any source as well as minimizing manual intervention between the various steps. Optimization of the pipeline for efficiency and cost effectiveness is also important. This requires integration of cloning and expression and scaling up processes with protein purification and analytical methods to assess protein expression level and quality. The implementation of such a system requires utilization of the following: a) an efficient liquid handling hardware that accepts a standard microplate format, b) high-throughput flexible cloning strategies, c) standard fermentation media, d) standard chromatography columns and protein concentration devices, e) sample storage protocol, and f) high-throughput quality assurance and quality control methods. The high-throughput protocols for biochemical and biophysical characterization of expressed gene products need to be implemented using methods such as: UV/VIS spectroscopy, polyacrylamide gel electrophoresis (1DE, 2DE, and native) or microfluidic capillary electrophoresis, mass spectroscopy, size exclusion chromatography (SEC), HSQC NMR spectroscopy, dynamic and static light scattering, circular dichroism spectroscopy and X-ray spectroscopy. Because of space limitation, this manuscript cannot comprehensively describe in detail all approaches used in the MCSG structure determination pipeline.
1. Target selection and computational target optimization
The plethora of publicly available completed genome sequences and corresponding genomic DNA enables the study of a given gene using an ‘ortholog’ approach. The latest release of Pfam, a collection of protein family alignments constructed automatically using hidden Markov models (HMMs) has nearly 12,000 families of more than 10 million protein sequences with a median of 150 sequences per family (Figure 2) [1]. This enables the selection of several orthologs of a given target for most families for expression and therefore increases the probability of obtaining soluble protein compatible with large-scale purification, high-throughput crystallization and structural determination.
Figure 2.
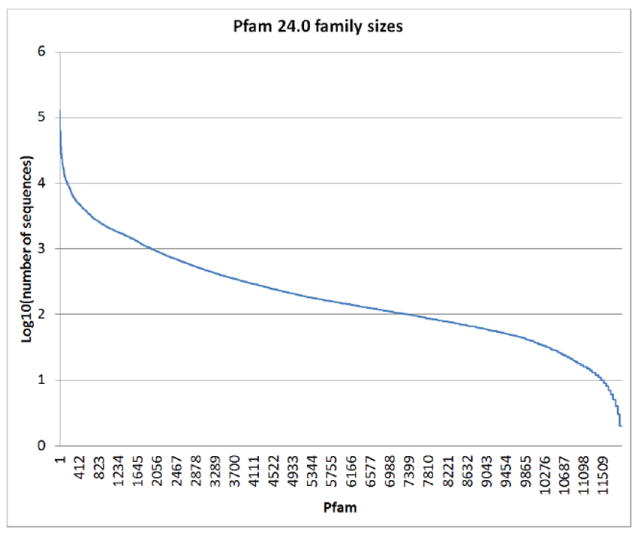
Family size distribution of the 12,000 protein families in the Pfam database. The largest family, the ABC transporters have nearly 130,000 members, while the smallest families, such as the conotoxins have 2 members.
Targets are selected from a list of genomes for which the DNA is available. In the MCSG and CSGID pipelines, the main focus is on non-membrane microbial proteins and the targets are selected using a standardized bioinformatics pipeline which eliminates trans-membrane segments, signal peptides and large disordered regions from the target sequence [24]. Several truncations are designed based on protein disorder prediction. For each ortholog, on average 2-3 constructs are designed [25].
As mentioned previously, one of the major bottlenecks in structural genomics is to obtain a soluble protein amenable for downstream processing. The other major bottleneck is to obtain crystals of the purified proteins. These two steps account for more than 80% of the attrition rate in the pipeline (90% overall attrition rate). Since the current pipeline has processed tens of thousands of protein samples using the same bioinformatics target selection procedure and standard experimental operating protocols, the accumulated data in the LIMS can be utilized in data mining to derive protein features that affect “crystallization feasibility” or crystallizability. Several approaches have been reported previously to predict the protein amenability to crystallization given an amino acid sequence [26, 27].
The analyzed data sets range from a few hundred sequences to an entire protein set deposited in the Protein Data Bank (PDB). Prediction methods vary from simple calculations based on iso-electric point (pI) and grand average hydropathy (GRAVY), or di- and tri-peptide profiles, to more sophisticated methods where several predictions including secondary structure, disorder, and residue conservation are included. One of the early predictors, the OB-score is derived from the clustering of pI and GRAVY values calculated for a reduced set of PDB entries and UniProt sequences [28]. At the MCSG, we have developed a computational method to predict crystallizability similar to the scoring methods developed at the JCSG and the NESG [26, 27]. Briefly, we used two datasets in the development of our crystallizability scoring method from the MCSG pipeline: a set of more than 1,700 proteins that expressed well but were insoluble and a set of more than 700 MCSG proteins that were deposited to the PDB. The sequence sets were clustered to 60% identity in order to eliminate redundancies. The two datasets covered more than 130 species. A score matrix was constructed similarly to the OB-score by two-dimensional binning of the calculated pI and GRAVY values for the two datasets. The MCSG Z-score can predict insoluble proteins at 71% accuracy and those producing crystals amenable for structure determination with 60% accuracy. We also have developed a Support Vector Machine-based prediction method for crystallizability of proteins utilizing a prioritized set of 20 amino acid attributes and achieved 69% accuracy for the positive class and 66% accuracy for the negative class (‘crystal’ and ‘insoluble,’ respectively) [22]. This predictor is further improved by including additional sequence-based attributes, such as topology (trans-membrane and signal peptide predictions), similarity profile to existing structures and orthologs, sequence family profiles (e.g. Pfam, Gene3D, COG HMM searches), secondary structure, and prediction of disordered, low complexity, and coiled-coil regions. We have shown previously that a linear combination of the above mentioned attributes could be used to define a score profile. Insoluble proteins have overall low scores, while proteins that led to PDB deposits have mostly optimal solutions [22].
In the current phase of the Protein Structure Initiative (PSI), PSI:Biology, the MCSG has been using the MCSG Z-score prospectively by actively selecting high scoring targets from a large target pool. In a recent set of 576 proteins from the high MCSG Z-score group, more than 200 proteins have been purified and more than 40 structures determined to date giving a ~20% success rate from purified protein to structure. In contrast, of a set of 384 targets with neutral or lower Z-scores, only ~40 proteins have been purified in large scale and 3 structures determined giving only a ~7% success rate from purified protein to structure. The approach has been utilized in the CSGID pipeline as well for very large eukaryotic targets (more than 4,000 amino acids long) to define amenable domains based on domain predictions combined with boundary refinement using the MCSG Z-score. The mining of the MCSG data enables the dynamic reconstruction of the MCSG Z-score providing a constant refinement of target selection based on experimental success rate.
We have developed publicly available web utilities allowing the generation of MCSG Z-score predictions for proteins (http://bioinformatics.anl.gov/cgi-bin/tools/pdpredictor):
-
▪
calculating crystallizability for all possible truncations of a given protein sequence and selecting optimal subdomains with the help of heat maps
-
▪
calculating crystallizability for a series of protein targets
-
▪
manipulating protein sequences prior to submission.
An example is shown for the generation of the crystallizability heat map for a given MCSG target (Figure 3).
Figure 3.
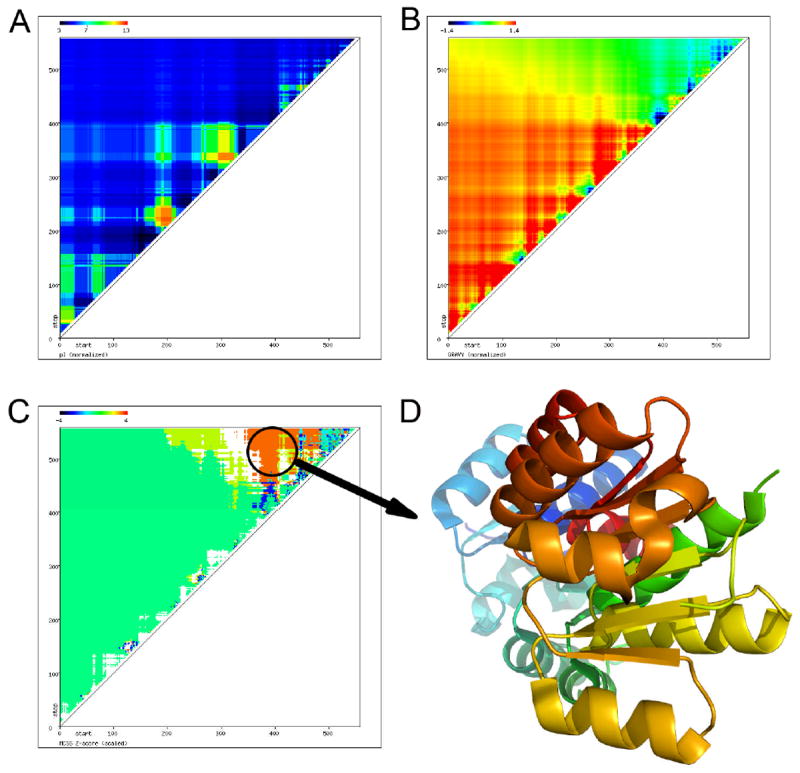
The 2D map of crystallizability of YbaL from Escherichia coli. The pI (A), the GRAVY (B), and the MCSG Z-score (C) are calculated for all possible truncations of a given target and displayed in the web interface. The domain is highlighted in the 2D map (C) with the corresponding structure (D) shown. The X-axis denotes the start while the Y-axis denotes the end of a given construct of the protein sequence.
The pI, GRAVY, and MCSG Z-score (Figures 3A, B, C, respectively) are calculated for every possible truncation of the input sequence and displayed using an absolute scale (calculated minimum and maximum) and a predefined scale inherent in the MCSG Z-score for comparison. While the protein is acidic for the most part, its N-terminal region is mostly hydrophobic and its C-terminal region is less hydrophobic, providing an optimal MCSG Z-score (Figure 3C) for structure determination.
1.1. Methods: target selection and optimization
1.1.1. Design of truncations using the MCSG Z-score matrix
Several nested truncations can be designed using our publicly available interface (http://bioinformatics.anl.gov/cgi-bin/tools/pdpredictor). Heat maps are generated for the calculated pI, GRAVY, and MCSG Z-score distributions. The user can include a fusion tag, for example, a solubility tag. This tag will change the overall behavior of the target protein, drastically altering the 2D heat map. In addition, the matrix data can be downloaded from the website. An online manual is available on the website.
Paste the protein sequence in FASTA format with or without a header.
Select the expression vector for inclusion (if any) and whether the heat map should be calculated with the fused or cleaved truncations.
Select the score range displayed for the MCSG Z-score matrix.
For an average protein (300 amino acids) nearly 10,000 data points are calculated and displayed within 60 seconds.
1.1.2. Evaluation of crystallizability of several protein sequences using the MCSG Z-score matrix
To evaluate all possible truncations of a given protein sequence, a separate web utility calculates the crystallizability score for a list of input sequences. The web interface accepts sequences in a specialized format: one sequence per line. A separate web utility is available to convert FASTA formatted sequences (single or multiple sequences) to the required format.
Prepare the protein sequences prior to pasting them into the utility. A separate utility exists to perform these conversions. Sequences from spreadsheets where a single cell contains a sequence without a new line character are compatible.
Paste the sequence(s) in the textbox.
The interface calculates the pI, MW, GRAVY, and MCSG Z-score for the protein sequences in a tab-delimited format.
Several additional utilities are available, for example, 2D binning of input data and visualization of 2D matrices (http://bioinformatics.anl.gov/cgi-bin/tools/pdpredictor).
2. Selection of protein expression vector
Purification of many different proteins from complex mixtures using one protocol and aided by robotic workstations required the use of specific affinity tags. The use of a cleavable N-terminal histidine tag has proven to be highly effective [29]. Typically, the N-terminal His-tag is used as a first choice to allow affinity purification. Alternative tags or fusion partners are also considered to improve expression level and solubility. The MCSG developed a set of protein expression vectors that utilize the LIC approach.
Plate-based methods for cloning, expression, and evaluation of target proteins can help researchers investigate the large number of proteins and protein constructs. LIC is well suited to robotic cloning and expression [12, 13]. It eliminates restriction enzyme screening and DNA ligase components of traditional cloning protocols. LIC provides unique cloning sites, is directional, highly efficient, simple, “generic,” rapid, easy, and has a low background. It can be implemented readily in a highly parallel format and with minimal optimization. The LIC approach can rapidly generate multiple constructs from a single template, is compatible with multiple vectors, and is well suited to robotic and manual cloning and expression. The MCSG has developed over 50 expression vectors for large-scale protein expression that are optimized for structural biology applications and are made available for the scientific community from the PSI Material Repository [11-13, 19, 30-33](www.mcsg.anl.gov). For example, vector pMCSG7 appends a His6-tag to the N-terminus of a target protein, which is cleavable with a highly specific TEV protease. Vector pMCSG19 produces fusion proteins in which maltose-binding protein (MBP), the His6-tag and the target protein are separated by two cleavage sites for two specific proteases, TEV and Tobacco Vein Mottling Virus (TVMV) in the configuration of MBP-TVMVsite-His6-TEVsite-target protein [12]. Vector pMCSG28 appends the His6-tag to the C-terminus of the target protein [32]. In vivo cleavage can remove fusion proteins and allow purification of a His6-tagged target protein. Cloning protocols for all the vectors are identical. Many use the same set of primers allowing the same Polymerase Chain Reaction (PCR) product to be used with different vectors. All proteins are expressed and purified by the same standard protocols. The design and use of new protein expression vectors were tested on thousands of gene constructs and have been applied to large proteins and eukaryotic domains. Many expression vectors are available through the PSI-MR (http://psimr.asu.edu/) [34].
3. Gene amplification and cloning
In the MCSG and CSGID pipelines, the gene amplification and cloning steps are automated in a 96-well plate format. However the methods described here can be scaled down to experiments carried out in smaller laboratories. The plethora of available genomic DNA from commercial sources (e.g. ATCC and DSMZ), web-enabled oligo design, and LIC cloning greatly accelerates these steps in the pipelines.
3.1. Methods: gene amplification and cloning
The cloning process includes PCR, T4 polymerase treatment of purified PCR product, and annealing to the T4 polymerase treated vector. The LIC mixture is transformed directly into the expression cell line, such as E. coli BL21 DE3.
The open reading frame [10] of a protein is typically amplified by PCR from genomic DNA with KOD Hot Start DNA Polymerase (EMD4Biosciences). Vector compatible primers are designed using an automated primer generator software that is part of the publicly available tools provided by the MCSG, where a list of target DNA sequences and the destination vectors is used as an input (https://bioinformatics.anl.gov/targets/public_tools.aspx) [35]. The oligos are commercially synthesized in a 96-well plate format. The Beckman FX instrument (Beckman Coulter, Inc., Fullerton, CA) is used to prepare primer dilutions and array the amplification mix into 96-well thermocycler plates. For gene amplification, the original PCR reaction buffer can be supplemented with 2.5 M betaine to suppress the negative effects of GC-rich regions.
The touchdown PCR cycling parameters are as follows: initial denaturation at 95°C for 2 min and 30 sec, primer annealing for 30 sec, and elongation at 70°C for 3 min. The annealing temperature is decreased 1°C every two cycles with the initial cycle at 62°C. Once the annealing temperature reaches 55°C, another 18 cycles are performed. There is no final extension and samples are cooled down to 4°C.
After the thermocycler program is completed, the amplified fragments are purified using a QIAquick 96 PCR fragment purification kit (Qiagen, Inc., Valencia, CA). The semi-automated fragment purification method uses the solutions provided in the kit and procedures modified to adapt to the FX instrument (Beckman Coulter, Inc.). The DNA concentration of the purified fragments is determined by a PicoGreen fluorescent assay (Invitrogen/Molecular Probes, Eugene, OR) using 96-well plates.
The LIC methods are based on a modification [30] of those recommended by the supplier. Purified PCR fragments (approximately 0.2 pmol) are treated with 2.5 units of T4 DNA polymerase in a reaction mix containing 1X reaction buffer provided by the supplier, 5 mM dithiothreitol (DTT) and 2.5 mM dCTP (specific for the LIC site of the pMCSG7 compatible vectors in a total reaction volume of 40 μl) (dTTP is used for C-terminal tag vectors). The samples are incubated in a 96-well plate for 40 min at room temperature. To inactivate the T4 DNA polymerase, the plate is transferred to a thermocycler with a heated lid and programmed at 75°C for 20 min. The preferred vectors for annealing are pMCSG7 [30] and pMCSG19 [12], or their derivatives. Both vectors encode proteins with an N-terminal His6-tag followed by a TEV protease cleavage site (ENLYFQ↓S). In addition, vector pMCSG19 contains a gene for MBP that is followed by a TVMV protease cleavage site (ETVRFQG↓S). After in vivo cleavage with TVMV protease, the proteins expressed from pMCSG7 and pMCSG19 vectors are the same: His6-TEVsite-target. There are two methods of vector preparation for the LIC reaction. The traditional method is based on digestion with SspI (or SmaI for C-terminal tag vectors) followed by agarose purification of linearized plasmid. In the alternative method, a vector is PCR amplified using appropriate primers. The amplification product is identical to the one obtained by blunt end digestion as long as a high fidelity polymerase is used. The linearized vector from either method is treated with T4 polymerase in the presence of dGTP (dATP for C-terminal tag vectors) using conditions similar to those of the preparation of the PCR fragments. Equal volumes of T4 treated PCR insert and vector (5 μL total) are incubated for 10 min on ice. After incubation, 50 μL of competent cells is added. For the single protease vectors (TEV), the LIC mixture is transformed into E. coli BL21-derivative cells carrying pMAGIC plasmid encoding one rare E. coli tRNA (Arg (AGA/AGG)). In the case of vector pMCSG19, the E. coli BL21 carrying plasmid pRK1037 is added to the LIC mixture. After the heat shock and recovery steps are completed, the mixture is streaked onto 48-well agar plates with 150 μg/mL ampicillin and 30 μg/mL kanamycin.
DNA polymerase treated PCR fragments can also be introduced into different LIC compatible vectors with the exception of the C-terminal His-tag vector series, pMCSG28 and pMCSG32 [32]. These vectors are prepared in the presence of dATP and their PCR fragments dTTP, respectively.
3.1.1. PCR reaction (reagent mixes are defined for a single 96-well plate)
1000 μL of PCR quality water
2500 μL of 5 M betaine
500 μL of 10X PCR Buffer for KOD Hot Start DNA Polymerase (Novagen, Madison, WI)
500 μL of dNTP Mix (2 mM each)
300 μL of 25 mM MgSO4
0.5 μM of each forward and reverse primers
100 μL of KOD Hot Start DNA Polymerase (1.0 U/μL)
DNA template (1 μg)
3.1.2. PCR fragment purification
QIAquick 96 PCR Purification Kit (Qiagen, Inc., Valencia, CA)
3.1.3. PicoGreen assay
1:200 diluted Quant-it PicoGreen dsDNA reagent (Invitrogen/Molecular Probes, Eugene, OR)
3.1.4. LIC mixture for 100 reactions (2.5 μL of purified PCR product plus 37.5 μL of the following)
3157 μL of PCR quality water
400 μL of 10X NEBuffer 2
100 μL of 100 mM dCTP (pH 7.0)
20 μL of 1 M DTT solution
40 μL of 100X BSA (10 mg/mL Bovine Serum Albumin)
~100 units of T4 DNA Polymerase (New England Biolabs Inc.)
3.1.5. Vector annealing and cell transformation
250 μL of T4 polymerase treated vector
5 mL of chemically competent E. coli BL21-derivative cells
3.1.6. Bacterial growth and expression analysis
100 mL of LB media (150 μg/mL ampicillin, 30 μg/mL kanamycin)
400 mL of M9 salts “pink” medium (see section 4.1.2) [12] (150 μg/mL ampicillin, 30 μg/mL kanamycin)
10 mM Isopropyl-β-D-thiogalactopyranoside (IPTG) in M9 salts “pink” medium (see section 4.1.2) [12]
25 mL of lysis buffer: 50 mM HEPES pH 8.0, 500 mM NaCl, 5% glycerol, 20 μL of ReadyLyse lysozyme solution (Novagen, Madison, WI), and 20 μL of Benzonase nuclease (Novagen, Madison, WI)
3.1.7. Evaluation of the protein expression and solubility levels
A single colony is picked and grown overnight in 1 mL LB media with 150 μg/mL of ampicillin and 30 μg/mL of kanamycin at 37°C. The following morning, 120 μL of overnight culture is transferred to 48-well culture plates containing 4 mL of “pink” media, the remaining LB culture is used for plasmid purification. After reaching OD600=1 (~3 hours of incubation at 37°C, 270 rpm), the 48-well plates are cooled down to 19°C and IPTG is added to a final concentration 0.4 mM. The culture is grown for an additional 16 to 20 hours at 19°C, 270 rpm. The 48-well plates are then spun down, the supernatant is discarded, and the pellets are re-suspended in 100 μL of buffer A (lysis buffer, 20 mM imidazole, 10 mM β-mercaptoethanol (β-ME)). The plates are cryo-cooled in liquid nitrogen for about 10 minutes followed by batch sonication. After sonication and thawing, a stock solution containing 20 μL of lysozyme and 20 μL of Benzonase (Novagen) in 15 mL of buffer A is prepared and 150 μL of this solution are added to each well. Plates are then incubated at 26°C, 200 rpm. After 90 minutes of incubation, disrupted cells are transferred from 48- to 96-well plates. At this point, expression samples are collected. The 96-well plates are spun at 3,200 g for 60 min. The supernatant is mixed with Ni Sepharose and applied onto a 1 μm 96-well filter plate. Any unbound sample is washed out by 3 spinning/washing cycles of 250 μL at 50 g. In the next step, 100 μL of elution buffer (500 mM imidazole in lysis buffer, TEV protease 0.2 mg/mL) is added to each well and the plate is incubated at 22°C for 24 hrs. The filter plate is spun down the following day and the collected samples are analyzed by polyacrylamide gel electrophoresis (SDS-PAGE) under denaturing conditions for the presence of the protein of interest.
4. Fermentation
The high-throughput production and purification of proteins require a facility that can handle a large number of fermentations per week, has equipment to prepare and filter-sterilize growth media, and uses simple fermentation vessels. This approach can yield several thousand fermentations a year. Producing cell mass is labor intensive and therefore expensive. Recently developed high cell density bacterial growth in flasks can reduce the fermentation volume an order of magnitude, without sacrificing protein yield and quality.
4.1. Methods: growing cells
4.1.1. Production of native proteins
Freshly transformed cells are grown overnight in LB. The starter cultures are grown at 37°C in 500 mL polyethylene terephthalate beverage bottles containing 40 mL LB supplemented with ampicillin and kanamycin (100 μg/mL and 30 μg/mL, respectively). When the OD600 reaches 0.8–1.0, the cultures are transferred to 2-liter polyethylene terephthalate beverage bottles [31] containing one liter of LB with ampicillin and kanamycin (100 μg/mL and 30 μg/mL, respectively). The cultures are then grown at 37°C to an OD600 of 1.0, at which time the temperature is dropped to 20°C and protein synthesis is induced by the addition of 0.4 mM IPTG. Cells are harvested the next morning, suspended in lysis buffer containing 50 mM HEPES pH 8.0, 500 mM NaCl, 5% (v/v) glycerol, 10 mM imidazole, and 10 mM β-ME as well as 1 mg/mL lysozyme and DNase (ReadyLyse lysozyme and Benzonase, respectively, Promega, Inc.) and a protease inhibitor cocktail tablet (Complete, Roche) per 2 grams of wet cell paste for 30 min at 4°C, then cryo-cooled and stored at -80°C.
4.1.2. Production of isotopically enriched proteins
To produce selenomethionine-substituted protein, cultures are grown in 2-liter polyethylene terephthalate beverage bottles [36] containing one liter of non-sterile modified M9 salts “pink” medium supplemented with glucose, glycerol, amino acids, trace metals and vitamins to increase the cell yield [12]. Amendments are, per liter: glycerol, 5 g; glucose, 4.4 g; non-inhibitory amino acids (L-glutamate, L-aspartate, L-arginine, L-histidine, L-alanine, L-proline, L-glycine, L-serine, L-glutamine, L-asparagine, and L-tryptophan), 200 mg each; trace metal mixture (EDTA, 5 mg; MgCl2*6H2O, 430 mg; MnSO4*H2O, 5 mg; NaCl, 10 mg; FeSO4*7H2O, 1 mg; Co(NO3)2*6H2O, 1 mg; CaCl2, 11 mg; ZnSO4*7H2O, 1 mg; CuSO4*5H2O, 0.1 mg; AlK(SO4)2, 0.1 mg; H3BO3, 0.1 mg; Na2MoO4*2H2O, 0.1 mg; Na2SeO3, 0.01 mg; Na2WO4*2H2O, 0.1 mg; NiCl2*6H2O, 0.2 mg); ampicillin, 50 mg; kanamycin, 30 mg; thiamine 1 μg; and vitamin B12, 2.7 μg [12]. Media components other than glycerol were supplied as aliquots of mixed solids in foil packets or as concentrated stock solutions by Orion Enterprises, Inc., Northbrook, IL (catalog numbers MD045004A, MD045004B, MD045004C, and MD045004E). Cultures are grown at 37°C to an OD600 of 1-2. Inhibitory amino acids (25 mg each of L-valine, L-isoleucine, L-leucine, L-lysine, L-threonine, L-phenylalanine), 15 mg of selenomethionine (Medicillin, Inc., catalog number MD045004D), and 1 mM IPTG are added, at which the temperature is dropped to 18°C. The cultures are incubated overnight, harvested the next morning, suspended in lysis buffer and lysed in the presence of lysozyme, DNase (ReadyLyse lysozyme and Benzonase, respectively, Promega, Inc.) and a protease inhibitor cocktail tablet (Complete, Roche) per 2 grams of wet cell paste by sonication. Proteins are purified per established protocols [29].
5. Protein production in milligram-scale
For a majority of biochemical experiments, protein samples are not only needed of sufficient quantity but also in high quantity. Typically, milligram quantities of homogeneous material are needed. Protein samples must be soluble, highly homogeneous, chemically and conformationally free of critical contaminants (especially proteases, metals, and lipids). Traditionally, proteins were prepared from natural sources using time-consuming and often expensive multi-step purification schemes that exploited specific properties of the macromolecules. A large number of important proteins remained outside the reach of functional and structural studies because of very low in vivo levels of expression. The recombinant technology to express foreign genes in bacteria, yeast, mammalian, and insect cells has been well developed. In addition, highly efficient over-expression vectors and strains have significantly simplified purification procedures. This approach was further refined by the use of affinity tags and the development of new hardware and protocols. Today it is not uncommon to produce 10-20 mg of pure protein from a few grams of bacterial cell paste in a single purification step in a matter of a few hours.
The MCSG standard purification protocol has been designed for His6-tagged proteins and implemented on a new semi-automated chromatography system that can purify up to four proteins per purification unit at a time with minimal human involvement. Batches of different proteins can be purified in parallel using IMAC and buffer exchange columns. After a single-step IMAC-purification, the purity of proteins is typically above 85-95% as judged by SDS-PAGE. After IMAC-I, the fusion tag can be cleaved with a highly specific recombinant His7-tagged TEV protease. This cleavage produces a protein with three amino acids (SNA) added to its N-terminal portion. In the next purification step (IMAC-II, see below) the cleaved protein can be purified from the released His6-tag, undigested protein, persistent endogenous E. coli proteins having affinity for IMAC column, and the His7-tagged protease using a second round of IMAC purification. The entire protocol is easily scalable to 16 proteins per day and ~2,000 proteins per year on a four unit ÄKTAxpress system.
5.1. Methods: protein purification
Purification starts from preparation of crude extract (or lysate) followed by two affinity chromatography steps.
IMAC-I using a Ni+2-charged column.
Buffer exchange on a desalting column.
His6-tag cleavage using the recombinant TEV protease.
IMAC-II using a Ni+2-charged column.
Buffer exchange and protein concentration.
Throughout the purification process the following buffers are used:
Lysis buffer: 50 mM HEPES pH 8, 500 mM NaCl, 5% glycerol, 10 mM β-ME, 10 mM Imidazole,
Desalting buffer: 50 mM HEPES pH 8, 500 mM NaCl, 5% glycerol, 10 mM β-ME
Elution buffer: 50 mM HEPES pH 8, 500 mM NaCl, 5% glycerol, 10 mM β-ME, 250 mM Imidazole
Crystallization buffer: 20 mM HEPES pH 8.0, 250 mM NaCl, 2 mM DTT
The following detailed procedures are used by MCSG.
5.1.1. Preparation of the crude extract
Cell lysates are prepared by re-suspending isolated cell pellets in approximately five volumes of lysis buffer with protease inhibitors (Complete; Roche) and sonicated on ice for 5 minutes (4 sec on and 20 sec off cycles) in the presence of 1 mg/mL lysozyme. Lysis buffer contains 50 mM HEPES buffer that is maintained at pH 8 for optimal binding to the Ni+2 column. It also includes a small amount of imidazole (10 - 20 mM) to reduce non-specific binding of bacterial proteins to the Ni+2 column, 5% glycerol and 10 mM β-ME to preserve target proteins in stable and reduced forms. A high concentration of salt (500 mM NaCl) in the lysis buffer also reduces nonspecific binding by impurities and enhances protein solubility. Sonicated samples are clarified by centrifugation at 30,000 × g for an hour followed by filtration through 0.45 μm syringe filters.
5.1.2. IMAC-I and buffer exchange steps
All chromatography experiments are performed at 4°C (Figure 4). The crude extract, typically 15–50 mL, of a target protein is applied slowly with a maximum of 1 mL/min flow rate onto a pre-equilibrated (with lysis buffer) 5 mL HisTrap chelating HP column (GE Healthcare) charged with Ni+2. The column is then washed with 25 column volumes (CV) of lysis buffer in order to remove contaminating endogenous E. coli proteins. The protein is first eluted into a 10 mL loop with the elution buffer, then applied onto a 53 mL HiPrep 26/10 desalting column (GE Healthcare) pre-equilibrated with the desalting buffer. The buffer exchange step is introduced to prepare the protein sample for the cleavage with TEV and a subsequent IMAC-II procedure. Prior to injection of the protein onto the desalting column, 2 mL of 5 mM EDTA in desalting buffer are injected onto the desalting column to create a slow-moving EDTA zone - to sequester any Ni+2 ions released from the chelating column. The buffer exchange step is run at a flow rate of 8 mL/min.
Figure 4.
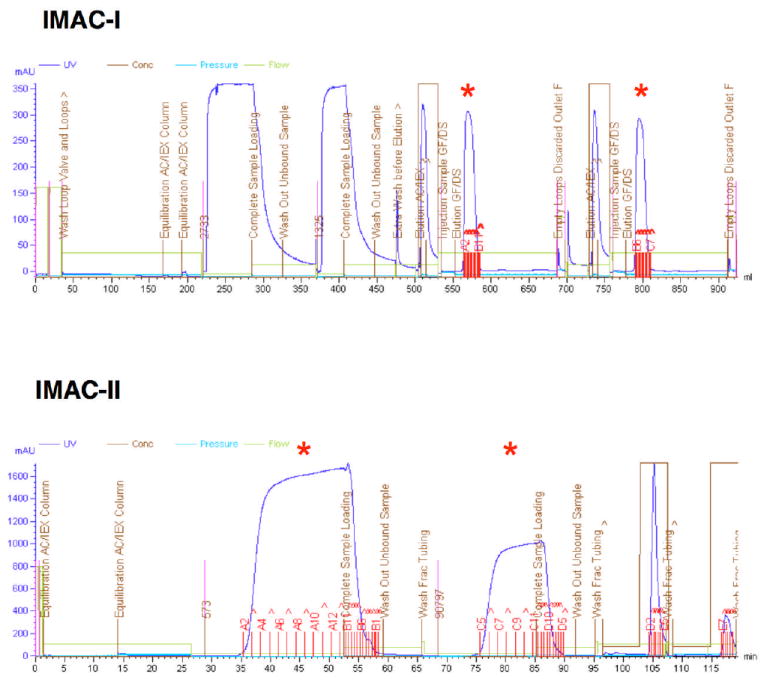
Purification of two His6-labeled proteins on IMAC-I (top) and IMAC-II after cleavage with TEV protease (bottom). Red asterisks show collected protein peaks.
The desalting column is washed and re-equilibrated prior to the next purification cycle. The tubing and loop are washed between chromatography steps to avoid cross-contamination. The final peak fractions and all solutions that could contain the target protein are collected and analyzed by SDS-PAGE. Throughout the purification process, several parameters including UV absorbance, pressure, flow-rate, pH, and ionic strength are automatically monitored and recorded. All fractions are analyzed and documented. The entire IMAC-I purification process takes less than 16 hours for four proteins, depending on the initial sample volumes. The chelating columns are recycled six to seven times using a semi-automated procedure by metal stripping with 50 mM EDTA and charging with 100 mM NiSO4.
5.1.3. Affinity tag removal by TEV protease
Three proteases (human thrombin, factor Xa from bovine plasma, and recombinant TEV protease) were tested for efficiency of tag removal using standard protocols suggested by the manufacturers. After evaluating the efficiency of tag cleavage, level of nonspecific cleavage, optimum temperature, and the fraction of successfully processed proteins, the TEV protease was chosen as the most suited for the MCSG targets (Table I). TEV protease offers several advantages:
-
▪
It is highly specific, recognizing a seven amino acid sequence.
-
▪
It shows virtually no nonspecific proteolysis of target proteins.
-
▪
It is active under a wide range of conditions, including low temperature (4°C), broad range of pH, and high ionic strength [37].
-
▪
A His7 tagged version can be easily separated from the cleaved protein.
Table I.
Efficiency of His-tag cleavage by TEV protease.
| % of cleavage | ≥80% | <80–50% | 0% |
| Number of proteins* | 200 | 31 | 8 |
Proteins (239 total) were incubated with a 1:50 ratio of protease to target protein at 4°C for 16–24 h.
The TEV protease typically used in the MCSG pipeline was expressed from vector pRK508 (70 mg from 1 L of LB, expressing autoinactivating native enzyme), which carried a noncleavable His7-tag (a gift from Dr. D. Waugh, NCI). It is purified using a procedure described previously [38] and was removed from protein samples by IMAC purification. It is worth noting that the TEV protease is highly effective at removing His6-tags from more than 96% of tested MCSG target proteins (Table I). More recently, the MCSG started utilizing a construct of His7-tagged TEV protease expressed from a pMHT238delta plasmid (University of Wisconsin-Madison). This plasmid carries several mutations that improve TEV solubility and resistance to autoinactivation and produces high levels of the enzyme (130 mg from 1 L of LB media).
5.1.4. IMAC-II and buffer-exchange steps
Proteins purified by IMAC-I and buffer exchanged are treated with the His7-tagged-TEV protease to remove the His6-tag for up to 72 hours at 4°C (Figure 4). The cleavage is monitored by SDS-PAGE. After the cleavage, the reaction mixture containing the target protein (sometimes as a mixture of cleaved and uncleaved species), His7-tagged-TEV protease, and His6-tag is applied to a 5 mL Ni affinity column (GE Healthcare) and the column is washed with 3 CV of lysis buffer. The cleaved protein elutes as a flow-through. The fractions containing the protein are pooled and dialyzed against the crystallization buffer. The purification process described above typically yields high purity (> 95%) protein samples (Figure 5). Prior to crystallization, the proteins are concentrated using Amicon Ultra centrifugal concentrators (Millipore).
Figure 5.
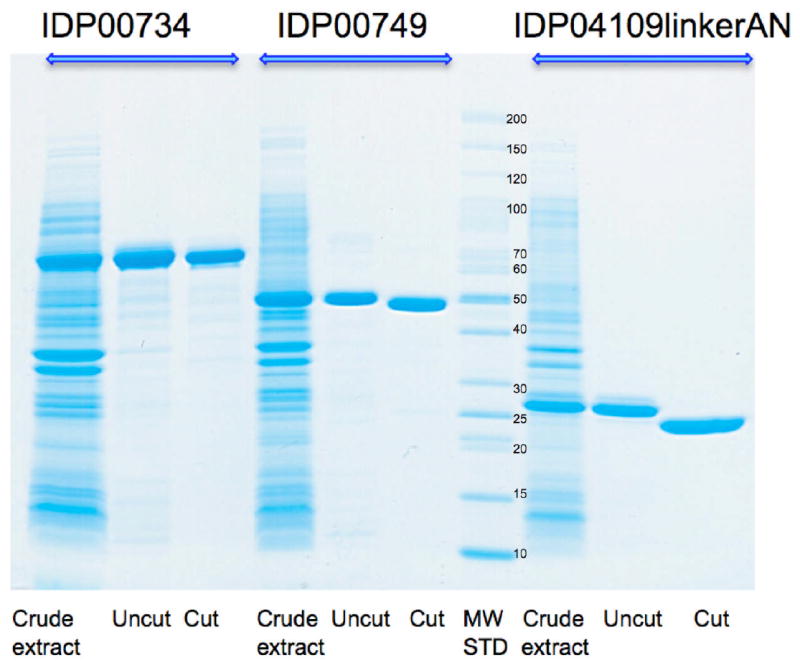
SDS-PAGE of three CSGID proteins purified from crude extract using IMAC-I and IMAC-II. Molecular weight markers (EZ Run, from Fisher Scientific) are shown next to the protein bands.
5.1.5. Protein purification using size exclusion chromatography (SEC)
In cases where protein aggregation is suspected, protein exhibits poly-dispersity or protein/protein complexes are present, purification of a single oligomeric state may be critical. In such cases, the buffer exchange step after IMAC-I or after IMAC-II is replaced with preparative SEC. This single step preparative SEC can be applied on any commercial purification workstation or with a simple pump system. We have developed protocols for ÄKTAexplorer and ÄKTAxpress workstations. The separation is typically carried out at 4°C using a Superdex 200 HiLoad 26/60 GE Healthcare column at a flow rate of 2.0 mL/min with the crystallization buffer as a running buffer. The column is calibrated with molecular weight standards prior to protein runs. The standard protocol involves the following steps:
The column is pre-equilibrated with 320 mL of Crystallization Buffer containing 20 mM HEPES pH 8.0, 250 mM NaCl, 2 mM DTT at 4°C at a flow rate of 2.0 mL/min.
The sample is loaded onto the column at 4°C at a flow rate of 2.0 mL/min and is collected in 1.8 mL fractions.
The column is washed with 360 mL of Crystallization Buffer at 4°C at a flow rate of 2.0 mL/min and peak fractions containing protein samples are detected by the UV of the ÄKTA workstation and are collected in 96-well 2 mL-deep well blocks.
The chromatogram is analyzed, the most homogenous fractions are pooled, and the protein concentration is measured using UV/VIS or Bradford assay. The purified protein is concentrated using the procedure described in section 5.1.4.
5.1.6. Platform for semi-automated multidimensional chromatography
The MCSG has collaborated with Amersham Biosciences (now GE Healthcare) to develop the ÄKTA multidimensional semi-automated chromatography. The procedures are implemented on an ÄKTAxpress purification workstation capable of purifying 4 different proteins per purification unit. Each workstation has 5 column positions, four for affinity columns (such as a 5 mL Histrap, GE Healthcare) and one buffer-exchange column (HiPrep 26/10 desalting, GE Healthcare) or size exclusion chromatography column (Superdex 200 26/60, GE Healthcare). There are 5 loops available to store protein peak fractions from the Ni-affinity chromatography step before the protein is loaded onto the desalting column. The final purified protein is collected in 1.5–2.0 mL fractions in a 96-well deep-well block. Both IMAC-I and IMAC-II steps described above are performed on ÄKTAxpress workstation units (Figure 4).
5.1.7. The use of C-terminal His6-tag vectors for protein expression
Despite the success in using the N-terminal His-tag to obtain large quantities of high quality protein samples, there are cases where this tag produces poorly diffracting crystals or fails to produce any protein crystals. In such cases, the target protein can be recloned into the His6-tag C-terminal vector [32] to be repurified. The specific cases where the protein is a candidate for recloning into the C-terminal vector are listed below:
The N-terminal His-tag is 100% uncleavable due to steric hindrance. The tag may also influence protein folding and/or affect protein conformation preventing crystal formation.
The N-terminal His-tag is partially cleavable. The resulting protein sample contains a mixture of species with cut and uncut His-tag. This mixture can usually be separated during IMAC-II if the protein exists as a monomer. For proteins existing in higher oligomeric states, the obtained sample can sometimes contain oligomers composed of different combinations of the cleaved and uncleaved monomers that cannot be separated. This results in heterogeneity that prevents the formation of good quality crystals.
The protein sample is heterogeneous due to C-terminal truncations associated with alternative termination or degradation. Producing such protein from the C-terminal His-tag vector enables separation of the full length construct from the truncated species.
The presence of the 3 additional amino acid residues (SNA) at the N-terminus influences protein folding, solubility, or oligomerization. Based on the experimental data collected by the MCSG, this happens very rarely, but in some isolated cases it could produce a negative effect, such as preventing proper packing of protein molecules in the crystal.
In the MCSG and CSGID pipelines, out of a set of 79 targets recloned into the pMCSG28 C-terminal vector, 59 were very soluble and purified well, and resulted in 11 structures (18.6%) thus proving that this strategy can be a good salvage pathway in addition to the standard N-terminal tagging approach and can be effectively used in conjunction with other salvaging approaches.
An alternative to the C-terminal tag is the N-terminal linker between the TEV recognition site from SNA to SNAAN using a modified F-primer for a pMCSG7 compatible group in order to improve TEV cleavage efficiency.
5.2. Protein storage
Protein samples can lose activity and undergo denaturation due to oxidation, heat or other factors. Therefore, proteins must be preserved to assure quality. This is one of the key elements of large-scale protein production where hundreds of proteins are produced per week. Samples purified in milligram quantities can be cryo-cooled directly in liquid nitrogen and stored at -80°C or liquid nitrogen temperatures for long periods of time without losing activity. At the MCSG and CSGID, concentrated protein solutions are pipetted dropwise directly into liquid nitrogen and collected into labeled tubes. The 30-50 μL droplets can be easily thawed and used for subsequent crystallization trials or in biochemical experiments keeping the bulk material intact.
6. Protein characterization
Proteins are characterized at different stages of the purification process using a variety of methods. The biochemical and biophysical characterization of expressed gene products usually includes methods such as: UV/VIS spectroscopy, SDS-PAGE or microfluidic capillary electrophoresis, analytical size exclusion chromatography (ASEC), mass spectroscopy, dynamic and static light scattering, circular dichroism spectroscopy and X-ray spectroscopy. Table II lists methods that are typically used at the MCSG. Several of these methods will be presented below (because SDS-PAGE and UV/VIS spectrometry are universally used by research laboratories and have been extensively described by others (May, #157), they will not be included here).
Table II.
Typical protein characterization methods.
| Protein Parameter | Method of Characterization |
|---|---|
| Purity | SDS-PAGE stained with Coomassie Brilliant Blue and lab-on-the-chip 2100 Bioanalyzer (Agilent) |
| Concentration | Protein assay and UV/VIS spectrometry |
| Sizes, oligomeric states, Poly-dispersity | Light scattering (Dawn Heleos, Optilab rex, DynaPro Plate Reader, Wyatt) |
| Estimated molecular weight in solution | Size exclusion chromatography |
| Suspected chemical heterogeneity and bound ligands | Mass spectrometry (MALDI-TOF Biflex III, Bruker; LC/MS/MS QSTAR XL quadrupole TOF, ABI) |
| Bound ligands spectra | UV/VIS spectrometry |
| Function | Activity assays |
6.1. Analytical size exclusion chromatography
The key requirements for any structural biology effort are the high quality and milligram quantities of protein samples for crystallization and structure determination. Facing an overall success rate of ~12% from protein expression to structure determination, the most crucial issue is how to screen, characterize and identify good protein samples for structure determination at an early step in the protein production pipeline. ASEC can provide the specific peak profile of each protein based on its degree of aggregation and purity. Early identification of structural biology grade protein by ASEC is a fast and efficient approach to identify proteins suitable for crystallization and structure determination [39]. This can, in turn, increase protein structure throughput and reduce costs. At the MCSG, we have implemented a semi-automated ASEC on a DIONEX HPLC instrument equipped with a temperature-controlled autosampler. The MCSG ASEC setup uses a Sepax SRT SEC-150 column (7.8 × 250 mm) that enables automatic processing of 192 protein samples in two 96-well plates at 17 min per sample. High quality chromatographic profiles are obtained with as little as a 50 μg protein sample. Hundreds of protein samples were screened and their ASEC profiles were analyzed. The implementation of ASEC screening is applicable to crystallization projects, including those in smaller labs as well as large-scale structural genomics efforts. At the MCSG and CSGID, a crystallization buffer solution containing 20 mM HEPES pH 8.0 and 250 mM NaCl is sparged with high quality helium gas. Approximately 25 μL of 2–5 mg/mL protein sample, after being 0.2 μm-filtered or centrifuged (14,000 rpm for more than 5 minutes), is applied for analysis. Each chromatographic run takes 14 minutes at a 1.0 mL/min flow rate, requiring a total of 17 minutes to complete a run. During the separation, the UV 280/260nm absorbance is monitored and recorded. ASEC is an important method in predicting how well proteins behave in crystallization trials:
-
▪
A single sharp peak is an excellent indicator for protein crystallization.
-
▪
An early ASEC screening in the pipeline can quickly identify unusual protein behavior and gives useful guidance for further processing.
-
▪
ASEC applied in the monitoring of the HTP purification pipeline can significantly improve the success rate of protein crystallization and structure determination.
In some cases, persistent contaminants must be removed by additional chromatographic step(s) such as SEC or ion exchange chromatography. SEC as an additional step is more commonly used because it has more universal applications and enables separation of impurities from the target protein as well as large aggregates which elute near the void volume. The elution profile provides an indication not only about the purity but also the primary oligomeric states of the target protein, which has biological significance. When SEC is used, it is also essential to closely examine any peaks that appear later in the elution profile, which might reflect small organic molecules that could be weakly bound ligands (Figure 6).
Figure 6.
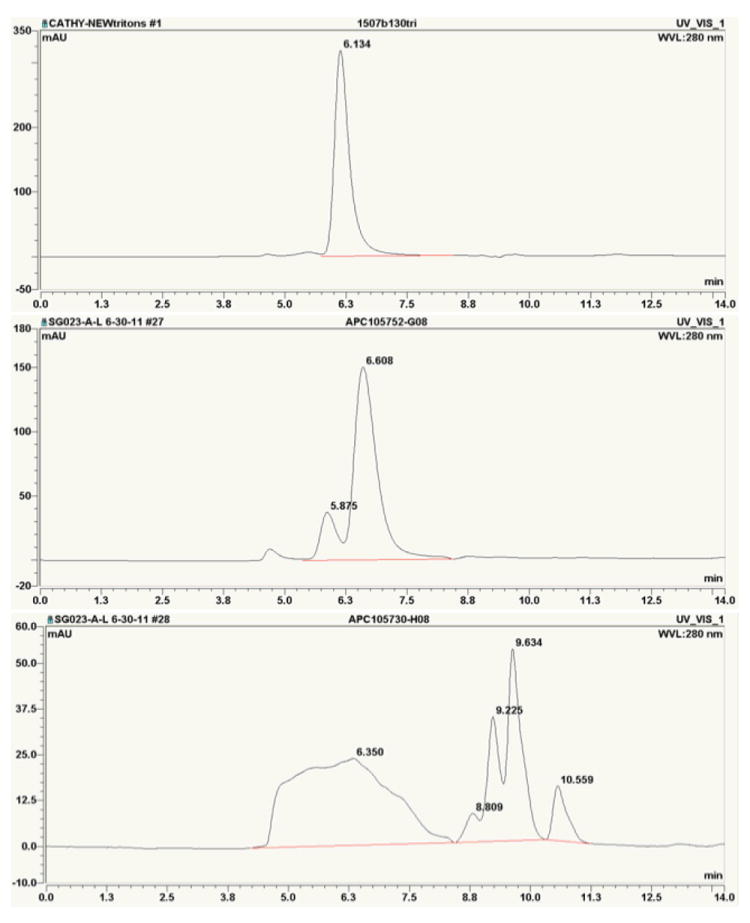
Examples of ASEC separations of three proteins showing progressively higher (from top to bottom) levels of heterogeneity. The chromatography experiments used a Sepax SRT SEC-150 column (7.8 × 250 mm) on a DIONEX HPLC equipped with an AS temperature controlled autosampler housing two 96-well plate sample racks, GP50 Gradient Pump, and PDA-100 Photodiode Array Detector. The chromatography of 20–25 μL sample was run at 1.0 mL/min using buffer containing 20 mM HEPES pH 7.5 and 250 mM NaCl.
SEC provides an estimated molecular weight/size of a protein in solution based on the protein diffusion coefficient and comparison with protein standards of known molecular weight.
6.2. Dynamic Light Scattering
Dynamic light scattering (DLS) or quasi-elastic light scattering (QEL) provides insight into the dynamic properties of soft materials by measuring single scattering events [40]. With monochromatic and coherent light, usually a laser, a time-dependent fluctuation in the scattering intensity is measured as the small particles in solutions are undergoing Brownian motion. This scattered light then undergoes either constructive or destructive interference by the surrounding particles within this intensity fluctuation. The dynamic information, in this case translational diffusion coefficient, of the particles is derived from an autocorrelation of the intensity trace. The hydrodynamic radius Rh, the radius of a sphere with the same diffusion coefficient as the protein sample (lower limit ~0.5 nm), is then calculated. Rh depends only on the physical size and size-related behavior (e.g. diffusion, viscosity) of the molecule but is not affected by density or molecular weight. DLS provides critical information on the distribution of a single (monomodal) or multiple (polymodal) species in protein or protein-complex solutions [41]. At the MCSG and CSGID, the DynaPro Plate Reader is used to automatically screen up to 1,536 different proteins, buffer conditions, or ligands for optimum crystallizations in varying temperatures between 4°C and 70°C. It requires only 15–20 μL of filtered (0.1 μm or smaller) or centrifuged (at least 14,000 rpm for 5 minutes or longer) 0.1–0.5 mg/mL samples. Figure 7 shows typical DLS experimental results.
Figure 7.
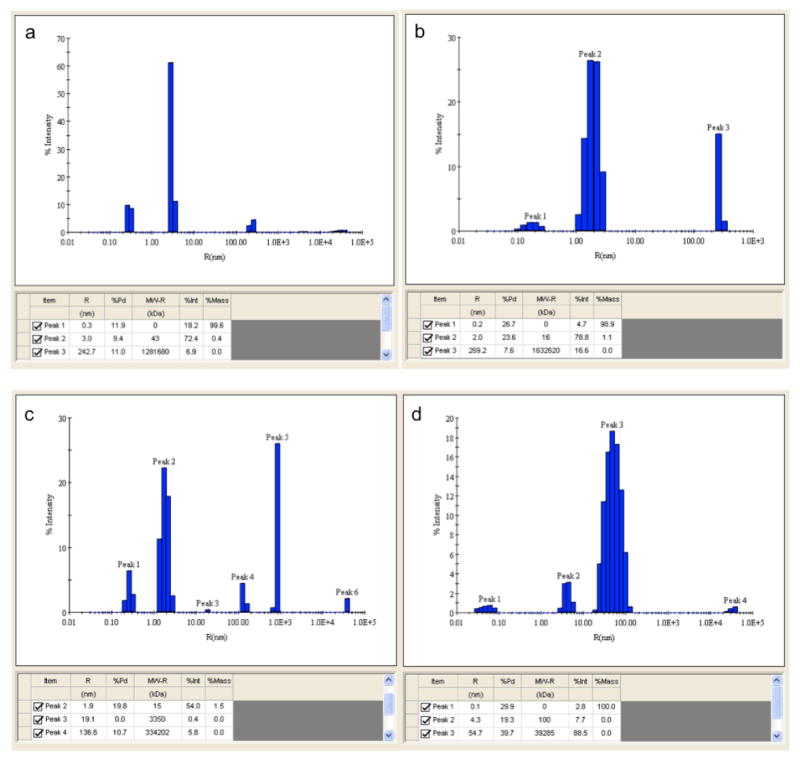
Examples of DLS regularization plots obtained for four different protein samples showing progressively higher heterogeneity and aggregation (from a to d). These plots show the distribution of different-size species with their compositions in hydrodynamic radius Rh (nm, x-axis) and % intensity (scattered light, y-axis). Polydispersity (Pd, %) and estimated molecular weight (kDa) are also shown in the table. In general, a %Pd of 15 or less is considered mono-dispersed and most un-aggregated proteins have an Rh of between 1–10 nm. In plot a, a mono-dispersed (9.4% Pd) un-aggregated protein (3 nm, 43 Kda) contributes to most of the scattering; in plot b, most of the intensity is raised from a less mono-dispersed (23.6%) but un-aggregated protein; plot c shows a non-homogenous sample as several different kinds of species, some un-aggregated, others aggregated, but most of them are mono-dispersed; and in plot d, most species are aggregated and poly-dispersed. The experiments used the DynaPro Plate Reader and the analyses were done by dynamics 6.10 software (Wyatt Technology).
6.3. Static Light Scattering
Static light scattering (SLS) is a technique that measures the intensity of the scattered light, typically using a high intensity monochromatic light that is usually a laser, at many angles to calculate the root mean square (RMS) radius, sometimes referred to as the radius of gyration, Rg. By measuring the scattering intensity for many samples of various concentrations, the second virial coefficient, A2, can also be calculated [42, 43]. With the controlled parameters of an experiment, it is possible with a light scattering measurement to retrieve the molar mass (M), size (rg), and second virial coefficient (A2). RMS as measured by multi angle light scattering (MALS) is shape-independent. No assumptions of molecular shape or conformation whatsoever are necessary to obtain the RMS from MALS data. SLS provides the measurement of several important protein parameters:
-
▪
Molar mass, Mw
-
▪
Size or RMS radius (Rg) (mass-averaged distance of each point in a molecule from the center of gravity (lower limit 10 nm)).
-
▪
Second virial coefficient, A2
At the MCSG and CSGID, sizes of more specific oligomeric forms of proteins and protein complexes are measured using the MALS device Dawn Heleos and the refractive index Optilab Rex with Astra software (Wyatt Technology) for more comprehensive analyses.
By comparing the Rh, measured by QELS, to Rg, measured by static MALS, we may learn about the compactness of a molecule. For compact objects, the mass is close to the center of mass. For an extended object, such as a star polymer, the Rg is strongly influenced by the outlying masses but the Rh is less strongly influenced. The ratio of Rg to Rh increases as the object becomes less compact.
7. Protein crystallization
The MCSG has implemented semi-automated crystallization screening and crystal visualization approaches. The overall goal of the MSCG crystallization effort is to obtain X-ray–quality crystals for as many different proteins as possible. The MCSG currently yields macroscopic crystals for 23.5% of purified proteins.
Over the last ten years, many commercially available screens have been used in the MCSG crystallization screening, including Index, SaltRx, PEG/Ion, PEGRx, Crystal Screen, Crystal Screen Lite, and Crystal Screen Cryo from Hampton Research Inc.; Wizard and Cryo screens from Emerald Inc.; the Classics, Classics Lite, Cryos, PEGs II, pHClear screens from Qiagen, and others. Some of these conditions have been repeatedly used over 2,200 times and, for each condition, crystals appeared between 1 to 26 times. We have ranked the frequency at which crystals appeared (frequencies of 0.0381 to 0.0009). We analyzed the crystallization data and ranked the conditions that produced crystals. We eliminated all conditions that have never yielded crystals for MCSG proteins and included many conditions that proved to be reliable. This allowed us to design four crystallization screens with 384 conditions for a large set of highly diverse proteins from microbial and eukaryotic sources (Figure 8). The MCSG-1 screen is ranked highest among the four screens, while the MCSG-4 screen contains less frequent crystal-yielding conditions. The crystallization conditions cover buffers with pHs ranging from 4.2 to 10.5, polymers (PEG 400 to PEG 8,000), salts (such as sodium chloride, ammonium sulfate, calcium, zinc, and magnesium), organics (such as dioxane, polyacrylic acid, and Jeffamine), alcohols (such as ethanol, isopropanol, 1,4-butanediol, pentaerythritol propoxylate, and 2-methyl-2,4-pentanediol), and additional combinations of PEGs and salts. All four screens cover a wide variety of chemicals (Figure 9).
Figure 8.
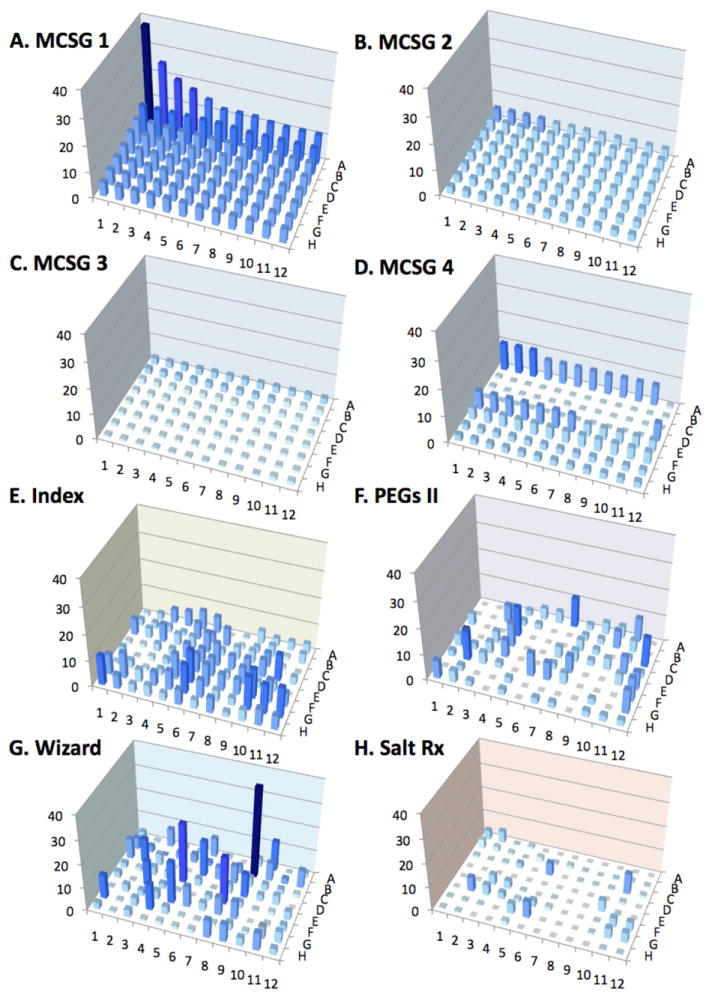
Frequency of crystal appearance for different crystallization screens. This figure shows the frequency of crystals from different screens (vertical Z axis in ‰) vs 96 crystallization formulations (horizontal XY axis) using statistics from ten years of crystallization setups at MCSG. The top four screens were designed by the MCSG (MCSG-1,-2,-3,-4). The bottom four screens are commercially available screens most frequently used at MCSG. The frequency is shown by the shade of blue color (higher frequency corresponds to the darker shades of blue, while lower frequency corresponds to the lighter shades of blue).
Figure 9.
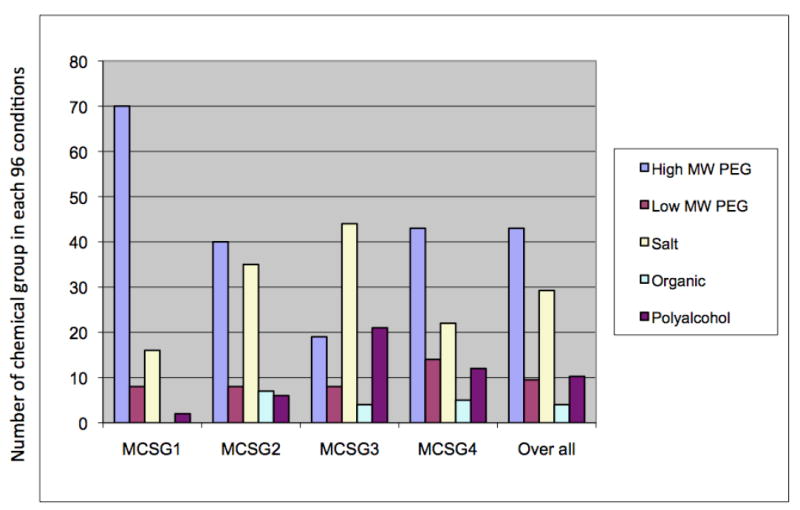
The types of precipitants in MCSG screens. We analyzed the four screens designed by MCSG and found that they are very diverse with respect to types of precipitants. Screens are classified by five groups of precipitants: high MW PEG, low MW PEG, salt, organic chemicals, and polyalcohols. While all four screens contain the major groups of precipitants, each screen has differing amounts. MCSG-1 contains high MW PEG, both MCSG-2 and MCSG-3 contain salt, MCSG-3 -contains polyalcohols, and MCSG-4 - contains low MW PEG.
The four MCSG crystallization screens are now available from Microlytic, Inc. The compositions of all MCSG screens are available on the MCSG web site (www.mcsg.anl.gov). Our standard screening procedure uses 4 screens (MCSG-1 – MCSG-4) and requires about 2-8 mg of protein at 10-40 mg/mL concentrations at a given crystallization temperature. Additional multiplexing is introduced by incubating at 4°C, 16°C, and 24°C in Robohotels (Rigaku). For proteins that are less than 1 mg, the volume of the droplet is reduced from 800 nL to 400 nL. The barcoded plates are screened on a user-defined schedule using a Minstrel III microscope (Rigaku) and the data is stored in a dedicated Oracle database.
Crystal optimization is aided by a robotic liquid handling system for protein crystallization (Alchemist™ II; Rigaku). Solutions covering all crystallization conditions can be prepared in most crystallization plates using the Alchemist™ II. The CrystalTrak software (Rigaku) is used to develop optimization screens based on three strategies:
Component variation, a traditional grid optimization screen based on a single set of parent conditions,
PBS cross (precipitant/buffer/salt), a combinatorial optimization screen based on two or more parent conditions, and
Cryo-additives, introduction of cryo-additives to crystallization conditions.
Small crystallization volumes tend to reduce equilibration times and increase the success rate [44, 45]. However, crystal volume is often critical for structure determination. Optimization approaches converting very small or low-quality crystals into useful diffracting crystals must be taken into consideration and must be adapted to high-throughput. The use of very small volumes has been explored and extensively tested with over 10,000 proteins at MCSG. We found that the optimal volume for crystallization of proteins for de novo structure determination is 800 nL (typically 400 nL of protein solution and 400 nL of precipitating agent). Over 60% of structures determined at MCSG were obtained from crystals produced during the initial screening.
Because a vast majority of X-ray diffraction experiments are carried out at cryo-temperatures, crystals must be crystallized under cryo-conditions or they must be cryo-protected before flash cooling. We have compiled published data for cryo-protecting X-ray diffraction quality protein crystals and combined it with the MCSG data. The resulting cryo-protection database is used to prepare initial cryo-solutions for crystal screening.
8. Crystallization salvage approaches
A frequent failure to obtain diffraction quality crystals, or any crystals at all, continues to be a major bottleneck for high-throughput structure determination pipelines. One of the strengths of our approach is the ability to test the possible “salvage” methods on a large set of sequence-diverse proteins and protein constructs. The MCSG has tested the efficacy of two such salvage methods, reductive methylation and in situ proteolysis, on hundreds of different proteins that were recalcitrant to structure determination. Below, we describe these two approaches that show a 7-8% success rate.
8.1. Methods: in situ proteolysis to aid crystallization
Obtaining suitable protein for structure determination often requires the modification of the protein itself. For example, removing unstructured regions of proteins can provide a considerable advantage in obtaining high-quality crystals. Partial proteolysis combined with tandem mass spectrometry (LS/MS/MS) has been used for more than two decades to define the optimal protein construct for protein expression and structure determination. On occasion, limited proteolysis during crystallization has also generated crystals suitable for structure determination. We have shown that the use of in situ proteolysis provides a path to significantly increase the success rate of protein structure determination for unmanageable proteins and it can be used as a routine crystallization salvage strategy [15, 46].
8.1.1. In situ proteolysis using α-chymotrypsin
Stock solutions of α-chymotrypsin (C3142, Sigma-Aldrich) are made up as follows: protease is dissolved in 1 mM HCl and 2 mM CaCl2 at a concentration of 1 mg/mL. Proteolysis of proteins with α-chymotrypsin is perfomed as described:
All proteins of bacterial and human origin are purified as previously described.
All proteins have an intact TEV-cleavable N-terminal His6-tag (MHHHHHHSSG VDLGTENLYF QSNA). The tag contains Tyr and Phe, which are chymotrypsin cleavage sites.
The prepared α-chymotrypsin solution is added to the purified protein (kept on ice) at a ratio of 1 μg chymotrypsin per 100 μg of protein (1:100), which is in a crystallization buffer (20 mM HEPES pH 8.0, 250 mM NaCl, and 2 mM DTT).
The samples are incubated at 4°C for 1-24 hours.
After the desired time of incubation, crystallization setup is performed in a sitting drop format, adding 400 nL of the protease/protein mixture to 400 nL of the mother liquor well solution.
Crystallizations are set up and carried out at 16°C without assessing the efficacy of the proteolysis, without stopping the proteolysis reaction, and without purification of any proteolyzed fragment.
Other proteases such as trypsin, thermolysin, subtilisin, and proteinase K can also be applied using the same procedure.
8.2. Methods: reductive methylation of protein surface
It is established that chemical modification of a protein can facilitate the crystallization and often crystals of chemically modified proteins diffract to higher resolution. One of such chemical modifications is reductive methylation of surface lysine residues. Reductive methylation can promote protein crystallization by altering protein surface properties and crystallization behavior. This modification is fast, specific, inexpensive, and requires few steps under relatively mild buffer and chemical conditions. The MCSG tested the efficacy of this method on the crystallization properties of several hundred novel protein targets that have previously failed to crystallize or produce X-ray quality crystals. Following the method originally described by the Rayment laboratory [18], the proteins were methylated and screened using our high-throughput crystallization pipeline [47]. Approximately 7% of these target proteins generated crystal structures that diffracted to a higher resolution as compared to the unmodified proteins. This method is well suited to high-throughput projects as well as regular laboratories.
8.2.1. Protein reductive methylation using dimethylamine-borane complex
The procedure for reductive methylation was adapted from the one described by Rypniewski et al. [18]. To reduce foaming and subsequent protein denaturation, the protocol was changed to a more gentle treatment with 1 M dimethylamine-borane complex (ABC) as the reducing agent.
Protein solution: 5–10 mg of purified protein at concentrations of 5–10 mg/mL was prepared in desalting buffer. Protein solutions are adjusted to a volume of 5 mL, at varying protein concentrations, but always below 10 mg/mL.
Reagents: all reagents and buffers are prepared fresh the day of experimentation: 1 M ABC, 1 M formaldehyde, 0.67 M glycine, 1 M DTT. All solutions are kept at 4°C or on ice as indicated.
Reaction: 40 μL of 1 M formaldehyde is added to 1 mL of protein solution and mixed gently. This is followed immediately by the addition 20 μL of 1 M ABC per 1 mL of protein solution and mixed gently. The solution is incubated at 4°C for 2 hours and the procedure is repeated. At the end of the incubation, an additional amount of 10 μL of ABC per 1 mL of protein solution is added. The solution is then incubated at 4°C overnight. The following day, 1 mg of glycine (final concentration of 13.3 mM from a 67 mM stock solution) and DTT (final concentration of 5 mM) are added to quench the reaction and the solution is left on ice for 2 hours.
The proteins are either buffer exchanged extensively by dialysis or purified by SEC (Superdex 200 26/60, GE healthcare) using buffer conditions described in section 5 and by Kim et al. [29]. In some cases, analysis of the SEC profile reveals reaction-induced changes in the oligomerization states of the protein.
The proteins are concentrated using Amicon Ultra centrifugal concentrators (Millipore) and screened for crystals using typical crystallization screens.
Using this procedure, the majority of lysine residues in the proteins are methylated as assessed by MS analysis (data not shown). However, in some cases when an X-ray structure of the reductively methylated protein is obtained, both methylated and unmethylated lysines are observed in the electron density map [47].
Summary
In the past 10 years, robust high-throughput structure determination pipelines have been established with the capacity to purify thousands of proteins and determine hundreds of protein structures per year. The structural genomics programs used genome sequencing data to select protein targets for structure determination. Because the number of previously uncharacterized targets was large (and expected to have different biochemical properties), the approach to gene cloning, protein production, crystallization and structure determination needed to be significantly altered. The approach to develop an efficient system for gene cloning, protein expression and purification at the scale of an entire genome is inherently different from classical methods. The high-throughput approaches involved processing numerous genes and proteins through standardized protocols that were not optimized for any given protein but worked reasonably well and can be applied to many samples. Because of the scale, the standardized protocols needed to be economically feasible and, in turn, it helped to reduce the cost of purifying and structure determination of many proteins.
The process of solving novel structures from clone to deposit provides a unique knowledge base. It enables the evaluation of pipeline element effectiveness and the elimination of approaches that produce sub-optimal results. As the protein progresses through the pipeline and is being evaluated, the probability of success and failure is estimated at each step enabling the decision making process. Similar approaches can be applied to “recalcitrant” targets in that they are moved to an alternative pipeline. This enables the development of methods that allow for protocols to be continuously redefined.
Genomic sequence data are increasingly available for many important organisms, including those that cannot be cultured in the laboratory [7, 10, 48]. Synthetic genes with codons optimized for expression in E. coli become more accessible to researchers allowing for the production [49], as well as functional and structural characterization, of many proteins not previously accessible. The use of automation and robotics is critical. Commercial instruments and reagents, developed based on high-throughput results, are largely available to the scientific community. This will allow considerable progress in studies of more complex systems involving many components, such as all proteins secreted by pathogens during the invasion of human or animal cells, finding new proteins from microbiomes for biotechnology applications, such as biofuels, and studies of systems allowing adaptation of our ecosystems to changing conditions.
Acknowledgments
We thank all members of the Midwest Center for Structural Genomics at the Argonne National Laboratory and the Center for Structural Genomics of Infectious Diseases at the University of Chicago for their help in conducting experiments. This work was supported by National Institutes of Health grants GM074942 and GM094585, Contract No. HHSN272200700058C, and by the U.S. Department of Energy, Office of Biological and Environmental Research, under contract DE-AC02-06CH11357.
Footnotes
The submitted manuscript has been created by UChicago Argonne, LLC, Operator of Argonne National Laboratory (“Argonne”). Argonne, a U.S. Department of Energy Office of Science laboratory, is operated under Contract No. DE-AC02-06CH11357. The U.S. Government retains for itself, and others acting on its behalf, a paid-up nonexclusive, irrevocable worldwide license in said article to reproduce, prepare derivative works, distribute copies to the public, and perform publicly and display publicly, by or on behalf of the Government.
References
- 1.Finn RD, Mistry J, Tate J, Coggill P, Heger A, Pollington JE, Gavin OL, Gunasekaran P, Ceric G, Forslund K, et al. The Pfam protein families database. Nucleic Acids Research. 2010;38:D211–D222. doi: 10.1093/nar/gkp985. [DOI] [PMC free article] [PubMed] [Google Scholar]
- 2.Giglio MG, Collmer CW, Lomax J, Ireland A. Applying the Gene Ontology in microbial annotation. Trends Microbiol. 2009;17:262–268. doi: 10.1016/j.tim.2009.04.003. [DOI] [PubMed] [Google Scholar]
- 3.Pestka S. Production and analysis of proteins by recombinant DNA technology. Bioprocess Technol. 1990;7:235–265. [PubMed] [Google Scholar]
- 4.Studier FW. Protein production by auto-induction in high density shaking cultures. Protein Expr Purif. 2005;41:207–234. doi: 10.1016/j.pep.2005.01.016. [DOI] [PubMed] [Google Scholar]
- 5.Austin BP, Nallamsetty S, Waugh DS. Hexahistidine-tagged maltose-binding protein as a fusion partner for the production of soluble recombinant proteins in Escherichia coli. Methods Mol Biol. 2009;498:157–172. doi: 10.1007/978-1-59745-196-3_11. [DOI] [PubMed] [Google Scholar]
- 6.He A, Pu WT. Genome-wide location analysis by pull down of in vivo biotinylated transcription factors. Curr Protoc Mol Biol. 2010;Chapter 21(Unit 21):20. doi: 10.1002/0471142727.mb2120s92. [DOI] [PMC free article] [PubMed] [Google Scholar]
- 7.Handelsman J. Metagenomics: application of genomics to uncultured microorganisms. Microbiol Mol Biol Rev. 2004;68:669–685. doi: 10.1128/MMBR.68.4.669-685.2004. [DOI] [PMC free article] [PubMed] [Google Scholar]
- 8.Graslund S, Nordlund P, Weigelt J, Hallberg BM, Bray J, Gileadi O, Knapp S, Oppermann U, Arrowsmith C, Hui R, et al. Protein production and purification. Nat Methods. 2008;5:135–146. doi: 10.1038/nmeth.f.202. [DOI] [PMC free article] [PubMed] [Google Scholar]
- 9.Burley SK, Joachimiak A, Montelione GT, Wilson IA. Contributions to the NIH-NIGMS Protein Structure Initiative from the PSI Production Centers. Structure. 2008;16:5–11. doi: 10.1016/j.str.2007.12.002. [DOI] [PMC free article] [PubMed] [Google Scholar]
- 10.Qin J, Li R, Raes J, Arumugam M, Burgdorf KS, Manichanh C, Nielsen T, Pons N, Levenez F, Yamada T, et al. A human gut microbial gene catalogue established by metagenomic sequencing. Nature. 2010;464:59–65. doi: 10.1038/nature08821. [DOI] [PMC free article] [PubMed] [Google Scholar]
- 11.Dieckman L, Gu M, Stols L, Donnelly MI, Collart FR. High throughput methods for gene cloning and expression. Protein Expr Purif. 2002;25:1–7. doi: 10.1006/prep.2001.1602. [DOI] [PubMed] [Google Scholar]
- 12.Donnelly MI, Zhou M, Millard CS, Clancy S, Stols L, Eschenfeldt WH, Collart FR, Joachimiak A. An expression vector tailored for large-scale, high-throughput purification of recombinant proteins. Protein Expr Purif. 2006;47:446–454. doi: 10.1016/j.pep.2005.12.011. [DOI] [PMC free article] [PubMed] [Google Scholar]
- 13.Eschenfeldt WH, Lucy S, Millard CS, Joachimiak A, Mark ID. A family of LIC vectors for high-throughput cloning and purification of proteins. Methods Mol Biol. 2009;498:105–115. doi: 10.1007/978-1-59745-196-3_7. [DOI] [PMC free article] [PubMed] [Google Scholar]
- 14.Cooper DR, Boczek T, Grelewska K, Pinkowska M, Sikorska M, Zawadzki M, Derewenda Z. Protein crystallization by surface entropy reduction: optimization of the SER strategy. Acta Crystallogr D Biol Crystallogr. 2007;63:636–645. doi: 10.1107/S0907444907010931. [DOI] [PubMed] [Google Scholar]
- 15.Dong A, Xu X, Edwards AM, Chang C, Chruszcz M, Cuff M, Cymborowski M, Di Leo R, Egorova O, Evdokimova E, et al. In situ proteolysis for protein crystallization and structure determination. Nat Methods. 2007;4:1019–1021. doi: 10.1038/nmeth1118. [DOI] [PMC free article] [PubMed] [Google Scholar]
- 16.Hassell AM, An G, Bledsoe RK, Bynum JM, Carter HL, 3rd, Deng SJ, Gampe RT, Grisard TE, Madauss KP, Nolte RT, et al. Crystallization of protein-ligand complexes. Acta Crystallogr D Biol Crystallogr. 2007;63:72–79. doi: 10.1107/S0907444906047020. [DOI] [PMC free article] [PubMed] [Google Scholar]
- 17.He G, Jacob C, Guo L, Chow PS, Tan RB. Screening for cocrystallization tendency: the role of intermolecular interactions. J Phys Chem B. 2008;112:9890–9895. doi: 10.1021/jp803019m. [DOI] [PubMed] [Google Scholar]
- 18.Rypniewski WR, Holden HM, Rayment I. Structural consequences of reductive methylation of lysine residues in hen egg white lysozyme: an X-ray analysis at 1.8-A resolution. Biochemistry. 1993;32:9851–9858. doi: 10.1021/bi00088a041. [DOI] [PubMed] [Google Scholar]
- 19.Stols L, Zhou M, Eschenfeldt WH, Millard CS, Abdullah J, Collart FR, Kim Y, Donnelly MI. New vectors for co-expression of proteins: structure of Bacillus subtilis ScoAB obtained by high-throughput protocols. Protein Expr Purif. 2007;53:396–403. doi: 10.1016/j.pep.2007.01.013. [DOI] [PubMed] [Google Scholar]
- 20.Warne T, Serrano-Vega MJ, Tate CG, Schertler GF. Development and crystallization of a minimal thermostabilized G protein-coupled receptor. Protein Expr Purif. 2009 doi: 10.1016/j.pep.2009.01.014. [DOI] [PubMed] [Google Scholar]
- 21.Davis AM, Teague SJ, Kleywegt GJ. Application and Limitations of X-ray Crystallographic Data in Structure-Based Ligand and Drug Design. Angewandte Chemie International Edition. 2003;42:2718–2736. doi: 10.1002/anie.200200539. [DOI] [PubMed] [Google Scholar]
- 22.Babnigg G, Joachimiak A. Predicting protein crystallization propensity from protein sequence. J Struct Funct Genomics. 2010;11:71–80. doi: 10.1007/s10969-010-9080-0. [DOI] [PMC free article] [PubMed] [Google Scholar]
- 23.Pfleger BF, Kim Y, Nusca TD, Maltseva N, Lee JY, Rath CM, Scaglione JB, Janes BK, Anderson EC, Bergman NH, et al. Structural and functional analysis of AsbF: origin of the stealth 3,4-dihydroxybenzoic acid subunit for petrobactin biosynthesis. Proc Natl Acad Sci U S A. 2008;105:17133–17138. doi: 10.1073/pnas.0808118105. [DOI] [PMC free article] [PubMed] [Google Scholar]
- 24.Marsden RL, Orengo CA. Target selection for structural genomics: an overview. Methods Mol Biol. 2008;476:3–25. doi: 10.1007/978-1-60327-058-8_1. [DOI] [PubMed] [Google Scholar]
- 25.Marsden RL, Lee D, Maibaum M, Yeats C, Orengo CA. Comprehensive genome analysis of 203 genomes provides structural genomics with new insights into protein family space. Nucleic Acids Res. 2006;34:1066–1080. doi: 10.1093/nar/gkj494. [DOI] [PMC free article] [PubMed] [Google Scholar]
- 26.Slabinski L, Jaroszewski L, Rychlewski L, Wilson IA, Lesley SA, Godzik A. XtalPred: a web server for prediction of protein crystallizability. Bioinformatics. 2007;23:3403–3405. doi: 10.1093/bioinformatics/btm477. [DOI] [PubMed] [Google Scholar]
- 27.Price WN, 2nd, Chen Y, Handelman SK, Neely H, Manor P, Karlin R, Nair R, Liu J, Baran M, Everett J, et al. Understanding the physical properties that control protein crystallization by analysis of large-scale experimental data. Nat Biotechnol. 2009;27:51–57. doi: 10.1038/nbt.1514. [DOI] [PMC free article] [PubMed] [Google Scholar]
- 28.Overton IM, Barton GJ. A normalised scale for structural genomics target ranking: the OB-Score. FEBS Lett. 2006;580:4005–4009. doi: 10.1016/j.febslet.2006.06.015. [DOI] [PubMed] [Google Scholar]
- 29.Kim Y, Dementieva I, Zhou M, Wu R, Lezondra L, Quartey P, Joachimiak G, Korolev O, Li H, Joachimiak A. Automation of protein purification for structural genomics. J Struct Funct Genomics. 2004;5:111–118. doi: 10.1023/B:JSFG.0000029206.07778.fc. [DOI] [PMC free article] [PubMed] [Google Scholar]
- 30.Stols L, Gu M, Dieckman L, Raffen R, Collart FR, Donnelly MI. A new vector for high-throughput, ligation-independent cloning encoding a tobacco etch virus protease cleavage site. Protein Expr Purif. 2002;25:8–15. doi: 10.1006/prep.2001.1603. [DOI] [PubMed] [Google Scholar]
- 31.Millard CS, Stols L, Quartey P, Kim Y, Dementieva I, Donnelly MI. A less laborious approach to the high-throughput production of recombinant proteins in Escherichia coli using 2-liter plastic bottles. Protein Expr Purif. 2003;29:311–320. doi: 10.1016/s1046-5928(03)00063-9. [DOI] [PubMed] [Google Scholar]
- 32.Eschenfeldt WH, Maltseva N, Stols L, Donnelly MI, Gu M, Nocek B, Tan K, Kim Y, Joachimiak A. Cleavable C-terminal His-tag vectors for structure determination. J Struct Funct Genomics. 2010;11:31–39. doi: 10.1007/s10969-010-9082-y. [DOI] [PMC free article] [PubMed] [Google Scholar]
- 33.Donnelly MI, Stevens PW, Stols L, Su SX, Tollaksen S, Giometti C, Joachimiak A. Expression of a highly toxic protein, Bax, in Escherichia coli by attachment of a leader peptide derived from the GroES cochaperone. Protein Expr Purif. 2001;22:422–429. doi: 10.1006/prep.2001.1442. [DOI] [PMC free article] [PubMed] [Google Scholar]
- 34.Cormier CY, Park JG, Fiacco M, Steel J, Hunter P, Kramer J, Singla R, Labaer J. PSI:Biology-materials repository: a biologist’s resource for protein expression plasmids. Journal of structural and functional genomics. 2011;12:55–62. doi: 10.1007/s10969-011-9100-8. [DOI] [PMC free article] [PubMed] [Google Scholar]
- 35.Yoon JR, Laible PD, Gu M, Scott HN, Collart FR. Express primer tool for high-throughput gene cloning and expression. Biotechniques. 2002;33:1328–1333. doi: 10.2144/02336bc03. [DOI] [PubMed] [Google Scholar]
- 36.Stols L, Millard CS, Dementieva I, Donnelly MI. Production of selenomethionine-labeled proteins in two-liter plastic bottles for structure determination. J Struct Funct Genomics. 2004;5:95–102. doi: 10.1023/B:JSFG.0000029196.87615.6e. [DOI] [PubMed] [Google Scholar]
- 37.Dougherty WG, Parks TD. Molecular genetic and biochemical evidence for the involvement of the heptapeptide cleavage sequence in determining the reaction profile at two tobacco etch virus cleavage sites in cell-free assays. Virology. 1989;172:145–155. doi: 10.1016/0042-6822(89)90116-5. [DOI] [PubMed] [Google Scholar]
- 38.Kapust RB, Waugh DS. Controlled intracellular processing of fusion proteins by TEV protease. Protein Expr Purif. 2000;19:312–318. doi: 10.1006/prep.2000.1251. [DOI] [PubMed] [Google Scholar]
- 39.Klock HE, Koesema EJ, Knuth MW, Lesley SA. Combining the polymerase incomplete primer extension method for cloning and mutagenesis with microscreening to accelerate structural genomics efforts. Proteins. 2008;71:982–994. doi: 10.1002/prot.21786. [DOI] [PubMed] [Google Scholar]
- 40.Borgstahl GE. How to use dynamic light scattering to improve the likelihood of growing macromolecular crystals. Methods Mol Biol. 2007;363:109–129. doi: 10.1007/978-1-59745-209-0_6. [DOI] [PubMed] [Google Scholar]
- 41.Ferre-D’Amare AR, Burley SK. Use of dynamic light scattering to assess crystallizability of macromolecules and macromolecular assemblies. Structure. 1994;2:357–359. doi: 10.1016/s0969-2126(00)00037-x. [DOI] [PubMed] [Google Scholar]
- 42.Alford JR, Kendrick BS, Carpenter JF, Randolph TW. Measurement of the second osmotic virial coefficient for protein solutions exhibiting monomer-dimer equilibrium. Analytical Biochemistry. 2008;377:128–133. doi: 10.1016/j.ab.2008.03.032. [DOI] [PMC free article] [PubMed] [Google Scholar]
- 43.Wilson WW. Light scattering as a diagnostic for protein crystal growth--a practical approach. J Struct Biol. 2003;142:56–65. doi: 10.1016/s1047-8477(03)00038-8. [DOI] [PubMed] [Google Scholar]
- 44.Forsythe EL, Maxwell DL, Pusey M. Vapor diffusion, nucleation rates and the reservoir to crystallization volume ratio. Acta Crystallogr D Biol Crystallogr. 2002;58:1601–1605. doi: 10.1107/s0907444902014208. [DOI] [PubMed] [Google Scholar]
- 45.Mikol V, Rodeau JL, Giege R. Experimental determination of water equilibration rates in the hanging drop method of protein crystallization. Anal Biochem. 1990;186:332–339. doi: 10.1016/0003-2697(90)90091-m. [DOI] [PubMed] [Google Scholar]
- 46.Wernimont A, Edwards A. In situ proteolysis to generate crystals for structure determination: an update. PLoS One. 2009;4:e5094. doi: 10.1371/journal.pone.0005094. [DOI] [PMC free article] [PubMed] [Google Scholar]
- 47.Kim Y, Quartey P, Li H, Volkart L, Hatzos C, Chang C, Nocek B, Cuff M, Osipiuk J, Tan K, et al. Large-scale evaluation of protein reductive methylation for improving protein crystallization. Nature Methods. 2008;5:853–854. doi: 10.1038/nmeth1008-853. [DOI] [PMC free article] [PubMed] [Google Scholar]
- 48.Turnbaugh PJ, Ley RE, Hamady M, Fraser-Liggett CM, Knight R, Gordon JI. The human microbiome project. Nature. 2007;449:804–810. doi: 10.1038/nature06244. [DOI] [PMC free article] [PubMed] [Google Scholar]
- 49.Raymond A, Lovell S, Lorimer D, Walchli J, Mixon M, Wallace E, Thompkins K, Archer K, Burgin A, Stewart L. Combined protein construct and synthetic gene engineering for heterologous protein expression and crystallization using Gene Composer. BMC Biotechnol. 2009;9:37. doi: 10.1186/1472-6750-9-37. [DOI] [PMC free article] [PubMed] [Google Scholar]