

Abstract
Study objective
Emergency department (ED) crowding is a prevalent health delivery problem and may adversely affect the outcomes of patients requiring admission. We assess the association of ED crowding with subsequent outcomes in a general population of hospitalized patients.
Methods
We performed a retrospective cohort analysis of patients admitted in 2007 through the EDs of nonfederal, acute care hospitals in California. The primary outcome was inpatient mortality. Secondary outcomes included hospital length of stay and costs. ED crowding was established by the proxy measure of ambulance diversion hours on the day of admission. To control for hospital-level confounders of ambulance diversion, we defined periods of high ED crowding as those days within the top quartile of diversion hours for a specific facility. Hierarchic regression models controlled for demographics, time variables, patient comorbidities, primary diagnosis, and hospital fixed effects. We used bootstrap sampling to estimate excess outcomes attributable to ED crowding.
Results
We studied 995,379 ED visits resulting in admission to 187 hospitals. Patients who were admitted on days with high ED crowding experienced 5% greater odds of inpatient death (95% confidence interval [CI] 2% to 8%), 0.8% longer hospital length of stay (95% CI 0.5% to 1%), and 1% increased costs per admission (95% CI 0.7% to 2%). Excess outcomes attributable to periods of high ED crowding included 300 inpatient deaths (95% CI 200 to 500 inpatient deaths), 6,200 hospital days (95% CI 2,800 to 8,900 hospital days), and $17 million (95% CI $11 to $23 million) in costs.
Conclusion
Periods of high ED crowding were associated with increased inpatient mortality and modest increases in length of stay and costs for admitted patients.
SEE EDITORIAL, P. 612.
INTRODUCTION
Background
Emergency department (ED) crowding has become an international health delivery problem.1-3 Increasing frequency of ambulance diversion and left-without-being-seen visits have led the Institute of Medicine to describe US EDs as nearing “the breaking point,”1 and multiple other countries have experienced a surge of ED crowding during the past decade. National policy responses have varied from none to system-wide performance targets.2
Importance
Establishing a definitive relationship between ED crowding and subsequent mortality may motivate policymakers to address ED crowding as a top public health priority. Limitations of previous studies assessing the effect of ED crowding on admitted patients include small hospital samples (n=1 to 6),4-8 lack of case-mix adjustment for comorbidities and primary illness diagnosis,3-6,8 lack of adjustment for potential hospital-level confounders, and restriction to specific subgroups such as patients with acute myocardial infarction,9 trauma,10 pneumonia,11 or critical illness.12
Goals of This Investigation
To address these limitations, we studied the effect of ED crowding on patient outcomes in a regional cohort of adult patients admitted through an ED. ED crowding was represented by a hospital-normalized measure of ambulance diversion hours on the day of admission. We hypothesized that high ED crowding would be associated with increased inpatient mortality rates, length of stay, and hospital costs in a general population of hospitalized patients.
MATERIALS AND METHODS
Study Design and Participants
We performed a retrospective cohort study of adult admissions through the EDs of nonfederal California hospitals for 2007. Hospital-level exclusion criteria were the absence of basic or comprehensive emergency services, facilities that closed their hospital or ED in 2007, and facilities that primarily served children (because ED crowding may have differential effects in pediatric compared with adult populations13). We excluded hospitals that were prohibited from diverting ambulances by local emergency medical services (EMS) policy anytime during the study period. We also excluded hospitals that were allowed to but never requested ambulance diversion in 2007 because such hospitals would provide no information about the association between ED crowding and outcomes within hospitals. Finally, we excluded hospitals with incomplete facility-level information. Admission-level exclusion criteria included transfers from other hospitals, patients younger than 18 years, and missing ambulance diversion data on the day of admission.
This study was approved by the institutional review boards of the state of California; the University of California, Los Angeles; and the University of California, San Francisco.
Data Collection and Processing
All nonfederal health care facilities in California are required to provide hospital discharge data to the Office of Statewide Hospital Planning and Development. We obtained their nonpublic use files for all admissions in 2007. Hospital-level financial and structural data were extracted from 2007 Office of Statewide Hospital Planning and Development public-use files.
We obtained available data on all episodes of ambulance diversion in California for the study period. Ambulance diversion policies in 2007 were verified by the directors of all 31 California EMS agencies overseeing out-of-hospital care in 58 counties. Depending on local EMS policy, ambulance diversion may have been permitted for all, some, or none of the hospitals in a county. Daily electronic ambulance diversion logs were provided by EMS agencies in California that permitted ambulance diversion during the study period. These logs contained the facility, date, duration, and reason for each episode of ambulance diversion. We reformatted these data to obtain daily, facility-specific ambulance diversion hours caused by ED saturation. The definition of ED saturation varied by EMS agency; some agencies had explicit criteria (eg, the presence of boarded patients awaiting an inpatient critical care unit bed), although this was not universal. The enforcement of ED saturation criteria to justify ambulance diversion also varied among the EMS agencies. Episodes of ambulance diversion for reasons other than ED saturation, such as hospital internal disaster or temporary lack of subspecialty or imaging services, were excluded from this analysis. Three of the EMS agencies were missing data for 2 to 4 weeks because of upgrades to their diversion tracking software, and 1 EMS agency was missing data from January through March.
Outcome Measures
The primary outcome was inpatient mortality. Secondary outcomes included length of stay and hospital costs. Inpatient mortality, length of stay, and hospital charges were obtained from Office of Statewide Hospital Planning and Development visit-level data. The length of stay was defined as the number of days between the date of admission to the date of discharge; this interval included time spent in the ED as a “boarded” patient awaiting an inpatient bed. Hospital costs were estimated by applying overall facility-specific cost-to-charge ratios, available in 2007 Office of Statewide Hospital Planning and Development public-use files, to hospital charges.
We used daily ambulance diversion hours on the day of admission to create a hospital-normalized measure of ED crowding. Ambulance diversion occurs when ED staff can no longer safely care for new patients and ambulances are diverted to nearby facilities. Ambulance diversion has face validity as a proxy measure14 and has been used as a criterion standard for developing ED crowding scales.15 Ambulance diversion is also routinely measured by out-of-hospital and regulatory agencies.16
Ambulance diversion rates vary greatly between and within EMS systems.16 Differences in EMS policies and how hospitals interpret such policies may influence ambulance diversion rates. To adjust for potential hospital-level confounding of ambulance diversion that may be unrelated to ED crowding, we defined periods of high ED crowding as days within the top quartile of daily ambulance diversion hours for a specific facility. We used a top quartile definition because exploratory analyses suggested a threshold effect occurring at that cutoff. All other days were considered periods of normal ED crowding. This approach uses each hospital as its own control to define high levels of ED crowding. Many facilities (44%) experienced ambulance diversion less than one quarter of the days in 2007; therefore, the percentage of facility days categorized as those with high ED crowding (17%) was less than 25% of all facility days.
We collected data on admission-level characteristics that may be related to the outcomes, including age, sex, race or ethnicity, time indicators, comorbidities, and primary discharge diagnosis. Race and ethnicity were dichotomized as white or non-Hispanic versus all others (nonwhite). Because ED crowding may be related to time of year,17 we included indicators for calendar months and for weekend versus weekday corresponding to the day of admission. We used Office of Statewide Hospital Planning and Development secondary discharge diagnoses codes (up to 24 coded per admission) and the Elixhauser classification system18 to identify the presence or absence of 30 comorbid conditions. Primary discharge diagnosis was categorized with the Clinical Classifications software developed by the Agency for Healthcare Research and Quality.19 The software cross-maps all International Classification of Diseases, Ninth Revision discharge diagnosis codes to approximately 200 clinically coherent categories.
Primary Data Analysis
In descriptive analyses of hospital admissions stratified by presence of high ED crowding, we assessed for baseline difference with hospital-level fixed effects models for continuous variables and Cochran-Mantel-Haenzel test stratified by hospital for categorical variables. Length of stay and costs were log transformed to correct for right-skewed data.
All outcomes were modeled with hierarchic regressions, with hospital admission as the unit of analysis (see Appendix E1, available online at http://www.annemergmed.com). The key predictor in our models was a binary indicator of high ED crowding on the day of hospital admission. Admissions were clustered within hospitals, and all models included a hospital fixed effect (dummy variable for each hospital). Primary diagnosis category was included as a random effect, and comorbidities were included as fixed effects. All models included admission and hospital-level covariates described in the previous section.
In our primary analysis, inpatient mortality was modeled with a logistic link function. Secondary outcomes of length of stay and costs were modeled as continuous variables after a log transformation. To improve interpretability, results for the secondary outcomes were back-transformed to the original units.
We generated population-level estimates of mortality and resource use attributable to high ED crowding. We performed a simulation comparing the observed data to a hypothetical state when all admissions occurred on days without high ED crowding. Using our hierarchic regression models, we imputed differences in outcomes as if all admissions on high ED crowding days had occurred on normal ED crowding days. Bootstrap sampling (n=100) stratified by facility and level of crowding (high versus low) was implemented to estimate 95% confidence interval (CI) for each of the 3 outcomes. Random sampling with equal probability and with replacement was conducted within strata.20
We performed 2 additional sensitivity analyses. First, we assessed the effect of ED crowding on inpatient deaths occurring in the first 3 days because the effect of ED crowding on inhospital mortality may attenuate over time. Second, we assessed an alternative definition of ED crowding. Adapting a methodology described by Guttmann et al,21 we used a hospital fixed-effect model and assessed ED crowding by non-normalized daily diversion hours. Days were divided into 3 categories: 0 (reference), 0 to 5, and greater than 5 hours of ambulance diversion; in contrast to the primary analysis, this alternative ED crowding measure did not use hospitals as their own internal control.
All data management and analysis was performed with SAS (version 9.2; SAS Institute, Inc., Cary, NC).
RESULTS
The Figure illustrates the construction of the study cohort. Excluded hospitals were more likely to be located in single-hospital, low-population-density counties and served patients who were more likely to be young, white, and poor than those treated at included hospitals (Table E1, available online at http://www.annemergmed.com). Our study cohort included 995,379 admissions occurring through the ED at 187 hospitals. Admission and hospital level characteristics are presented in Table 1 and Table E2 (available online at http://www.annemergmed.com), respectively. There were complete data on inpatient mortality and length of stay, and there were minimal missing data on covariates used in this analysis (<0.8% race; <0.1% sex; complete data on other covariates). A subset of integrated health systems and county hospitals was exempted from cost reporting; approximately 15% of visits (n=150,611) were excluded from cost analysis because of missing cost data. On unadjusted analyses, inpatient mortality, length of stay, and costs were higher on high ED crowding days (Table 1).
Figure.
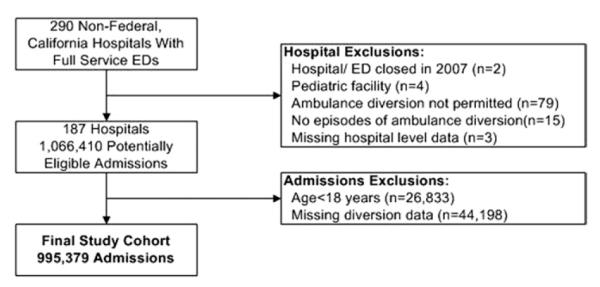
Study flowchart.
Table 1.
Characteristics of the study cohort.
| Admissions |
|||
|---|---|---|---|
| Variables | Total (n=995,379) |
High ED Crowding (n=197,325; 20%)* |
Normal ED Crowding (n=798,054; 80%) |
| Ambulance diversion hours | |||
| Median (IQR) | 0.6 (0, 4.67) | 7.1 (3.6, 11.2) | 0 (0, 2.2) |
| Outcomes | |||
| Inpatient mortality, No. (%)† | 36,281 (3.6) | 7,628 (3.9) | 28,653 (3.6) |
| Length of stay, days | |||
| Mean (SD)† | 5 (±7) | 5 (±7) | 5 (±7) |
| Median (IQR) | 3 (2, 6) | 3 (2, 6) | 3 (2, 6) |
| Costs, $ | |||
| Mean (SD)† | 12,787 (21,134) | 13,089 (22,301) | 12,710 (20,827) |
| Median (IQR) | 7,423 (4,378, 13,548) | 7,410 (4,348, 13,678) | 7,524 (4,386, 13,515) |
| Covariates | |||
| Age (SD), mean, y† | 62.2 (19.6) | 62.1 (19.6) | 62.2 (19.6) |
| Male (%) | 472,048 (47.4) | 94,217 (47.8) | 377,831 (47.3) |
| Nonwhite (%) | 312,116 (31.4) | 62,059 (31.5) | 250,057 (31.3) |
| Selected comorbidities | |||
| Hypertension (%) | 478,431 (48.1) | 94,184 (47.7) | 384,427 (48.1) |
| Uncomplicated diabetes mellitus (%) | 177,789 (17.9) | 35,361 (17.9) | 142,428 (17.8) |
| Chronic pulmonary disease (%)‡ | 135,461 (13.6) | 26,743 (13.6) | 108,718 (13.6) |
| Renal failure (%)† | 132,336 (13.3) | 26,455 (13.4) | 105,881 (13.3) |
| Congestive heart failure (%)‡ | 103,073 (10.4) | 20,320 (10.3) | 82,753 (10.4) |
IQR, interquartile range; SD, standard deviation; y, years.
The percent of facility-days categorized as those with high ED crowding (17%) was less than 25% of all facility-days; thus, less than 25% of all admissions occurred on high ED crowding days.
For high vs normal ED crowding for outcomes and covariates, P<.001.
For high vs normal ED crowding for outcomes and covariates, P<.05.
Table 2 presents adjusted analyses. (Full model results are in Tables E3 to E5, available online at http://www.annemergmed.com.) High ED crowding was associated with 5% greater odds of inpatient death (95% CI 2% to 8%), 0.8% longer hospital length of stay (95% CI 0.5% to 1%), and 1% increased costs per admission (95% CI 0.7% to 2%). Excess adverse outcomes attributable to periods of high ED crowding included 300 inpatient deaths (95% CI 200 to 500 inpatient deaths), 6,200 hospital days (95% CI 2,800 to 8,900 hospital days), and $17 million (95% CI $11 to $23 million) in costs for the 1-year study period.
Table 2.
Adjusted association between high ED crowding and patient outcomes.*
| Inpatient Mortality, N=995,358 |
Length of Stay, N=995,358 |
Costs, N=844,219† |
||||
|---|---|---|---|---|---|---|
| Variables | OR | 95% CI | Ratio | 95% CI | Ratio | 95% CI |
| High ED crowding | 1.05 | 1.02–1.08 | 1.008 | 1.005–1.012 | 1.011 | 1.007–1.015 |
| Selected covariates | ||||||
| Age (in 5 y) | 1.15 | 1.14–1.15 | 1.01 | 1.009–1.010 | 0.994 | 0.994–0.995 |
| Male | 1.04 | 1.01–1.06 | 0.995 | 0.992–0.998 | 1.037 | 1.033–1.040 |
| Nonwhite | 0.95 | 0.92–0.98 | 1.01 | 1.007–1.014 | 1.004 | 1.000–1.008 |
All models include primary discharge diagnosis and 30 comorbidities. See Appendix E1 (available online at http://www.annemergmed.com) for full mortality model results.
A subset of integrated health system and county hospitals is exempt from costs reporting.
We performed 2 additional sensitivity analyses. In fully adjusted models, high ED crowding was associated with 9% (95% CI 4% to 13%) greater odds of inhospital death within 3 days. We also assessed ED crowding by number of daily ambulance diversion hours (Table 3). Admission on days with greater than 5 ambulance diversion hours compared with 0 diversion hours was associated with 6% increased odds of inpatient death (95% CI 2% to 10%).
Table 3.
Sensitivity analysis: alternative measure of ED crowding.*
| Inpatient Mortality, N=995,358 |
||
|---|---|---|
| Diversion Hours on Admission Date† | OR | 95% CI |
| 0 (Reference) | ||
| 0–5 | 1.02 | 0.99–1.06 |
| >5 | 1.06 | 1.02–1.1 |
Adjusted for hospital fixed-effects and admission-level covariates; see text.
Distribution of data: 0, 49%; 0 to 5, 28%; and greater than 5, 23%.
LIMITATIONS
Our study is subject to potential limitations. First, ambulance diversion hours may be an imperfect measure of ED crowding. For example, this measure may be poorly sensitive to ED crowding at facilities that rarely request ambulance diversion. Furthermore, daily diversion hours may not reflect ED crowding experienced by an individual patient, and variation in ED crowding may be greater within than across days.22 Unfortunately, the time of ED evaluation is unavailable through the Office of Statewide Hospital Planning and Development data. However, all of these concerns generate a conservative bias toward the null hypothesis, and we believe that the true effect of ED crowding is greater than our reported estimates. Alternative measures of ED crowding, such as occupancy, length of stay, and boarding time,23 are not collected by the Office of Statewide Hospital Planning and Development, and future studies should compare the predictive validity of multiple ED crowding measures.
Second, findings from our observational study may be subject to unmeasured confounding. We mitigate the potential for confounding by controlling for patient-level case mix and primary discharge diagnosis, and our hospital normalized measure of ED crowding adjusts for confounding by facility-level factors.
Third, our observational design cannot exclude the possibility of endogeneity or reverse causation (eg, patients with worse outcomes cause ED crowding). Future studies may consider the study of natural experiments or the use of advanced analytic techniques (eg, instrumental variables) to better assess causation.
Fourth, ED crowding is a symptom of inpatient bed saturation,24 and it is possible that our findings are mediated through inpatient rather than ED crowding. This latter explanation is made less likely by mandated nurse-patient ratios that were implemented statewide in 2005.25 These ratio requirements may mitigate crowding in inpatient settings that have a fixed number of staffed beds. Conversely, mandated ratios may contribute to ED crowding when surges in patient demand exceed available ED nursing.26,27 Our study is not designed to assess potential causal mechanisms, and these should be explored in future research. Nevertheless, our findings suggest that ED crowding is a marker of poor-quality care, and we believe that hospitals experiencing high ED crowding should address the root cause of inpatient bed saturation.28-30
Fifth, despite the depth and breadth of data from multiple EMS systems and hospitals, our findings may not generalize to other settings and countries. For example, we excluded many rural hospitals because of the lack of ambulance diversion data, and future studies of such facilities need to use alternative measures of ED crowding.
DISCUSSION
Patients admitted through the ED during periods of high ED crowding died more often than similar patients admitted to the same hospital when the ED was less crowded. There were also modest increases in inpatient length of stay and hospital costs. These findings persisted after extensive case-mix adjustment for patient demographics, comorbidities, and primary discharge diagnosis. Our fixed-effect model controls for confounding by facility characteristics, and our hospital-normalized definition of ED crowding controls for variations in EMS diversion policies and hospital interpretation of such policies.
Although others have reported similar associations in small hospital cohorts or specific patient subgroups,3-12 our study generalizes these findings to a large sample of hospitals and unselected admissions from the ED. Our results are robust to the timing of inhospital deaths (any inpatient death versus <3 days) and the specification of the ED crowding measure. Most previous studies reported an association between measures of ED crowding with mortality (adjusted risk ratios ranging from 1.3 to more than 3).4-8 Effect estimates across studies are not directly comparable because of differences in ED crowding definitions, study populations, and case-mix adjustment; however, the literature in aggregate strongly suggests that ED crowding is associated with worse outcomes in admitted patients.
We suggest several potential mechanisms for the association of crowding and poorer outcomes, using the widely accepted input-throughput-output conceptual model.31 Input is related to patient demand for emergency services before ED arrival. ED crowding may reduce access through prolonged waiting times or through increased time to care as a result of longer ambulance transport after diversion. Throughput describes the operations within the ED. A large literature has demonstrated the negative effect of ED crowding on throughput,32 including delays in the treatment of myocardial infarction, pneumonia, and painful conditions. Finally, output focuses on the transfer or discharge of patients from the ED. A common barrier to output is high inpatient occupancy, resulting in patients boarding in the ED while waiting for an available hospital bed. Prolonged boarding times may delay definitive testing and increase short-term mortality, length of stay, and associated costs.33-35 Continuity of care in the ED may be compromised by frequent nursing and physician shift changes, and ED priority on evaluating new patients may divert attention from ongoing care of boarded patients.
Our findings support the perception of ED crowding as a marker of poor quality of care. Although the adjusted odds ratios for individual-level outcomes are modest, we demonstrate an important aggregate effect on mortality, length of stay, and costs. Factors underlying ED crowding are likely to become worse. The aging of populations in developed countries has greatly increased the volume, complexity, and acuity of patients presenting to the ED.36 In the United States, the number of EDs increased 4%, from 4,600 in 2001 to 4,800 in 2006, whereas the number of ED visits increased 11%, from 107 million to 120 million during the same period.31 Attempts to maximize inpatient bed occupancy have reduced the ability of hospitals to absorb new patients and increased the prevalence of admitted patients boarding in the ED.36 The availability2 or implementation37 of universal health insurance is unlikely to slow this trend.
Despite the prevalence and effect of ED crowding, most developed countries lack coordinated national policy responses.2 In 2005, the United Kingdom implemented a rule limiting ED length of stay to 4 hours; however, this policy was recently abandoned, and there is insufficient evidence to assess the effect of the 4-hour rule on outcomes. Several provinces in Canada have pay-for-performance targets for ED length of stay, although this is not a nationwide policy. The Centers for Medicare & Medicaid Services recently initiated hospital-level collection of several ED throughput measures. These data will not be publicly reported until 2014, and it is unclear how these metrics will be used to improve performance. As a result, near-term efforts to reduce ED crowding will likely focus on hospital-level interventions. Professional task forces have previously described various approaches to decrease ED crowding,24 although efficacy has primarily been measured through proxy outcomes such as boarding times and rates of leaving without being seen. Future research should assess whether such interventions decrease adverse events and resource use.
In summary, we found that ED crowding is associated with increased mortality, length of stay, and costs in a large cohort of admitted patients. Our study provides additional evidence that ED crowding is a marker for worse care for all ED patients who might require hospital admission. In 2006, the Institute of Medicine described an overburdened US emergency care system and outlined potential policy remedies in a report titled Future of Emergency Care: Hospital-Based Emergency Care at the Breaking Point.1 Despite mounting evidence that ED crowding is a health delivery problem that reduces access to emergency care, results in worse quality of care, and leads to lower patient satisfaction,32 there have subsequently been few systematic actions to address the crisis of ED crowding. Policymakers should heed the recommendations of the Institute of Medicine and address ED crowding as an important public health priority.
Supplementary Material
Appendix E1 Codebook
Table E1. Characteristics of included and excluded hospitals.
Table E2. Admissions by hospital characteristics and ED crowding.
Table E3. Full inpatient mortality model results.*
Table E4. Full length-of-stay model results.*
Table E5. Full-cost model results.*
Editor’s Capsule Summary.
What is already known on this topic
Emergency department (ED) crowding is widely prevalent and initiatives to end this condition have become a policy priority.
What question this study addressed
This study describes the association between ED crowding and mortality, length of stay, and cost.
What this study adds to our knowledge
The authors demonstrate that crowding is associated with increased mortality, length of stay, and cost.
How this is relevant to clinical practice
The association between ED crowding and patient outcomes strengthens the argument to end the practice of ED boarding.
Acknowledgments
The authors acknowledge the EMS agencies of California for providing them with ambulance diversion data for this study and Amy J. Markowitz, JD, and Jerome Hoffman, MD, MS, for their critical reviews of the article.
Funding and support: By Annals policy, all authors are required to disclose any and all commercial, financial, and other relationships in any way related to the subject of this article as per ICMJE conflict of interest guidelines (see www.icmje.org). This study was supported by an Emergency Medicine Foundation Health Policy grant and US federal grant R03 HS18098. Dr. Sun was supported by NIH/NIA grants K12 AG001004 and the UCLA Older Americans Independence Center, P30-AG028748. Dr. Hsia was supported by the NIH/NCRR/OD UCSF-CTSI grant KL2 RR024130 and the Robert Wood Johnson Foundation Physician Faculty Scholars. The contents do not represent the official views of the Emergency Medicine Foundation, the Agency for Healthcare Research and Quality, the National Institutes of Health, or the Robert Wood Johnson Foundation. The funding sponsors had no role in design and conduct of the study; collection, management, analysis, and interpretation of the data; and preparation, review, or approval of the article.
Footnotes
Author contributions: BCS, REW, DZ, and SMA designed the study. BCS obtained funding for this study. BCS and RYH were responsible for data collection. BCS supervised the overall data collection process, had full access to all the data in the study, and takes responsibility for the integrity of the data and the accuracy of the data analysis. WH and HM were responsible for data management and cleaning. REW and L-JL performed the data analysis. BCS and RYH drafted the article. All authors contributed substantially to article revisions and approved the final article for submission. BCS takes responsibility for the paper as a whole.
Presented as an abstract at the American College of Emergency Physicians Research Forum, October 2011, San Francisco, CA; and at the Academy Health Annual Research Meeting, June 2012, Orlando, FL.
Contributor Information
Benjamin C. Sun, Department of Emergency Medicine, Oregon Health and Science University, Portland, OR.
Renee Y. Hsia, Department of Emergency Medicine, University of California, San Francisco, CA.
Robert E. Weiss, Department of Biostatistics, School of Public Health, University of California, Los Angeles, CA.
David Zingmond, Department of Medicine, University of California, Los Angeles, CA.
Li-Jung Liang, Department of Medicine, University of California, Los Angeles, CA.
Weijuan Han, Department of Medicine, University of California, Los Angeles, CA.
Heather McCreath, Department of Medicine, University of California, Los Angeles, CA.
Steven M. Asch, VA–Palo Alto Health Care System and Stanford University School of Medicine, Palo Alto, CA.
REFERENCES
- 1.Institute of Medicine . Future of Emergency Care: Hospital-Based Emergency Care at the Breaking Point. National Academies Press; Washington, DC: 2006. [Google Scholar]
- 2.Pines JM, Hilton JA, Weber EJ, et al. International perspectives on emergency department crowding. Acad Emerg Med. 2011;18:1358–1370. doi: 10.1111/j.1553-2712.2011.01235.x. [DOI] [PubMed] [Google Scholar]
- 3.Cha WC, Shin SD, Cho JS, et al. The association between crowding and mortality in admitted pediatric patients from mixed adult-pediatric emergency departments in Korea. Pediatr Emerg Care. 2011;27:1136–1141. doi: 10.1097/PEC.0b013e31823ab90b. [DOI] [PubMed] [Google Scholar]
- 4.Geelhoed GC, de Klerk NH. Emergency department overcrowding, mortality and the 4-hour rule in Western Australia. Med J Aust. 2012;196:122–126. doi: 10.5694/mja11.11159. [DOI] [PubMed] [Google Scholar]
- 5.Miro O, Antonio MT, Jimenez S, et al. Decreased health care quality associated with emergency department overcrowding. Eur J Emerg Med. 1999;6:105–107. doi: 10.1097/00063110-199906000-00003. [DOI] [PubMed] [Google Scholar]
- 6.Richardson DB. Increase in patient mortality at 10 days associated with emergency department overcrowding. Med J Aust. 2006;184:213–216. doi: 10.5694/j.1326-5377.2006.tb00204.x. [DOI] [PubMed] [Google Scholar]
- 7.Singer AJ, Thode HC, Jr, Viccellio P, et al. The association between length of emergency department boarding and mortality. Acad Emerg Med. 2011;18:1324–1329. doi: 10.1111/j.1553-2712.2011.01236.x. [DOI] [PubMed] [Google Scholar]
- 8.Sprivulis PC, Da Silva JA, Jacobs IG, et al. The association between hospital overcrowding and mortality among patients admitted via Western Australian emergency departments. Med J Aust. 2006;184:208–212. doi: 10.5694/j.1326-5377.2006.tb00416.x. [DOI] [PubMed] [Google Scholar]
- 9.Shen YC, Hsia RY. Association between ambulance diversion and survival among patients with acute myocardial infarction. JAMA. 2011;305:2440–2447. doi: 10.1001/jama.2011.811. [DOI] [PMC free article] [PubMed] [Google Scholar]
- 10.Begley CE, Chang Y, Wood RC, et al. Emergency department diversion and trauma mortality: evidence from houston, Texas. J Trauma. 2004;57:1260–1265. doi: 10.1097/01.ta.0000135163.60257.a6. [DOI] [PubMed] [Google Scholar]
- 11.Jo S, Kim K, Lee JH, et al. Emergency department crowding is associated with 28-day mortality in community-acquired pneumonia patients. J Infect. 2012;64:268–275. doi: 10.1016/j.jinf.2011.12.007. [DOI] [PubMed] [Google Scholar]
- 12.Chalfin DB, Trzeciak S, Likourezos A, et al. Impact of delayed transfer of critically ill patients from the emergency department to the intensive care unit. Crit Care Med. 2007;35:1477–1483. doi: 10.1097/01.CCM.0000266585.74905.5A. [DOI] [PubMed] [Google Scholar]
- 13.Shenoi RP, Ma L, Jones J, et al. Ambulance diversion as a proxy for emergency department crowding: the effect on pediatric mortality in a metropolitan area. Acad Emerg Med. 2009;16:116–123. doi: 10.1111/j.1553-2712.2008.00317.x. [DOI] [PubMed] [Google Scholar]
- 14.Schull MJ, Slaughter PM, Redelmeier DA. Urban emergency department overcrowding: defining the problem and eliminating misconceptions. CJEM. 2002;4:76–83. doi: 10.1017/s1481803500006163. [DOI] [PubMed] [Google Scholar]
- 15.Epstein SK, Tian L. Development of an emergency department work score to predict ambulance diversion. Acad Emerg Med. 2006;13:421–426. doi: 10.1197/j.aem.2005.11.081. [DOI] [PubMed] [Google Scholar]
- 16.The Abaris Group [Accessed May 15, 2008];California Emergency Department Diversion Project. 2008 Available at: http://www.chcf.org/topics/hospitals/index.cfm?itemID=132239.
- 17.Sun BC, Mohanty SA, Weiss R, et al. Effects of hospital closures and hospital characteristics on emergency department ambulance diversion, Los Angeles County, 1998 to 2004. Ann Emerg Med. 2006;47:309–316. doi: 10.1016/j.annemergmed.2005.12.003. [DOI] [PubMed] [Google Scholar]
- 18.Southern DA, Quan H, Ghali WA. Comparison of the Elixhauser and Charlson/Deyo methods of comorbidity measurement in administrative data. Med Care. 2004;42:355–360. doi: 10.1097/01.mlr.0000118861.56848.ee. [DOI] [PubMed] [Google Scholar]
- 19. [Accessed July 17, 2008];Clinical Classifications software. 2008 Available at: http://www.hcup-us.ahrq.gov/toolssoftware/ccs/ccsfactsheet.jsp.
- 20.Efron B, Tibshirani R. An Introduction to the Bootstrap. Chapman & Hall/CRC; Boca Raton, FL: 1993. [Google Scholar]
- 21.Guttmann A, Schull MJ, Vermeulen MJ, et al. Association between waiting times and short term mortality and hospital admission after departure from emergency department: population based cohort study from Ontario, Canada. BMJ. 2011;342:d2983. doi: 10.1136/bmj.d2983. [DOI] [PMC free article] [PubMed] [Google Scholar]
- 22.McCarthy ML, Ding R, Pines JM, et al. Comparison of methods for measuring crowding and its effects on length of stay in the emergency department. Acad Emerg Med. 2011;18:1269–1277. doi: 10.1111/j.1553-2712.2011.01232.x. [DOI] [PubMed] [Google Scholar]
- 23.Hwang U, McCarthy ML, Aronsky D, et al. Measures of crowding in the emergency department: a systematic review. Acad Emerg Med. 2011;18:527–538. doi: 10.1111/j.1553-2712.2011.01054.x. [DOI] [PubMed] [Google Scholar]
- 24.ACEP Task Force Report on Boarding Emergency department crowding: high-impact solutions. Jul 25, 2008. 2008.
- 25.California Department of Public Health [Accessed April 17, 2012];Nurse-to-patient staffing ratio regulations. 2012 Available at: http://www.cdph.ca.gov/services/DPOPP/regs/Pages/N2PRegulations.aspx.
- 26.Clark C. [Accessed April 17, 2012];Does mandating nurse-patient ratio improve care? Health Leaders Media. 2010 Available at: http://www.healthleadersmedia.com/page-1/NRS-245408/Does-Mandating-NursePatient-Ratios-Improve-Care.
- 27.California Healthcare Foundation [Accessed April 17, 2012];Assessing the impact of California’s nurse staffing ratios on hospitals and patient care. 2009 Issue Brief. Available at: http://www.chcf.org/~/media/MEDIA%20LIBRARY%20Files/PDF/A/PDF%20AssessingCANurseStaffingRatios.pdf.
- 28.Howell E, Bessman E, Kravet S, et al. Active bed management by hospitalists and emergency department throughput. Ann Intern Med. 2008;149:804–811. doi: 10.7326/0003-4819-149-11-200812020-00006. [DOI] [PubMed] [Google Scholar]
- 29.Howell E, Bessman E, Marshall R, et al. Hospitalist bed management effecting throughput from the emergency department to the intensive care unit. J Crit Care. 2010;25:184–189. doi: 10.1016/j.jcrc.2009.08.004. [DOI] [PubMed] [Google Scholar]
- 30.Moskop JC, Sklar DP, Geiderman JM, et al. Emergency department crowding, part 1—concept, causes, and moral consequences. Ann Emerg Med. 2009;53:605–611. doi: 10.1016/j.annemergmed.2008.09.019. [DOI] [PubMed] [Google Scholar]
- 31.United States Government Accountability Office . Hospital Emergency Departments: Crowding Continues to Occur, and Some Patients Wait Longer than Recommended Time Frames. US Federal Government; Washington, DC: 2009. [Google Scholar]
- 32.Bernstein SL, Aronsky D, Duseja R, et al. The effect of emergency department crowding on clinically oriented outcomes. Acad Emerg Med. 2009;16:1–10. doi: 10.1111/j.1553-2712.2008.00295.x. [DOI] [PubMed] [Google Scholar]
- 33.Maa J. The waits that matter. N Engl J Med. 2011;364:2279–2281. doi: 10.1056/NEJMp1101882. [DOI] [PubMed] [Google Scholar]
- 34.Liu SW, Singer SJ, Sun BC, et al. A conceptual model for assessing quality of care for patients boarding in the emergency department: structure-process-outcome. Acad Emerg Med. 2011;18:430–435. doi: 10.1111/j.1553-2712.2011.01033.x. [DOI] [PMC free article] [PubMed] [Google Scholar]
- 35.Liu SW, Thomas SH, Gordon JA, et al. A pilot study examining undesirable events among emergency department–boarded patients awaiting inpatient beds. Ann Emerg Med. 2009;54:381–385. doi: 10.1016/j.annemergmed.2009.02.001. [DOI] [PubMed] [Google Scholar]
- 36.Derlet RW, Richards JR. Overcrowding in the nation’s emergency departments: complex causes and disturbing effects. Ann Emerg Med. 2000;35:63–68. doi: 10.1016/s0196-0644(00)70105-3. [DOI] [PubMed] [Google Scholar]
- 37.Baicker K, Finkelstein A. The effects of Medicaid coverage—learning from the Oregon experiment. N Engl J Med. 2011;365:683–685. doi: 10.1056/NEJMp1108222. [DOI] [PMC free article] [PubMed] [Google Scholar]
Associated Data
This section collects any data citations, data availability statements, or supplementary materials included in this article.
Supplementary Materials
Appendix E1 Codebook
Table E1. Characteristics of included and excluded hospitals.
Table E2. Admissions by hospital characteristics and ED crowding.
Table E3. Full inpatient mortality model results.*
Table E4. Full length-of-stay model results.*
Table E5. Full-cost model results.*