

SUMMARY
Feedforward inhibition sharpens the precision of neurons throughout ascending auditory pathways, including the binaural neurons of the medial superior olive (MSO). However, the biophysical influence of inhibition is poorly understood, particularly at higher frequencies where the relative phase of inhibition and excitation becomes ambiguous. Here, we show in gerbil MSO principal cells in vitro that feedforward inhibition precedes direct excitation, providing a concurrent hyperpolarization and conductance shunt during EPSP summation. We show with dual patch recordings and dynamic clamp that both the linearity and temporal fidelity of synaptic integration is improved by reducing Kv1 potassium channel conductance during inhibition, which counters membrane shunting even at high frequencies where IPSPs sum. The reduction of peak excitation by preceding inhibition lowers spike probability, narrowing but not shifting the window for detecting binaural coincidence. The interplay between inhibition and potassium conductances thus improves the consistency and resolution of ITD coding across different frequencies.
INTRODUCTION
Feedforward inhibition improves the temporal precision of many types of neurons by hyperpolarizing the membrane potential shortly after the onset of excitation, thereby narrowing the window for suprathreshold summation of excitatory inputs (Cobb et al., 1995; Pouille and Scanziani, 2001; Ingham and McAlpine, 2005; Kuenzel et al., 2011). Inhibition may also shape temporal precision by providing a large conductance increase (shunting inhibition), which reduces the amplitude of excitation and speeds membrane voltage changes (Banke and McBain, 2006; Vida et al., 2006; Howard and Rubel, 2010; Tang et al., 2011).
Inhibition factors prominently in the computation of interaural time differences (ITDs) in the mammalian medial superior olive (MSO), whose neurons use coincidence detection to process cues for sound localization along the azimuth (Grothe and Sanes, 1993; Grothe, 2003; Joris and Yin, 2007). Along with excitatory inputs that convey auditory information from each ear, MSO principal cells receive glycinergic, feedforward inhibitory inputs from both ipsilateral and contralateral sources, the lateral and medial nuclei of the trapezoid body, respectively (LNTB and MNTB; Cant and Hyson, 1992; Kuwabara and Zook, 1992; Grothe and Sanes, 1993, 1994). Studies in vivo have shown that blockade of inhibition broadens the ITD tuning of MSO neurons and shifts peak tuning toward 0 μs ITD (Brand et al., 2002; Pecka et al., 2008). Experimental and modeling studies have proposed a variety of alternative mechanisms to account for the non-zero ITD tuning of MSO neurons, including interactions with voltage-gated sodium channels (Zhou et al., 2005), induction of differential delays in peak depolarization from the two excitatory pathways (Pecka et al., 2008; Leibold, 2010), and summation of asymmetrically rising EPSPs (Jercog et al., 2010). However, the biophysical mechanisms by which inhibition interacts with excitation remain poorly understood, in part because of uncertainty about the relative timing of excitatory and inhibitory inputs.
All models describing the role of inhibition in the MSO require that inhibition is extremely well timed, providing influences consistent across cycles of the acoustic stimulus. However, IPSPs in MSO neurons are ~2-4 ms in duration (Magnusson et al., 2005; Chirila et al., 2007), thus exceeding the period of all but the most low frequency acoustic stimuli. For stable ITD coding inhibition must function similarly in neurons in different tonotopic areas, even in the face of variations in the relative timing and summation of inhibitory conductances, currents and voltages within each stimulus cycle.
In the present study, we show that feedforward inhibition precedes excitation in the gerbil MSO using a thick slice preparation containing the complete auditory brainstem from the auditory nerve to the superior olivary complex. Using local stimulation, we establish that inhibition undergoes temporal summation at frequencies as low as 200 – 300 Hz. With dual recordings from single MSO neurons and dynamic clamp, we demonstrate a novel interaction between inhibition and low voltage-activated (Kv1) potassium channels, where decreased activation of Kv1 conductance helps to offset the conductance shunt introduced by inhibition, thus reducing distortion of EPSP shape, even at high frequencies. Because Kv1 channels provide strong resting conductances in many neurons throughout subcortical auditory pathways, this compensatory mechanism may stabilize the coding of temporal information throughout the auditory system.
RESULTS
The CN-SO slice
To investigate the synaptic and temporal dynamics of the primary input pathways to the MSO, we developed a novel brain slice preparation that retains the bilateral circuitry from the auditory nerves to the MSO intact. This 1.0 - 1.5 mm thick preparation contains proximal portions of the auditory nerves, the cochlear nuclei with their intrinsic feedback circuits, and both superior olivary complexes. With this Cochlear Nucleus-Superior Olive (CN-SO) slice (Figure 1A), responses to auditory nerve stimulation could be recorded in MSO neurons from P15-20 gerbils. To stimulate the nerves, the cut ends of the nerves were drawn into suction electrodes. Shocks to either nerve elicited EPSPs, IPSPs, or mixtures of EPSPs and IPSPs in whole cell current clamp recordings from MSO neurons. Response types varied from slice to slice, probably due to imperfect recruiting of circuitry by stimulation. Nonetheless, the presence of mixed excitatory and inhibitory responses in a subset of recordings indicates that the circuitry is in place for MSO neurons to receive bilateral excitatory and inhibitory afferents. EPSPs most likely arose from auditory nerve activation of spherical bushy cells in the cochlear nuclei (blue cells, Figure 1B). Contralateral IPSPs probably resulted from a trisynaptic pathway involving activation of inhibitory MNTB neurons, while ipsilateral inhibition likely came from a trisynaptic pathway involving activation of inhibitory LNTB neurons (Cant and Hyson, 1992; Kuwabara and Zook, 1992).
Figure 1. Auditory nerve stimulation evokes EPSPs with preceding IPSPs in MSO neurons.
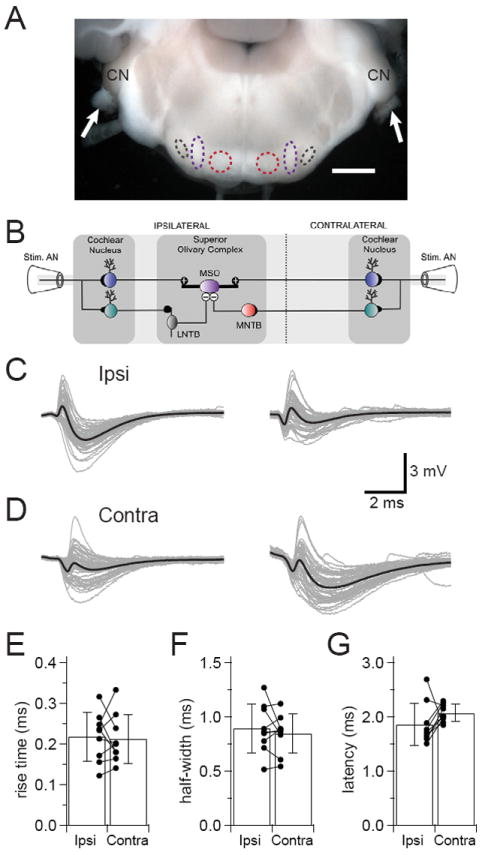
(A) Micrograph of a 1200 μm thick CN-SO slice. Arrows point to auditory nerve stumps where suction electrodes were placed to stimulate afferent pathways. The cochlear nuclei (CN), LNTB (black), MNTB (red), and MSO (purple) are intact in the slice. Scale bar = 1 mm. (B) Diagram of circuitry in the CN-SO slice. AN=auditory nerve. Blue and green cells represent spherical and globular bushy cells, respectively. (C, D) Sample recordings from four MSO neurons from P15-17 gerbils show IPSPs preceding EPSPs in response to ipsilateral (C) or contralateral (D) auditory nerve stimulation. Overlays of 50 sweeps in gray with average responses in black. (E, F, G) In recordings from cells where bilateral auditory nerve stimulation evoked only EPSPs, ipsilateral and contralateral stimuli evoked EPSPs with similar 20-80% rise times (E, p =0.776, n = 9) and half-widths (F, p =0.413, n = 9), and ipsilateral EPSPs tended to arrive with shorter latencies than contralateral EPSPs (G, p =0.192, n = 9). Error bars show SD.
In instances where stimulation of a single auditory nerve evoked mixtures of EPSPs and IPSPs (Figure 1C, 1D), the onset of IPSPs always preceded the onset of EPSPs (IPSP to EPSP latency at 20% rise times: ipsilateral, mean = 0.32 ± 0.13 (SD) ms, n = 6; contralateral, mean = 0.38 ± 0.09 (SD) ms, n = 6; data from 10 cells, 2 of which yielded both ipsilateral and contralateral data). There was not a significant difference in mean IPSP to EPSP latencies between the ipsilateral and contralateral sides (p = 0.341), and the latency distributions overlapped (ipsilateral, min = 0.15 ms, max = 0.53 ms, median = 0.31; contralateral, min = 0.29, max = 0.54, median = 0.38). IPSPs preceded EPSPs even though the inhibitory input pathways involve one more synapse and cell than their excitatory counterparts. In those cells where shocks to both auditory nerves elicited only EPSPs, there was no difference in amplitudes, rise times, or half-widths between ipsilateral and contralateral EPSPs (Figure 1E, 1F; mean ± SD: amps – ipsi = 5.13 ± 1.66 mV, contra = 6.87 ± 3.54 mV, p = 0.216; 20-80% rise times – ipsi = 0.22 ± 0.06 ms, contra = 0.21 ± 0.06 ms, p =0.776; half-widths – ipsi = 0.89 ± 0.23 ms, contra = 0.85 ± 0.18 ms, p = 0.413; n = 9) and there was a trend for ipsilateral EPSPs to arrive with shorter latencies than contralateral EPSPs (Figure 1G; mean ipsi to contra latency difference = 0.20 ± 0.15 ms, p =0.192, n = 9). Both ipsilateral and contralateral EPSPs had jitters that were less than 2% of the latencies, suggesting that conduction time to the MSO was highly reliable (jitter = SD of latency; ipsilateral, 0.03 ± 0.004 ms; contralateral, 0.04 ± 0.01 ms; p = 0.422).
Effects of inhibition on the temporal properties of EPSPs
The CN-SO slice provides the first direct evidence that inhibition arrives at the MSO before excitation. Given that MSO neurons must maintain microsecond temporal precision to accurately detect the coincidence of incoming EPSPs, we wondered how preceding inhibition influences EPSP temporal dynamics. The chloride reversal potential in MSO neurons is ~ -90 mV (Magnusson et al., 2005), meaning that IPSPs affect membrane computations through membrane hyperpolarization and by adding a shunting conductance that decreases the membrane time constant. To gain separable control over these aspects of inhibition, we used two electrode dynamic clamp recordings (Prinz et al., 2004; Economo et al., 2010) to simulate inhibitory conductances in MSO neurons in conventional 200 μm-thick slices (Figure 2A). The two electrode dynamic clamp simulates conductances by taking membrane potential readings from one recording electrode and injecting current through the other recording electrode according to IIPSG = g(t)*(Vm - Erev). Conductance values (g) and reversal potentials (Erev) were controlled in real time through commands sent directly to the dynamic clamp from the data acquisition software. Two electrode recordings avoided the errors in membrane potential measurement and driving force calculations that occur when large currents are injected through the series resistance of the same electrode as used to monitor the membrane potential.
Figure 2. Preceding inhibitory conductance steps do not alter EPSP shape.
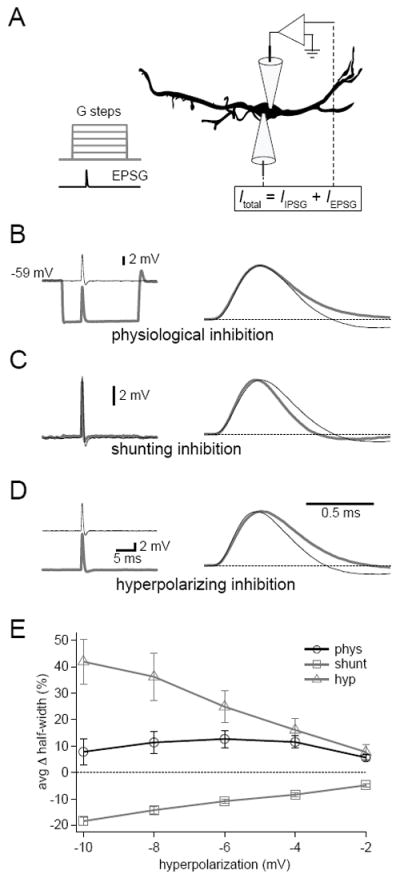
(A) The two electrode dynamic clamp recording configuration used in Figures 2-4. The top electrode was used to monitor Vm, the bottom to inject currents simulating inhibitory and excitatory conductances. (B-D) EPSPs simulated in the presence (gray) or absence (black) of physiological (B, Einhib = -85 mV, g = 100 nS), shunting (C, Einhib = Vrest, g = 100 nS), or hyperpolarizing (D, DC current injection to elicit -10mV change, average = - 3.90 ± 1.08 nA) inhibitory steps. Steps began 5 ms before the onset of EPSPs. On the right, normalized traces highlight effects on EPSP shape. (E) Across a range of inhibitory step magnitudes, physiological inhibition had little effect on EPSP half-widths. In contrast, purely shunting inhibition tended to narrow half-widths and hyperpolarizing DC current steps broadened half-widths. Error bars show SEM. n = 7. Data from P27-30 gerbils.
We first used the dynamic clamp to examine the effects of concurrent inhibitory conductances on simulated excitatory conductances (EPSGs). To more readily grasp the factors at play during synaptic integration, we initially left out the dynamic aspects of inhibition by simulating inhibitory conductance steps. EPSGs were simulated by the dynamic clamp using EPSC kinetics based on the kinetics of the fastest EPSCs measured in MSO neurons from mature (P60-100) gerbils (time constants = 0.1 ms rise, 0.18 ms decay; Couchman et al., 2010). EPSG kinetics were biased toward the fastest rather than average values because limitations on the speed of voltage clamp recordings at such fast time scales mean that average values likely overestimate the true values. Peak excitatory conductances were adjusted to elicit 6-8 mV EPSPs in the absence of inhibition. Synaptic activity was blocked with glutamate and glycine receptor antagonists (20 μM CNQX, 50 μM D-APV, and 1 μM strychnine). In each trial, an inhibitory step was initiated 5 ms before the onset of the EPSG (Figure 2A). In the presence of physiological inhibition, where both the shunting and hyperpolarizing components of inhibition were simulated by the dynamic clamp, 0-100 nS inhibitory conductance steps yielded 0-10 mV hyperpolarizations (Figure 2B). To our surprise the half-widths of EPSPs in the presence of the maximal inhibitory conductance were not significantly different from those evoked in the absence of inhibition (Figure 2E; control, 0.52 ± 0.02 ms vs. physiological, 0.56 ± 0.03 ms, n = 7, p = 0.17). There was, however, a slight change in EPSP shape, notably a lack of afterhyperpolarization and a trend toward a slight increase in half-width. To isolate the contribution of the shunting component of inhibition, the inhibitory reversal potential was set to the resting membrane potential (Figure 2C). Shunting inhibition significantly narrowed the EPSP at the maximal conductance change (control, 0.52 ± 0.01 ms vs. shunting, 0.43 ± 0.01 ms, n = 7, p < 0.001). To isolate the hyperpolarizing component of inhibition, the dynamic clamp was bypassed and hyperpolarizing steps of DC current were injected (Figure 2D). EPSPs were significantly broadened by these hyperpolarizing steps (control, 0.50 ± 0.01 ms vs. -10 mV hyperpolarizing, 0.72 ± 0.05 ms, n = 7, p = 0.003). Taken together, these results show that EPSP half-widths changed little over a wide range of inhibitory conductance steps in the physiological condition (Figure 2E). This contrasts sharply with the opposing effects of shunting and hyperpolarizing inhibition on EPSP duration (Figure 2E; at maximum conductance or current injection - physiological, 7.86 ± 4.95%; shunting, -18.27± 1.5%; hyperpolarizing, 41.86 ± 8.58%; n = 7). Though half-width was relatively stable in the presence of physiological inhibition, the afterhyperpolarization amplitude diminished significantly across all conditions (physiological, -94.46 ± 10.42%; shunting, -37.17 ± 4.56%; hyperpolarizing, -74.27 ± 12.12%; n = 7, p < 0.01).
Why was EPSP half-width resistant to physiological inhibition? Recent work has shown that low voltage activated Kv1 channels produce voltage dependent sharpening and afterhyperpolarization of EPSPs in MSO neurons (Mathews et al., 2010). We hypothesized that reduced activation of Kv1 channels could counter temporal distortions of EPSPs by inhibitory shunting. To test this hypothesis, we examined the effects of inhibitory steps on EPSP half-width in the presence of the Kv1 channel blocker α-dendrotoxin. As before, maximal physiological inhibition did not alter EPSP half-width greatly (Figure 3A; 16.37 ± 4.81%, control, 0.50 ± 0.02 (SD) ms vs. physiological, 0.58 ± 0.08 (SD) ms, p =0.09), although in this data set submaximal inhibition induced a significant increase in EPSP half-width (asterisks in Figure 3D). In the presence of α-dendrotoxin, physiological inhibition induced a significant reduction in EPSP half-width (Figure 3B; -28.37 ± 2.73%, DTX, 1.43 ± 0.24 (SD) ms vs. DTX + physiological, 1.02 ± 0.18 (SD) ms, p < 0.001). The shunting component of inhibition alone was sufficient to induce this change (Figure 3C; -28.93 ± 1.28%, DTX, 1.47 ± 0.27 (SD) ms vs. DTX + shunt, 1.05 ± 0.22 (SD) ms, p < 0.001), suggesting that the decrease in membrane time constant caused by the shunt was responsible. These results indicate that reduced activation of Kv1 channels in response to the hyperpolarizing component of inhibition compensates for the inhibitory shunt, preventing this shunt from narrowing EPSP shape (Figure 3D).
Figure 3. Kv1 channels help maintain EPSP shape during inhibitory conductance steps.
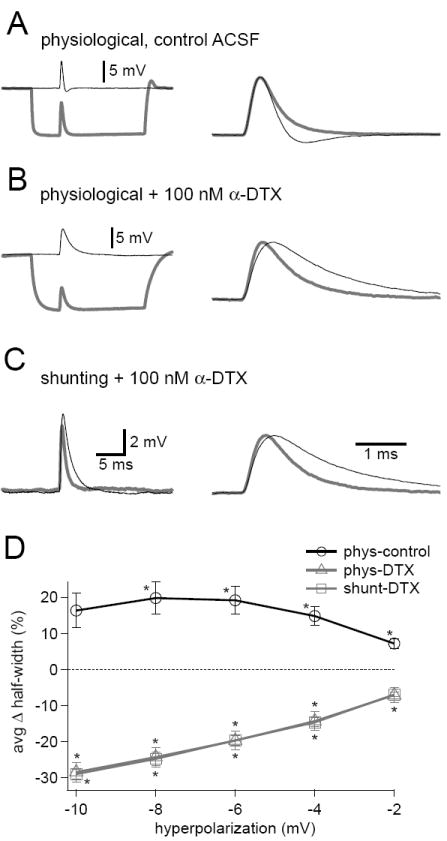
(A-C) Control EPSPs (black) and EPSPs during inhibitory conductance steps (gray). Normalized EPSPs shown to the right. In control ACSF (A), a 100 nS physiological inhibitory step had little effect on EPSP half-width, but note the decreased afterhyperpolarization in the presence of inhibition. When 100 nM α-dendrotoxin was added to the bath to block Kv1 channels, EPSP half-width decreased in the presence of a 100 nS step of physiological (B) or purely shunting (C) inhibition. (D) As inhibitory conductance steps increased, EPSP half-widths remained relatively stable in control ACSF but became progressively narrower in the presence of α-dendrotoxin. Error bars show SEM, n =6. * p < 0.05 with repeated measures ANOVA.
We next examined how the kinetic properties of IPSPs affected EPSP shape. The dynamic clamp was set to mimic an inhibitory conductance with kinetics (time constants = 0.28 ms rise, 1.85 ms decay) based on those measured for IPSCs in MSO neurons by Magnusson et al. (2005; P17-25 gerbils) and Couchman et al. (2010; P60-100 gerbils). EPSGs were injected at various time points from 0 to 5 ms after the start of IPSGs. In the presence of shunting and hyperpolarizing inhibition, EPSP half-widths remained remarkably stable (Figure 4A, 4E). EPSP peaks, however, occurred slightly earlier when EPSPs began within the first millisecond of the IPSP (Figure 4D). Purely shunting inhibition reduced EPSP half-widths and advanced EPSP peak times at every time interval tested (Figure 4B, 4D, 4E). Hyperpolarizing IPSPs (no conductance shunt) had the opposite effect – EPSP half-widths increased at every time interval and peak times were delayed at IPSP to EPSP delays > 0.5 ms (Figure 4C-4E). The resistance of EPSPs to shape changes in the presence of physiological inhibition suggests that reduced activation of Kv1 channels offsets some of the increased conductance introduced by the IPSG even when the IPSG is rapidly changing, as occurs during its rising phase. IPSPs preceded EPSPs by ~300-400 μs in our CN-SO slice recordings. Within this time frame physiological inhibition did not affect EPSP half-widths but did advance peak times by 30-50 μs. This change in peak times likely reflects the lag between the rise of the IPSP and the deactivation of Kv1 channels.
Figure 4. IPSP kinetics have little effect on EPSP shape.
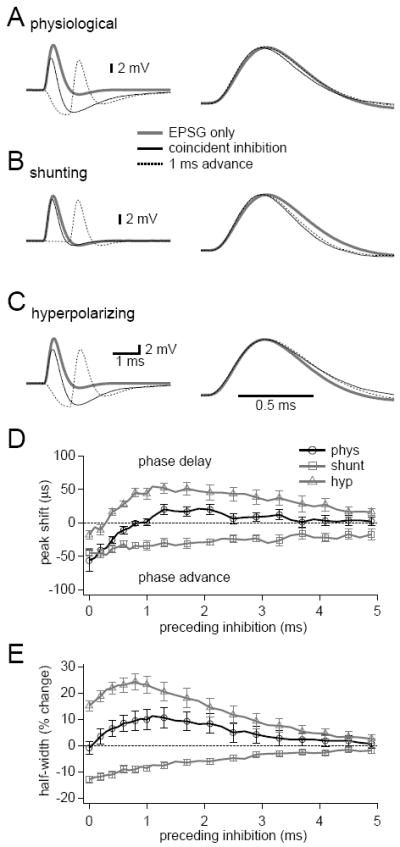
(A-C) Inhibitory conductances were simulated with dual exponential waveforms (time constants = 0.28 ms rise, 1.85 ms decay). EPSGs were simulated at 0-5 ms after the onset of inhibition. Normalized traces are shown to the right. EPSP shape remained consistent in the presence of physiological inhibition (A), peaked earlier and narrowed in the presence of purely shunting inhibition (B), and peaked later and widened in the presence of hyperpolarizing DC currents (C). (D, E) Summaries of effects of inhibition on EPSP peak times (D) and half-widths (E). Note that physiological inhibition slightly advanced the peak times of EPSGs evoked during the first 1 ms of an IPSG. For clarity, lines follow every data point, but markers and error bars are shown for every other data point. Error bars show SEM, n =8.
Stability of coincidence detection in the presence of inhibition
With Kv1 channel deactivation countering the effects of inhibition, we hypothesized that the temporal accuracy of coincidence detection remains robust in the presence of IPSPs. To test this, we conducted in vitro coincidence detection experiments. Stimulating electrodes were placed in the afferent pathways on the medial and lateral sides of the MSO (Figure 5A) and inhibitory synaptic transmission was pharmacologically blocked. This allowed us to evoke real EPSPs with bilateral stimulation, thus avoiding the limitations of simulating fast, dendritic events with dynamic clamp at the soma. Stimulus strength was set so that individual EPSPs were below spike threshold. Two electrode whole cell current clamp recordings were made from MSO neurons to permit simulation of IPSGs or IPSCs, as above. Based on the CN-SO slice recordings, IPSGs and IPSCs were set to elicit ~3 mV IPSPs with onsets starting 300 μs prior to the 20% rise of the contralateral EPSP. For simplicity, ipsilateral and contralateral IPSPs were simulated as one waveform because the shape of a summed bilateral IPSP differs little from a single IPSP over the narrow range of time intervals where coincidence detection takes place. Ipsilateral EPSPs were evoked so that their onset occurred in 50 μs intervals covering a range of ± 600 μs relative to the onset of the contralateral EPSP. We refer to the time differences between the ipsilateral and contralateral EPSP onsets as interstimulus time differences (ITDs) as they are analogous to the interaural time differences MSO neurons detect in vivo. The physiologically relevant range of ITDs for the gerbil is ±135 μs (Maki and Furukawa, 2005). Data were analyzed to determine instances when bilateral EPSPs crossed threshold and evoked an action potential (see Experimental Procedures and Figure S1).
Figure 5. The effects of inhibition on coincidence detection.
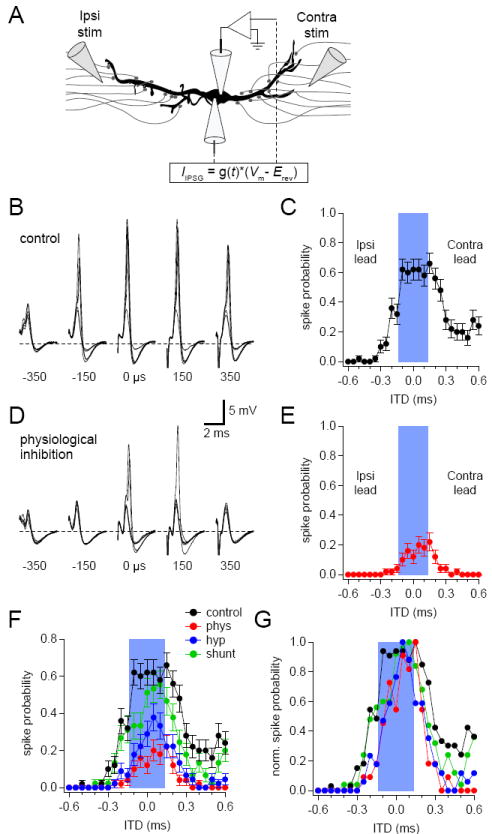
(A) The two electrode dynamic clamp recording configuration used for coincidence detection experiments. Ipsilateral and contralateral stimulating electrodes activated excitatory afferents at time intervals covering ± 0.6 ms while the dynamic clamp was used to simulate inhibitory conductances starting 0.3 ms before the onset of contralateral EPSPs. (B, D) Sample data from a representative cell showing overlays of 5 of 55 coincidence trials at each ITD value shown in (D) in the absence (B) or presence (D) of preceding physiological inhibition. (C, E) ITD spike probability functions in the absence (C) or presence (D) of physiological inhibition were constructed by determining the portion of trials at each ITD value that yielded an action potential. (F, G) Summary plots showing the results of ITD trials in the absence or presence of physiological, shunting, or hyperpolarizing inhibition from the cell shown in (B-E). Plots in (G) are normalized to highlight effects of inhibition on ITD function shape. Blue bars in (C, E, F, G) indicate the physiological range (± 135 μs) for ITD detection. Error bars show SEM. See also Figures S1, S2, and S3.
Four conditions were tested with this experimental setup. In the control condition, IPSPs were omitted so that suprathreshold summation of EPSPs alone could be examined (Figure 5B). Control trials generated ITD spike probability functions that peaked within the physiological ITD range (Figure 5C) and which bear a strong resemblance to ITD functions generated by in vivo recordings (e.g. Yin and Chan, 1990; Brand et al., 2002; Pecka et al., 2008; Day and Semple, 2011). In the physiological inhibition condition, injection of IPSGs during bilateral excitation produced IPSPs that exhibited both shunting and hyperpolarizing components of the IPSP (Figure 5D). These IPSPs reduced spike probabilities throughout the ITD function, but the highest spike probabilities remained in or near the physiological range (Figure 5E). Physiological IPSPs also appeared to narrow the ITD function, as can be seen in the normalized plot in Figure 5G. Shunting inhibition only slightly reduced the amplitude of ITD functions, whereas the injection of hyperpolarizing currents (no shunting conductance) caused decreases in ITD functions similar to those observed with physiological inhibition (Figure 5F). The effects of inhibition on coincidence detection followed a similar pattern across cells (e.g. Figure S2).
To assess how inhibition and its components affected the temporal information and shape of ITD functions, we used bootstrap analysis, a resampling procedure that allows statistical measures to be made without imposing a particular distribution (see Experimental Procedures). This analysis showed that the mean or median masses of the ITD functions from any particular cell were often not equal to zero. However, differences from zero were balanced across the 8 cells in the data set such that the average mean and median masses of ITD functions did not significantly differ from 0 ms for any of the conditions tested (Figure 6A and 6B). This result suggest that there was no systematic bias for neurons to prefer ipsilateral or contralateral leading stimuli. In addition, there were no significant differences between any two conditions, indicating that neither physiological inhibition nor its shunting and hyperpolarizing components induced a significant change in the preferred ITDs of MSO neurons. In contrast, physiological and hyperpolarizing inhibition significantly decreased the maximal spike probabilities attained by ITD functions and significantly narrowed the half-widths of ITD functions (Figure 6C and 6D). Shunting inhibition did not alter these properties relative to control. These results indicate that the best ITD of an MSO neuron is not significantly altered by preceding inhibition. Inhibition does, however, dampen the responsiveness of MSO neurons while rendering them selective for a narrower range of ITDs. This suggests that inhibition provides a mechanism for rapidly adjusting the sensitivity of MSO neurons without shifting preferred ITDs. Thus, the temporal accuracy of coincidence detection is enhanced, not degraded, by inhibition.
Figure 6. Inhibition dampens and narrows ITD functions without shifting best ITDs.
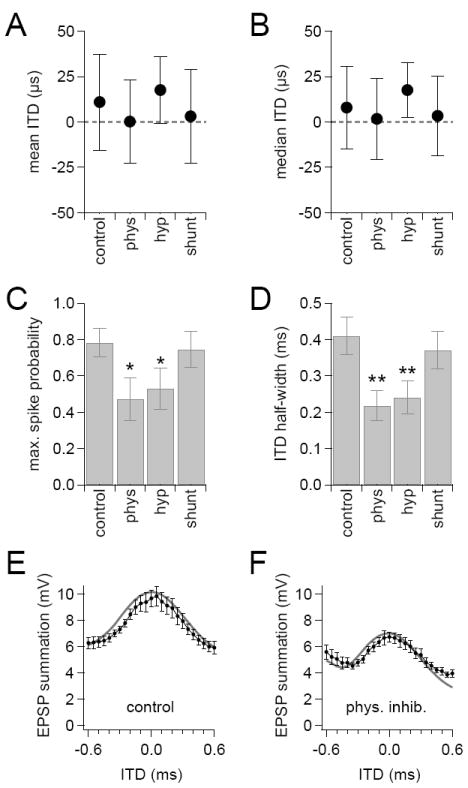
Bootstrap analysis of results of ITD trials from 8 MSO neurons revealed that inhibition did not significantly shift the mean (A) or median (B) mass of ITD functions with respect to time. Physiological inhibition and hyperpolarizing DC current injections did, however, significantly decrease the maximal spike probability (C) and half-width (D) of ITD functions. (E, F) Subthreshold summation of ipsilateral and contralateral EPSPs (black data) across a range of ITD values in the absence (E) or presence (F) of physiological inhibition. Gray lines show the amount of summation predicted by the arithmetic sums of average PSP waveforms aligned according to ITD. Error bars show SEM. Data from P21-25 gerbils. * p<0.05, ** p<0.01. See also Figure S3.
In a related set of experiments, coincidence detection trials were conducted to examine the effects of inhibition on subthreshold summation. Afferent stimulus strengths were adjusted in these experiments so that bilateral EPSPs remained subthreshold (Figure S3A and S3C). In both the absence and presence of inhibition, subthreshold summation was remarkably linear, nearly matching the summation predicted from the arithmetic sums of average PSP waveforms (Figure 6E and 6F). ITD functions were generated by measuring the maximal depolarization attained during each coincidence trial (Figure S3B and S3D). Lacking a threshold mechanism to select for the largest events, subthreshold ITD functions were broader and flatter than spike-based ITD functions. Similar to the spiking responses, inhibition did not alter the mean or median mass of ITD functions (Figure S3E and S3F), whereas physiological inhibition and its hyperpolarizing component significantly decreased the peak and half-width of subthreshold ITD functions (Figure S3G and S3H). These results suggest that the effects of inhibition on spike probability ITD functions are a direct reflection of how inhibition shapes subthreshold summation.
The Role of Kv1 channels in high frequency coincidence detection
ITD computations are usually made within the phase-locking range of input neurons, which extends up to ~2 kHz (Johnson, 1980; Joris et al., 1994). Given that even brief sounds generate multiple stimulus cycles, the duration of IPSPs suggests that they will sum at higher frequencies, possibly complicating synaptic coincidence detection. To test whether IPSPs sum, we recorded from MSO neurons while using stimulating electrodes to evoke 100-800 Hz trains of ten ipsilateral or contralateral IPSPs. Both ipsilateral and contralateral IPSPs showed clear evidence of temporal summation (Figure 7A, B). We quantified this by measuring the amount the membrane potential was hyperpolarized relative to rest at the foot of each IPSP and comparing this to the peak amplitude of the first IPSP in the train. This showed that there was significant summation of ipsilateral IPSPs at frequencies of 300 Hz and greater (Figure 7C) and of contralateral IPSPs at frequencies of 200 Hz and greater (Figure 7D). Under in vivo conditions, where inhibition is presumably binaural and subject to more temporal jitter than observed with local afferent stimulation in slice, the summation of IPSPs is likely even greater than observed here. The presence of this summation suggests that IPSPs occurring later in a train will contribute to the temporal dynamics of coincidence detection differently than earlier IPSPs.
Figure 7. Temporal summation of IPSPs during high frequency trains.
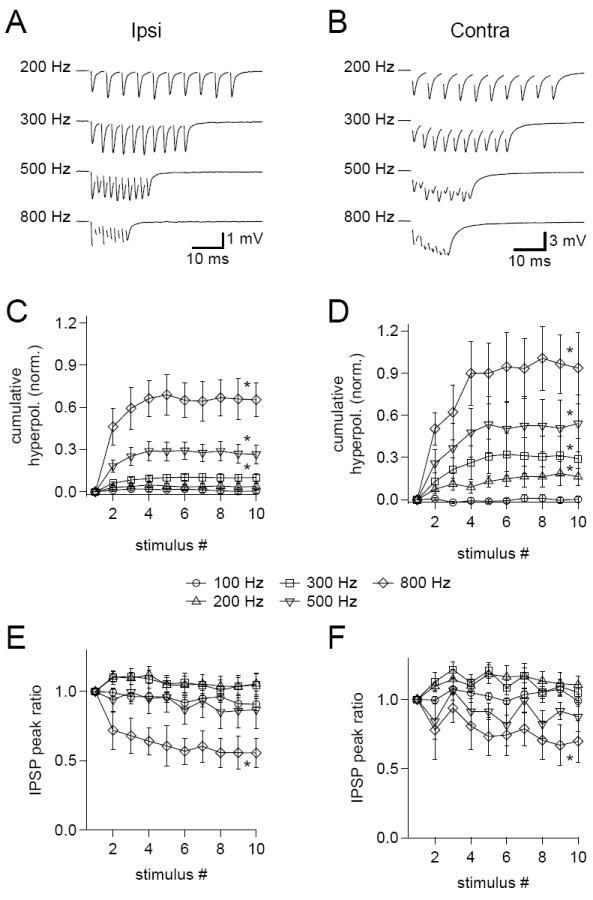
(A,B) Sample data showing trains of IPSPs evoked by ipsilateral (A) and contralateral (B) stimuli at the indicated frequencies. Data are from the same cell and are averages of 50 trials. Stimulus artifacts have been removed. (C,D) Hyperpolarization of the membrane potential relative to rest at the onset of each IPSP in ipsilateral (C) and contralateral (D) trains increased with increasing stimulus frequency. Data are normalized to the peak amplitude of the first IPSP in the train. (E,F) The ratios of the peak amplitudes of each IPSP in ipsilateral (E) and contralateral (F) trains to the amplitude of the first IPSP in a train show that there was no significant short term depression until the train frequency was > 500 Hz. Error bars show SEM. Ipsilateral n=9, contralateral n=7, with ipsilateral and contralateral IPSPs evoked together in 5 cells. Data from P25-32 gerbils. * p < 0.05 for one-tailed paired t-test comparing the mean of the final three events in a train to the first event.
We also examined how the peak amplitudes of IPSPs, as measured from the foot to the peak of each event, varied during the train relative to the amplitude of the first event. Previous studies have found that IPSCs undergo significant short term depression during repetitive stimuli at frequencies as low as 0.5 Hz (Couchman et al., 2010; Fischl et al., 2012). In contrast, we found no significant change in either ipsilateral or contralateral IPSP peak ratios until the train frequency reached 800 Hz, where there was significant short term depression (Figure 7E, F). This relative lack of depression can likely be attributed to the lower extracellular Ca2+ used in the present study (1.5 mM) compared to the earlier studies (2 mM). In the MNTB, the amount of synaptic depression at the calyx of Held synapse is significantly reduced and more closely approximates in vivo observations when extracellular Ca2+ is reduced to levels matching those that have been identified in interstitial fluid (1.2 – 1.5 mM; Lorteije et al., 2009).
Our earlier dynamic clamp observations suggest that Kv1 channels counteract the temporal distortions introduced by inhibitory conductance changes during individual coincidence detection trials. We wondered whether this mechanism would continue to preserve temporal accuracy when neurons were challenged with the high frequency trains of EPSPs and summating IPSPs they presumably encounter in vivo. We therefore devised a two electrode dynamic clamp experiment to investigate how Kv1 and inhibitory conductances interact during high frequency trains (Figure 8A). In these experiments, endogenous K+ channels were blocked by including 5 mM 4-AP in the intracellular solution, and the dynamic clamp was used to simulate the missing Kv1 conductance. 4-AP is an intracellular blocker of Kv1 and Kv3 channels (Choquet and Korn, 1992; Stephens et al., 1994; Hille, 2001) and was selected in preference to a more specific extracellular blocker to avoid altering presynaptic excitability. Since ~90% of low voltage-activated K+ current is mediated by Kv1 channels in MSO neurons (Scott et al., 2005), non-specific effects of 4-AP were minimal in this experiment. Also, because Kv1 channel expression is biased toward the soma (Mathews et al., 2010), the dynamic clamp provided a reasonable approximation of the endogenous conductance. Taking advantage of the fact that Kv1 channels cause voltage dependent sharpening of EPSPs, the amount of Kv1 conductance needed to replace the blocked endogenous channels was set by adjusting the Kv1 conductance in the dynamic clamp until EPSP half-widths matched those observed in the absence of 4-AP (Figure 8B; mean Kv1 Gmax = 630 ± 37 nS). This method also restored the membrane time constant to control levels (4-AP, 2.20 ± 0.46 ms; 4-AP + GKv1, 0.36 ± 0.02 ms; Scott et al., 2005). As with the previous coincidence detection trials, ipsilateral and contralateral excitatory afferents were activated with stimulating electrodes while inhibitory synaptic transmission was pharmacologically blocked. Trains of ten bilateral EPSPs were evoked at 500 and 800 Hz, and the relative time between the onset of ipsilateral and contralateral EPSPs was adjusted to cover an ITD range of ± 600 μs in 50 μs steps. Inhibitory conductances were simulated to elicit 3 mV IPSPs using the dynamic clamp as described above. These IPSPs summed during 500 and 800 Hz trains (data not shown). After the completion of a recording, voltage records were sent back through the dynamic clamp and the current command output was used to calculate the simulated Kv1 conductance throughout each trial.
Figure 8. Kv1 channel deactivation partially compensates for the additional conductance contributed by physiological inhibition.
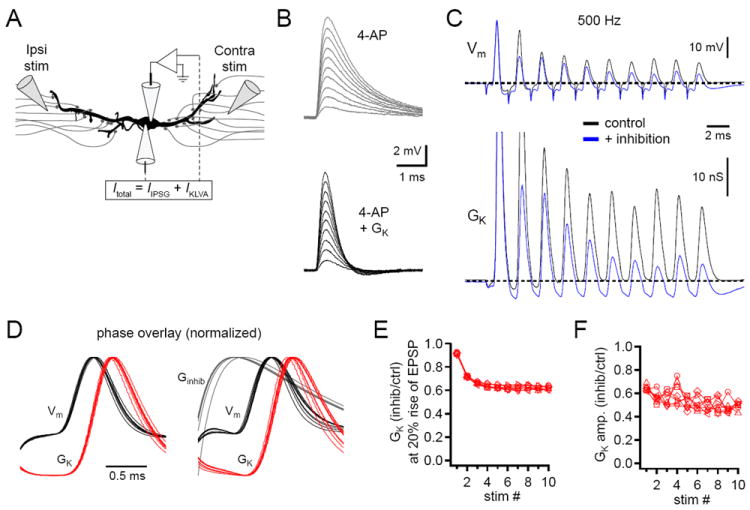
(A) Two electrode dynamic clamp configuration used for ITD train experiments. Endogenous K+ channels were blocked with 5 mM intracellular 4-AP. Kv1 and inhibitory conductances were simulated by dynamic clamp. (B) The amount of Kv1 conductance required to replace the blocked endogenous conductance was determined by measuring the half-widths of simulated EPSPs evoked by 5-50 nS EPSGs. Sample traces show EPSPs before (top, mean half-width = 1.20 ms) and after (bottom, mean half-width = 0.59 ms) Kv1 conductance was introduced by the dynamic clamp. (C) Sample traces showing voltage (top) and Kv1 conductance changes (bottom) in response to 500 Hz trains with ITD values = 0 ms in the absence (black) and presence (blue) of inhibition. Dashed lines indicate Vrest of -60 mV (top) and resting Kv1 conductance of 11 nS (bottom). (D) Averaged and normalized subthreshold responses from ten 500 Hz trains at 0 ITD from the cell shown in C. Cycles of the train are overlaid according to phase. Data on the left are from the control condition, on the right were in the presence of physiological inhibition. (E) Summary plot of average inhibition-induced decrease in Kv1 conductance at the 20% rise times of EPSPs during 500 Hz trains (n = 5). (F) Summary plot of the change in Kv1 conductance elicited by EPSPs in the presence versus the absence of inhibition (n = 5). ITD values covering ±150 μs are shown in (E, F). Data from P21-23 gerbils. See also Figure S4.
MSO neurons responded to bilateral trains with mixtures of action potentials and subthreshold EPSPs (Figure 8C and Figure S4A). Conductance records demonstrate that the fast kinetics of Kv1 channels allowed channel activation and deactivation in response to every event in a train, even at 800 Hz. Prior to the onset of a train, 14.6 ± 1.9 nS (SD, n = 5) of Kv1 conductance was activated. In the control condition, Kv1 conductance returned to baseline before the next cycle of inputs arrived, except in cases where the preceding cycle yielded an action potential (e.g. first response). In the presence of inhibition, the Kv1 conductance consistently dropped below the baseline conductance between cycles in the train. The temporal relationship between the membrane potential and the Kv1 conductance can be more readily observed when all the events in a train are overlaid according to phase. Figure 8D shows phase-aligned, averaged, and normalized subthreshold responses to 500 Hz trains at 0 ITD in the absence and presence of inhibition. It is clear that throughout the trains, the Kv1 conductance was near a minimum at the onset of the summed EPSPs and peaked during the decay phase of EPSPs. To quantify this, we measured for each cycle of the trains the amount of Kv1 conductance active at the 20% rise of the summed EPSPs and the trough-to-peak change in Kv1 conductance. Conductance levels at the 20% rise influence how quickly an EPSP depolarizes the cell, i.e. the rise time of the EPSP. These data show that Kv1 conductance was reduced in the presence of inhibition relative to control (Figure 8E and Figure S4B). The amount of additional Kv1 conductance activated by EPSP-induced depolarization influences the duration of those EPSPs. Analysis of the change in Kv1 conductance during each cycle revealed that ~40-60% less Kv1 conductance was activated by EPSPs in the presence of inhibition than in the control condition (Figure 8F and Figure S4C). Together, these results indicate that the reduced Kv1 conductance counteracts the inhibitory shunt, helping preserve temporal accuracy in the presence of high frequency, summating inhibition.
DISCUSSION
The temporal accuracy and frequency limit of neuronal computations is heavily influenced by the membrane time constant, which becomes faster in the presence of an inhibitory shunt. Circuits that use temporal coding therefore face the challenge of maintaining temporal fidelity when using synaptic inhibition to regulate responsiveness. This challenge is particularly acute when temporal coding occurs at frequencies where the period is shorter than the duration of inhibition. Here we showed in MSO neurons that reductions in Kv1 channel activation compensate for inhibitory conductance changes, thereby helping to maintain the temporal accuracy of coincidence detection, even during high frequency trains when IPSPs sum. Accordingly, we found that during in vitro binaural coincidence detection experiments preceding inhibition summed linearly with excitation and sharpened ITD response functions. Thus, the interplay between inhibition and Kv1 channels provides a novel mechanism that helps preserve the timing of EPSPs while simultaneously sharpening binaural coincidence detection.
Reciprocal interplay between inhibition and Kv1 channels
Kv1-containing K+ channels are broadly expressed in many areas of the brain (Sheng et al., 1994; Wang et al., 1994; Trimmer and Rhodes, 2004), and are found in especially high density in auditory brainstem neurons concerned with the precise coding of temporal information, including the MSO (e.g. Bal and Oertel, 2001; Dodson et al., 2002; Rothman and Manis, 2003; Oertel et al., 2008; Johnston et al., 2010). Mouse knockouts of Kv1.1 show deficits in sound localization (Allen and Ison, 2012), likely reflecting altered excitability and precision in neurons of the superior olivary nuclei and their associated inputs (Brew et al., 2003; Kopp-Scheinpflug et al., 2003; Gittelman and Tempel, 2006). Previous work in MSO neurons has shown that Kv1 channels reduce temporal distortions of EPSPs by dendritic cable filtering and enhance detection of binaural coincidence at high frequencies (Svirskis et al., 2002, 2004; Scott et al., 2005; Mathews et al., 2010).
In the present study, we found that the rise time and duration of EPSPs during concurrent shunting inhibition are stabilized by two factors: the deactivation of resting Kv1 conductance and reduction in the amount of Kv1 conductance recruited by the smaller peak depolarization. In this way inhibitory and Kv1 channel dynamics regulate the uniformity of EPSPs during different levels and frequencies of inhibition and improve the linearity of synaptic integration. Two properties of Kv1 channels are critical for these effects. First, the resting potential of MSO neurons resides at a sensitive region of the activation curve of Kv1 channels (Mathews et al., 2010), allowing small changes in EPSP peaks to lead to large changes in Kv1 channel open probabilities. In addition, the hyperpolarization associated with inhibition is sufficient to substantially deactivate resting Kv1 conductances. Our data show that this deactivation can approach 50% in the presence of summating trains of even modest (3 mV) IPSPs. Second, Kv1 channels have rapid kinetics. This allows Kv1 channels to begin responding to changing membrane potentials within the rise times of EPSCs and IPSCs. Over longer time frames, these rapid kinetics enabled Kv1 channels to deactivate and activate in response to IPSPs and EPSPs in each cycle of coincidence detection trains. This likely explains why Kv1 channel activation dynamics appeared relatively insensitive to changing ITD values during trains of EPSPs and IPSPs.
Kv1 channels also have interactions with other voltage-gated channels in MSO neurons. Previous work has shown that voltage gated sodium channels boost near-threshold EPSPs, offsetting the suppression of EPSP peaks by Kv1 channels (Scott et al., 2010). In addition, dynamic interactions between Kv1 and hyperpolarization-activated conductances counteract non-linear distortions of EPSP shape and summation (Khurana et al., 2011). Thus, an emerging theme is that MSO neurons combine opposing non-linear conductances to narrow the window for coincidence detection while also maintaining linear synaptic integration.
Interactions between inhibition and Kv1 channels in the avian binaural system
Our results contrast sharply with those from studies of inhibition in the avian binaural system. In neurons of the nucleus laminaris and magnocellularis, avian equivalents of MSO neurons and their excitatory inputs, GABAergic transmission is long lasting (Yang et al., 1999; Kuo et al., 2009), sums temporally at low frequencies, and becomes asynchronous at higher frequencies (Lu and Trussell, 2000). However, in contrast to their mammalian counterparts, the chloride reversal potential in avian neurons is depolarized relative to rest (Hyson et al., 1995; Howard et al., 2007; Tang et al., 2011). Under these conditions inhibition is strongly shunting and the depolarization from both spontaneous and stimulus-evoked release of GABA activates Kv1 channels, narrowing EPSPs as well as the window for binaural coincidence detection (Funabiki et al., 1998; Howard and Rubel, 2010). Thus, for coincidence detection in birds, inhibition and Kv1 channels act synergistically, not homeostatically.
Role of feedforward inhibition in binaural processing in the MSO
The timing of inhibition is crucial to determining how it affects computations. In many circuits, feedforward inhibition restricts the time window for temporal summation of excitatory inputs by arriving with a short delay relative to excitation (Pouille and Scanziani, 2001; Gabernet et al., 2005; Stokes and Isaacson, 2010). This temporal arrangement, where inhibition acts as a stop signal, becomes problematic at high frequencies when an additional cycle of input must be processed before inhibition has ceased. MSO principal neurons receive prominent inhibition (Grothe and Sanes, 1993, 1994) arising from at least 2-4 inhibitory inputs, the majority of which target the soma and proximal dendrites (Clark, 1969; Kapfer et al., 2002; Couchman et al., 2010). Each fiber is powerful, possessing ~50 active zones (Couchman et al., 2010). Using the CN-SO slice preparation, we found that stimulation of the inhibitory inputs to the MSO via the auditory nerves triggers IPSPs in MSO neurons 300-400 μs prior to excitation, a scenario first proposed by Grothe and colleagues for contralateral inputs from the MNTB (Brand et al., 2002). However, our results show that ipsilateral input from the LNTB similarly precedes excitation. With this timing, all sources of inhibition proactively reduce summation of excitatory inputs by decreasing excitability throughout the entire coincidence window. Preceding inhibition also remains functional at high frequencies, when summating, binaurally driven IPSPs provide tonic hyperpolarization that keeps the membrane potential farther from threshold, thus restricting spiking to only the largest, most synchronous combinations of bilateral EPSPs.
It should be noted that stimulation conditions in the CN-SO slice preparation cannot perfectly recreate the fine temporal structure that exists under in vivo conditions where cochlear delays and synaptic jitter cause individual nerve fibers to activate at slightly different times (Shamma et al., 1989; Joris et al., 2006), nor can they recreate the precise activation patterns that would emerge from sound stimuli. Our results, however, provide a simple circuit-based explanation for in vivo studies that have inferred from sound-evoked spike rates that inhibition precedes excitation in the MSO (Grothe, 1994; Grothe and Park, 1998; Brand et al., 2002; Pecka et al., 2008). A more precise understanding of the temporal relationship between IPSPs and EPSPs will require detailed in vivo recordings of subthreshold activity.
The arrival of feedforward inhibition before excitation requires an inhibitory pathway adapted for speed. In the auditory brainstem, several complementary mechanisms might explain how feedforward inhibition arrives at MSO neurons so quickly, despite the additional cell and synapse included in each inhibitory pathway. First, anatomical data indicate that the axons projecting from the cochlear nuclei to the LNTB and MNTB have larger diameters and thus presumably faster conduction velocities than those carrying excitatory input to the MSO (Brownell, 1975). Second, the spacing of nodes of Ranvier in axons projecting from the cochlear nuclei might give the inhibitory pathway an additional speed advantage. There is evidence for regulation of internodal distances in axons projecting from the avian cochlear nucleus (Seidl et al., 2010) and for specialized heminodes with high Na+ channel densities in the axon segments adjoining the calyx of Held terminals in rat MNTB (Leão et al., 2005). Third, each inhibitory pathway contains a synapse specialized for short latency transmission. MNTB neurons receive input via the calyx of Held, the excitatory synapse from globular bushy cells that drives postsynaptic firing with high security (Mc Laughlin et al., 2008; Lorteije et al., 2009; Kopp-Scheinpflug et al., 2011; Borst and Soria van Hoeve, 2012). Calyceal synapses have been found on neurons in the posteroventral portion of the LNTB (Spirou et al., 1998), although their source has not yet been identified.
Previous in vivo studies showed that inhibition is a critical feature of ITD processing in the MSO, as its pharmacological blockade in vivo broadens the window for ITD detection and shifts the best ITDs of MSO neurons toward the midline, although there remains a natural bias towards contralaterally-leading excitation in the absence of inhibition (Brand et al., 2002; Pecka et al., 2008). Using CN-SO slices, we observed a slight bias toward contralaterally-leading excitation in most recordings, in accord with these in vivo findings. In addition, implementing even relatively subtle leading inhibition in vitro reduced the width of the coincidence window for bilateral excitatory stimuli to in vivo-like levels. However, the mechanism(s) underlying inhibition-led shifts in ITD location remains uncertain. We did not observe that the presence of preceding inhibition alone led to shifts in the location of the ITD function, although we found that preceding inhibition advanced the peaks of EPSPs by up to 50 μs. Since inhibition is somatic in MSO neurons, shifts in EPSP peak would affect ipsilateral and contralateral EPSPs similarly, and thus would not necessarily alter the temporal requirements for summation. Consistent with this, we found that preceding inhibition did not shift the mean or median of the subthreshold ITD functions (Figure S3). We also did not observe differences in the rise times of bilateral excitatory inputs, as previously reported in slices (Jercog et al., 2010). It is possible that differences between this result and our own could be due to the inclusion in our CN-SO slices of synaptic processing by the cochlear nucleus. However, in support of our findings, recent results from juxtacellular recordings from MSO neurons in vivo indicate that contralateral and ipsilateral synaptic responses are similar in shape and sum linearly (van der Heijden et al., 2013). While the latter results do not preclude an important role for inhibition in the coding of ITDs, they are inconsistent with the idea that preceding inhibition alone sets ITD selectivity (Grothe, 2003), and indicate instead that ITD detection differs from both inhibitory and Jeffress models in several important aspects. It is not yet clear how these findings and our own can be reconciled with those of in vivo pharmacological experiments (Brand et al., 2002; Pecka et al., 2008), but resolution of this issue remains an exciting avenue for future research.
EXPERIMENTAL PROCEDURES
All procedures were conducted in accordance with The University of Texas at Austin IACUC guidelines. Mongolian gerbils (Meriones unguiculatus) were anesthetized with halothane or isoflurane and brains rapidly removed. Slices were prepared in 32°C ACSF and incubated for 30-60 minutes at 35°C prior to use. ACSF was bubbled with 95% O2/5% CO2 and contained (in mM): 125 NaCl, 25 glucose, 25 NaHCO3, 2.5 KCl, 1.25 NaH2PO4, 1.5 CaCl2, 1.5 MgSO4. Whole cell current clamp recordings were made using Dagan BVC-700A or Molecular Devices MultiClamp 700B amplifiers. Data was filtered at 3-10 kHz, digitized at 50-100 kHz, and acquired using custom algorithms in IgorPro (WaveMetrics). Recording electrodes were pulled to 3-5 MΩ resistances and filled with intracellular solution containing (in mM): 115 K-gluconate, 4.42 KCl, 0.5 EGTA, 10 HEPES, 10 Na2Phosphocreatine, 4 MgATP, 0.3 NaGTP, osmolality adjusted to 300 mmol/kg with sucrose, pH adjusted to 7.30 with KOH. All membrane potentials are corrected for a 10 mV junction potential. Bridge balance was maintained and Rseries monitored in all experiments. Recordings were stopped if Rseries became >25 MΩ.
CN-SO slice
CN-SO slices were prepared by cutting 1000-1500 μm thick coronal brainstem sections which were tilted slightly in the rostral-caudal axis so that the auditory nerves, cochlear nuclei, and superior olivary complexes were contained within one slice. Slices were incubated in a custom interface chamber at 35°C for 30-60 min., then held at room temperature for up to 30 min. before transfer to the recording chamber. Survival of the input circuitry to the MSO was presumably enhanced by the fact that most of the input circuitry is not far from the ventral surface of the slice. We also found that slice health was much better at the age range used (P15-20) than at older ages, presumably due to enhanced ability of younger tissue to withstand hypoxia. Recordings were made at 35°C while slices were perfused with ACSF at 8-10 ml/min. Auditory nerve stumps were stimulated with suction electrodes. MSO neurons were patched under visual control at a depth of ~25 – 200 μm below the slice surface. In cells where nerve stimulation evoked both EPSPs and IPSPs, these events were typically evoked together only over a narrow range of stimulus amplitudes, and the minimal stimulus required for evoking each type of event was similar but not identical. Increases in stimulus current beyond this narrow range caused the EPSP or IPSP to fail, possibly due to depolarization block of individual axons in the auditory nerve stump. Thus, the lowest stimulation current that reliably evoked both EPSPs and IPSPs was used.
Conventional slices
Recordings were made from 200 μm horizontal slices prepared from P21-32 gerbils. Slices were perfused with 37°C ACSF at ~2 ml/min. In experiments involving stimulation of excitatory afferents, ACSF contained 1μM strychnine and 5 μM SR-95531 (gabazine) to block glycine and GABAA receptors. Inhibitory afferents were isolated by ACSF containing 20 μM CNQX and 50 μM D-APV to block AMPA and NMDA receptors. When afferent stimulation was not used, ACSF contained 1 μM strychnine, 20 μM CNQX, and 50 μM D-APV. For dynamic clamp recordings, cells were patched with two somatic electrodes, one to measure Vm and the other to inject current. The dynamic clamp used SM2 software from Cambridge Conductance to control a Toro 8 DSP circuit board operating at 33-50 kHz. EPSGs were simulated with a double exponential waveform (time constants = 0.1 ms rise, 0.18 ms decay), and reversal potential of 0 mV. IPSGs were simulated with a double exponential waveform (time constants = 0.28 ms rise, 1.85 ms decay), and reversal potential of -85 mV (physiological inhibition) or equal to Vrest (~-58 mV, purely shunting inhibition). The peak conductance of IPSGs was adjusted so that an individual event elicited a 3 mV hyperpolarization from Vrest. Inhibitory step conductances used the same reversal potentials as IPSGs. Kv1 conductance was simulated using the Hodgkin-Huxley model developed by Mathews et al. (2010), with the reversal potential set to -103 mV. When simulating Kv1, endogenous channels were blocked by the inclusion of 5 mM 4-AP in the intracellular solution. The amount of Kv1 conductance to simulate was determined by increasing the conductance until the half-widths of dynamic clamp simulated EPSPs were approximately equal to the half-widths measured in control experiments lacking 4-AP (control, 0.58 ± 0.06 ms; 4-AP, 1.56 ± 0.64 ms; 4-AP + GKv1, 0.58 ± 0.01 ms).
Analysis
Data were analyzed using custom algorithms implemented in IgorPro. In coincidence detection experiments, action potentials were detected based on increased amplitudes and afterhyperpolarizations relative to subthreshold events and the presence of an inflection point during depolarization (Figure S1). Cells where action potentials could not be reliably distinguished from subthreshold events were discarded. T-tests and one-way ANOVAs with Tukey’s post hoc test were used where appropriate to determine statistical significance (p<0.05). Errors and error bars report SEM, except where noted. For single cycle coincidence detection experiments, data was acquired in batches of 5 ITD trials per condition, with each trial testing 25 ITD values (± 600 μs in 50 μs steps). After 20 trials were acquired (5 per condition), the protocol was repeated in batches of 5 until 15-60 (mean = 38, n = 8) total ITD trials were conducted per condition. Bootstrap analysis was run by randomly resampling the results from each coincidence detection experiment to generate new data sets containing the same number of trials as in the original data. ITD functions were generated from these resampled data sets, and for each ITD function, the mean and median mass, the maximal spike probability, and the half-width of the function were measured. This resampling procedure was repeated 20,000 times for each cell, and mean properties for each measurement were calculated across trials. Measures were then averaged across all cells in the data set. Significant changes in measurements in the population were determined using a repeated measures ANOVA with a repeated measures Tukey’s post hoc test.
Supplementary Material
Acknowledgments
We are grateful to Jonathan Pillow for suggesting the use of bootstrap analysis. This work was supported by NIH grants DC006788 and DC011403 (N.L.G.).
Footnotes
SUPPLEMENTAL INFORMATION
Supplemental information includes four figures.
Publisher's Disclaimer: This is a PDF file of an unedited manuscript that has been accepted for publication. As a service to our customers we are providing this early version of the manuscript. The manuscript will undergo copyediting, typesetting, and review of the resulting proof before it is published in its final citable form. Please note that during the production process errors may be discovered which could affect the content, and all legal disclaimers that apply to the journal pertain.
References
- Allen PD, Ison JR. Kcna1 gene deletion lowers the behavioral sensitivity of mice to small changes in sound location and increases asynchronous brainstem auditory evoked potentials but does not affect hearing thresholds. J Neurosci. 2012;32:2538–2543. doi: 10.1523/JNEUROSCI.1958-11.2012. [DOI] [PMC free article] [PubMed] [Google Scholar]
- Bal R, Oertel D. Potassium currents in octopus cells of the mammalian cochlear nucleus. J Neurophysiol. 2001;86:2299–2311. doi: 10.1152/jn.2001.86.5.2299. [DOI] [PubMed] [Google Scholar]
- Banke TG, McBain CJ. GABAergic input onto CA3 hippocampal interneurons remains shunting throughout development. J Neurosci. 2006;26:11720–11725. doi: 10.1523/JNEUROSCI.2887-06.2006. [DOI] [PMC free article] [PubMed] [Google Scholar]
- Borst JGG, Soria van Hoeve J. The calyx of held synapse: from model synapse to auditory relay. Annu Rev Physiol. 2012;74:199–224. doi: 10.1146/annurev-physiol-020911-153236. [DOI] [PubMed] [Google Scholar]
- Brand A, Behrend O, Marquardt T, McAlpine D, Grothe B. Precise inhibition is essential for microsecond interaural time difference coding. Nature. 2002;417:543–547. doi: 10.1038/417543a. [DOI] [PubMed] [Google Scholar]
- Brew HM, Hallows JL, Tempel BL. Hyperexcitability and reduced low threshold potassium currents in auditory neurons of mice lacking the channel subunit Kv1.1. J Physiol (Lond) 2003;548:1–20. doi: 10.1113/jphysiol.2002.035568. [DOI] [PMC free article] [PubMed] [Google Scholar]
- Brownell WE. Organization of the cat trapezoid body and the discharge characteristics of its fibers. Brain Res. 1975;94:413–433. doi: 10.1016/0006-8993(75)90226-7. [DOI] [PubMed] [Google Scholar]
- Cant NB, Hyson RL. Projections from the lateral nucleus of the trapezoid body to the medial superior olivary nucleus in the gerbil. Hear Res. 1992;58:26–34. doi: 10.1016/0378-5955(92)90005-8. [DOI] [PubMed] [Google Scholar]
- Chirila FV, Rowland KC, Thompson JM, Spirou GA. Development of gerbil medial superior olive: integration of temporally delayed excitation and inhibition at physiological temperature. J Physiol (Lond) 2007;584:167–190. doi: 10.1113/jphysiol.2007.137976. [DOI] [PMC free article] [PubMed] [Google Scholar]
- Choquet D, Korn H. Mechanism of 4-aminopyridine action on voltage-gated potassium channels in lymphocytes. J Gen Physiol. 1992;99:217–240. doi: 10.1085/jgp.99.2.217. [DOI] [PMC free article] [PubMed] [Google Scholar]
- Clark GM. The ultrastructure of nerve endings in the medial superior olive of the cat. Brain Res. 1969;14:293–305. doi: 10.1016/0006-8993(69)90111-5. [DOI] [PubMed] [Google Scholar]
- Cobb SR, Buhl EH, Halasy K, Paulsen O, Somogyi P. Synchronization of neuronal activity in hippocampus by individual GABAergic interneurons. Nature. 1995;378:75–78. doi: 10.1038/378075a0. [DOI] [PubMed] [Google Scholar]
- Couchman K, Grothe B, Felmy F. Medial superior olivary neurons receive surprisingly few excitatory and inhibitory inputs with balanced strength and short-term dynamics. J Neurosci. 2010;30:17111–17121. doi: 10.1523/JNEUROSCI.1760-10.2010. [DOI] [PMC free article] [PubMed] [Google Scholar]
- Day ML, Semple MN. Frequency-dependent interaural delays in the medial superior olive: implications for interaural cochlear delays. J Neurophysiol. 2011;106:1985–1999. doi: 10.1152/jn.00131.2011. [DOI] [PubMed] [Google Scholar]
- Dodson PD, Barker MC, Forsythe ID. Two heteromeric Kv1 potassium channels differentially regulate action potential firing. J Neurosci. 2002;22:6953–6961. doi: 10.1523/JNEUROSCI.22-16-06953.2002. [DOI] [PMC free article] [PubMed] [Google Scholar]
- Economo MN, Fernandez FR, White JA. Dynamic clamp: alteration of response properties and creation of virtual realities in neurophysiology. J Neurosci. 2010;30:2407–2413. doi: 10.1523/JNEUROSCI.5954-09.2010. [DOI] [PMC free article] [PubMed] [Google Scholar]
- Fischl MJ, Combs TD, Klug A, Grothe B, Burger RM. Modulation of synaptic input by GABAB receptors improves coincidence detection for computation of sound location. The Journal of Physiology. 2012 doi: 10.1113/jphysiol.2011.226233. [DOI] [PMC free article] [PubMed] [Google Scholar]
- Funabiki K, Koyano K, Ohmori H. The role of GABAergic inputs for coincidence detection in the neurones of nucleus laminaris of the chick. J Physiol (Lond) 1998;508(Pt 3):851–869. doi: 10.1111/j.1469-7793.1998.851bp.x. [DOI] [PMC free article] [PubMed] [Google Scholar]
- Gabernet L, Jadhav SP, Feldman DE, Carandini M, Scanziani M. Somatosensory integration controlled by dynamic thalamocortical feed-forward inhibition. Neuron. 2005;48:315–327. doi: 10.1016/j.neuron.2005.09.022. [DOI] [PubMed] [Google Scholar]
- Gittelman JX, Tempel BL. Kv1.1-containing channels are critical for temporal precision during spike initiation. J Neurophysiol. 2006;96:1203–1214. doi: 10.1152/jn.00092.2005. [DOI] [PubMed] [Google Scholar]
- Grothe B. Interaction of excitation and inhibition in processing of pure tone and amplitude-modulated stimuli in the medial superior olive of the mustached bat. J Neurophysiol. 1994;71:706–721. doi: 10.1152/jn.1994.71.2.706. [DOI] [PubMed] [Google Scholar]
- Grothe B. New roles for synaptic inhibition in sound localization. Nat Rev Neurosci. 2003;4:540–550. doi: 10.1038/nrn1136. [DOI] [PubMed] [Google Scholar]
- Grothe B, Park TJ. Sensitivity to interaural time differences in the medial superior olive of a small mammal, the Mexican free-tailed bat. J Neurosci. 1998;18:6608–6622. doi: 10.1523/JNEUROSCI.18-16-06608.1998. [DOI] [PMC free article] [PubMed] [Google Scholar]
- Grothe B, Sanes DH. Bilateral inhibition by glycinergic afferents in the medial superior olive. J Neurophysiol. 1993;69:1192–1196. doi: 10.1152/jn.1993.69.4.1192. [DOI] [PubMed] [Google Scholar]
- Grothe B, Sanes DH. Synaptic inhibition influences the temporal coding properties of medial superior olivary neurons: an in vitro study. J Neurosci. 1994;14:1701–1709. doi: 10.1523/JNEUROSCI.14-03-01701.1994. [DOI] [PMC free article] [PubMed] [Google Scholar]
- Hille B. Ion channels of excitable membranes. Sunderland, Mass: Sinauer; 2001. [Google Scholar]
- Howard MA, Burger RM, Rubel EW. A developmental switch to GABAergic inhibition dependent on increases in Kv1-type K+ currents. J Neurosci. 2007;27:2112–2123. doi: 10.1523/JNEUROSCI.5266-06.2007. [DOI] [PMC free article] [PubMed] [Google Scholar]
- Howard MA, Rubel EW. Dynamic spike thresholds during synaptic integration preserve and enhance temporal response properties in the avian cochlear nucleus. J Neurosci. 2010;30:12063–12074. doi: 10.1523/JNEUROSCI.1840-10.2010. [DOI] [PMC free article] [PubMed] [Google Scholar]
- Hyson RL, Reyes AD, Rubel EW. A depolarizing inhibitory response to GABA in brainstem auditory neurons of the chick. Brain Res. 1995;677:117–126. doi: 10.1016/0006-8993(95)00130-i. [DOI] [PubMed] [Google Scholar]
- Ingham NJ, McAlpine D. GABAergic inhibition controls neural gain in inferior colliculus neurons sensitive to interaural time differences. J Neurosci. 2005;25:6187–6198. doi: 10.1523/JNEUROSCI.0146-05.2005. [DOI] [PMC free article] [PubMed] [Google Scholar]
- Jercog PE, Svirskis G, Kotak VC, Sanes DH, Rinzel J. Asymmetric excitatory synaptic dynamics underlie interaural time difference processing in the auditory system. PLoS Biol. 2010;8:e1000406. doi: 10.1371/journal.pbio.1000406. [DOI] [PMC free article] [PubMed] [Google Scholar]
- Johnson DH. The relationship between spike rate and synchrony in responses of auditory-nerve fibers to single tones. J Acoust Soc Am. 1980;68:1115–1122. doi: 10.1121/1.384982. [DOI] [PubMed] [Google Scholar]
- Johnston J, Forsythe ID, Kopp-Scheinpflug C. Going native: voltage-gated potassium channels controlling neuronal excitability. J Physiol. 2010 doi: 10.1113/jphysiol.2010.191973. [DOI] [PMC free article] [PubMed] [Google Scholar]
- Joris P, Yin TCT. A matter of time: internal delays in binaural processing. Trends Neurosci. 2007;30:70–78. doi: 10.1016/j.tins.2006.12.004. [DOI] [PubMed] [Google Scholar]
- Joris PX, Carney LH, Smith PH, Yin TC. Enhancement of neural synchronization in the anteroventral cochlear nucleus. I. Responses to tones at the characteristic frequency. J Neurophysiol. 1994;71:1022–1036. doi: 10.1152/jn.1994.71.3.1022. [DOI] [PubMed] [Google Scholar]
- Joris PX, Van de Sande B, Louage DH, Van der Heijden M. Binaural and cochlear disparities. Proc Natl Acad Sci U S A. 2006;103:12917–12922. doi: 10.1073/pnas.0601396103. [DOI] [PMC free article] [PubMed] [Google Scholar]
- Kapfer C, Seidl AH, Schweizer H, Grothe B. Experience-dependent refinement of inhibitory inputs to auditory coincidence-detector neurons. Nat Neurosci. 2002;5:247–253. doi: 10.1038/nn810. [DOI] [PubMed] [Google Scholar]
- Khurana S, Remme MWH, Rinzel J, Golding NL. Dynamic interaction of Ih and IK-LVA during trains of synaptic potentials in principal neurons of the medial superior olive. J Neurosci. 2011;31:8936–8947. doi: 10.1523/JNEUROSCI.1079-11.2011. [DOI] [PMC free article] [PubMed] [Google Scholar]
- Kopp-Scheinpflug C, Fuchs K, Lippe WR, Tempel BL, Rübsamen R. Decreased temporal precision of auditory signaling in Kcna1-null mice: an electrophysiological study in vivo. J Neurosci. 2003;23:9199–9207. doi: 10.1523/JNEUROSCI.23-27-09199.2003. [DOI] [PMC free article] [PubMed] [Google Scholar]
- Kopp-Scheinpflug C, Steinert JR, Forsythe ID. Modulation and control of synaptic transmission across the MNTB. Hear Res. 2011;279:22–31. doi: 10.1016/j.heares.2011.02.007. [DOI] [PubMed] [Google Scholar]
- Kuenzel T, Borst JGG, van der Heijden M. Factors controlling the input-output relationship of spherical bushy cells in the gerbil cochlear nucleus. J Neurosci. 2011;31:4260–4273. doi: 10.1523/JNEUROSCI.5433-10.2011. [DOI] [PMC free article] [PubMed] [Google Scholar]
- Kuo SP, Bradley LA, Trussell LO. Heterogeneous kinetics and pharmacology of synaptic inhibition in the chick auditory brainstem. J Neurosci. 2009;29:9625–9634. doi: 10.1523/JNEUROSCI.0103-09.2009. [DOI] [PMC free article] [PubMed] [Google Scholar]
- Kuwabara N, Zook JM. Projections to the medial superior olive from the medial and lateral nuclei of the trapezoid body in rodents and bats. J Comp Neurol. 1992;324:522–538. doi: 10.1002/cne.903240406. [DOI] [PubMed] [Google Scholar]
- Leão RM, Kushmerick C, Pinaud R, Renden R, Li G-L, Taschenberger H, Spirou G, Levinson SR, Von Gersdorff H. Presynaptic Na+ channels: locus, development, and recovery from inactivation at a high-fidelity synapse. J Neurosci. 2005;25:3724–3738. doi: 10.1523/JNEUROSCI.3983-04.2005. [DOI] [PMC free article] [PubMed] [Google Scholar]
- Leibold C. Influence of inhibitory synaptic kinetics on the interaural time difference sensitivity in a linear model of binaural coincidence detection. J Acoust Soc Am. 2010;127:931–942. doi: 10.1121/1.3282997. [DOI] [PubMed] [Google Scholar]
- Lorteije JAM, Rusu SI, Kushmerick C, Borst JGG. Reliability and precision of the mouse calyx of Held synapse. J Neurosci. 2009;29:13770–13784. doi: 10.1523/JNEUROSCI.3285-09.2009. [DOI] [PMC free article] [PubMed] [Google Scholar]
- Lu T, Trussell LO. Inhibitory transmission mediated by asynchronous transmitter release. Neuron. 2000;26:683–694. doi: 10.1016/s0896-6273(00)81204-0. [DOI] [PubMed] [Google Scholar]
- Magnusson AK, Kapfer C, Grothe B, Koch U. Maturation of glycinergic inhibition in the gerbil medial superior olive after hearing onset. J Physiol (Lond) 2005;568:497–512. doi: 10.1113/jphysiol.2005.094763. [DOI] [PMC free article] [PubMed] [Google Scholar]
- Maki K, Furukawa S. Acoustical cues for sound localization by the Mongolian gerbil, Meriones unguiculatus. J Acoust Soc Am. 2005;118:872–886. doi: 10.1121/1.1944647. [DOI] [PubMed] [Google Scholar]
- Mathews PJ, Jercog PE, Rinzel J, Scott LL, Golding NL. Control of submillisecond synaptic timing in binaural coincidence detectors by K(v)1 channels. Nat Neurosci. 2010;13:601–609. doi: 10.1038/nn.2530. [DOI] [PMC free article] [PubMed] [Google Scholar]
- Mc Laughlin M, van der Heijden M, Joris PX. How secure is in vivo synaptic transmission at the calyx of Held? J Neurosci. 2008;28:10206–10219. doi: 10.1523/JNEUROSCI.2735-08.2008. [DOI] [PMC free article] [PubMed] [Google Scholar]
- Oertel D, Shatadal S, Cao X-J. In the ventral cochlear nucleus Kv1.1 and subunits of HCN1 are colocalized at surfaces of neurons that have low-voltage-activated and hyperpolarization-activated conductances. Neuroscience. 2008;154:77–86. doi: 10.1016/j.neuroscience.2008.01.085. [DOI] [PMC free article] [PubMed] [Google Scholar]
- Pecka M, Brand A, Behrend O, Grothe B. Interaural time difference processing in the mammalian medial superior olive: the role of glycinergic inhibition. J Neurosci. 2008;28:6914–6925. doi: 10.1523/JNEUROSCI.1660-08.2008. [DOI] [PMC free article] [PubMed] [Google Scholar]
- Pouille F, Scanziani M. Enforcement of temporal fidelity in pyramidal cells by somatic feed-forward inhibition. Science. 2001;293:1159–1163. doi: 10.1126/science.1060342. [DOI] [PubMed] [Google Scholar]
- Prinz AA, Abbott LF, Marder E. The dynamic clamp comes of age. Trends Neurosci. 2004;27:218–224. doi: 10.1016/j.tins.2004.02.004. [DOI] [PubMed] [Google Scholar]
- Rothman JS, Manis PB. Kinetic analyses of three distinct potassium conductances in ventral cochlear nucleus neurons. J Neurophysiol. 2003;89:3083–3096. doi: 10.1152/jn.00126.2002. [DOI] [PubMed] [Google Scholar]
- Scott LL, Mathews PJ, Golding NL. Posthearing developmental refinement of temporal processing in principal neurons of the medial superior olive. J Neurosci. 2005;25:7887–7895. doi: 10.1523/JNEUROSCI.1016-05.2005. [DOI] [PMC free article] [PubMed] [Google Scholar]
- Scott LL, Mathews PJ, Golding NL. Perisomatic voltage-gated sodium channels actively maintain linear synaptic integration in principal neurons of the medial superior olive. J Neurosci. 2010;30:2039–2050. doi: 10.1523/JNEUROSCI.2385-09.2010. [DOI] [PMC free article] [PubMed] [Google Scholar]
- Seidl AH, Rubel EW, Harris DM. Mechanisms for adjusting interaural time differences to achieve binaural coincidence detection. J Neurosci. 2010;30:70–80. doi: 10.1523/JNEUROSCI.3464-09.2010. [DOI] [PMC free article] [PubMed] [Google Scholar]
- Shamma SA, Shen NM, Gopalaswamy P. Stereausis: binaural processing without neural delays. J Acoust Soc Am. 1989;86:989–1006. doi: 10.1121/1.398734. [DOI] [PubMed] [Google Scholar]
- Sheng M, Tsaur ML, Jan YN, Jan LY. Contrasting subcellular localization of the Kv1.2 K+ channel subunit in different neurons of rat brain. J Neurosci. 1994;14:2408–2417. doi: 10.1523/JNEUROSCI.14-04-02408.1994. [DOI] [PMC free article] [PubMed] [Google Scholar]
- Spirou GA, Rowland KC, Berrebi AS. Ultrastructure of neurons and large synaptic terminals in the lateral nucleus of the trapezoid body of the cat. J Comp Neurol. 1998;398:257–272. doi: 10.1002/(sici)1096-9861(19980824)398:2<257::aid-cne7>3.0.co;2-#. [DOI] [PubMed] [Google Scholar]
- Stephens GJ, Garratt JC, Robertson B, Owen DG. On the mechanism of 4-aminopyridine action on the cloned mouse brain potassium channel mKv1.1. J Physiol (Lond) 1994;477(Pt 2):187–196. doi: 10.1113/jphysiol.1994.sp020183. [DOI] [PMC free article] [PubMed] [Google Scholar]
- Stokes CCA, Isaacson JS. From dendrite to soma: dynamic routing of inhibition by complementary interneuron microcircuits in olfactory cortex. Neuron. 2010;67:452–465. doi: 10.1016/j.neuron.2010.06.029. [DOI] [PMC free article] [PubMed] [Google Scholar]
- Svirskis G, Kotak V, Sanes DH, Rinzel J. Enhancement of signal-to-noise ratio and phase locking for small inputs by a low-threshold outward current in auditory neurons. J Neurosci. 2002;22:11019–11025. doi: 10.1523/JNEUROSCI.22-24-11019.2002. [DOI] [PMC free article] [PubMed] [Google Scholar]
- Svirskis G, Kotak V, Sanes DH, Rinzel J. Sodium along with low-threshold potassium currents enhance coincidence detection of subthreshold noisy signals in MSO neurons. J Neurophysiol. 2004;91:2465–2473. doi: 10.1152/jn.00717.2003. [DOI] [PMC free article] [PubMed] [Google Scholar]
- Tang Z-Q, Dinh EH, Shi W, Lu Y. Ambient GABA-activated tonic inhibition sharpens auditory coincidence detection via a depolarizing shunting mechanism. J Neurosci. 2011;31:6121–6131. doi: 10.1523/JNEUROSCI.4733-10.2011. [DOI] [PMC free article] [PubMed] [Google Scholar]
- Trimmer JS, Rhodes KJ. Localization of voltage-gated ion channels in mammalian brain. Annu Rev Physiol. 2004;66:477–519. doi: 10.1146/annurev.physiol.66.032102.113328. [DOI] [PubMed] [Google Scholar]
- van der Heijden M, Lorteije JAM, Plauška A, Roberts MT, Golding NL, J, Borst GG. Directional hearing by linear summation of binaural inputs at the medial superior olive. 2013 doi: 10.1016/j.neuron.2013.04.028. *********linked paper! please add information and verify AU and title, thanks (AG)*** [DOI] [PMC free article] [PubMed] [Google Scholar]
- Vida I, Bartos M, Jonas P. Shunting inhibition improves robustness of gamma oscillations in hippocampal interneuron networks by homogenizing firing rates. Neuron. 2006;49:107–117. doi: 10.1016/j.neuron.2005.11.036. [DOI] [PubMed] [Google Scholar]
- Wang H, Kunkel DD, Schwartzkroin PA, Tempel BL. Localization of Kv1.1 and Kv1.2, two K channel proteins, to synaptic terminals, somata, and dendrites in the mouse brain. J Neurosci. 1994;14:4588–4599. doi: 10.1523/JNEUROSCI.14-08-04588.1994. [DOI] [PMC free article] [PubMed] [Google Scholar]
- Yang L, Monsivais P, Rubel EW. The superior olivary nucleus and its influence on nucleus laminaris: a source of inhibitory feedback for coincidence detection in the avian auditory brainstem. J Neurosci. 1999;19:2313–2325. doi: 10.1523/JNEUROSCI.19-06-02313.1999. [DOI] [PMC free article] [PubMed] [Google Scholar]
- Yin TC, Chan JC. Interaural time sensitivity in medial superior olive of cat. J Neurophysiol. 1990;64:465–488. doi: 10.1152/jn.1990.64.2.465. [DOI] [PubMed] [Google Scholar]
- Zhou Y, Carney LH, Colburn HS. A model for interaural time difference sensitivity in the medial superior olive: interaction of excitatory and inhibitory synaptic inputs, channel dynamics, and cellular morphology. J Neurosci. 2005;25:3046–3058. doi: 10.1523/JNEUROSCI.3064-04.2005. [DOI] [PMC free article] [PubMed] [Google Scholar]
Associated Data
This section collects any data citations, data availability statements, or supplementary materials included in this article.