
Figure 4. IPSP kinetics have little effect on EPSP shape.
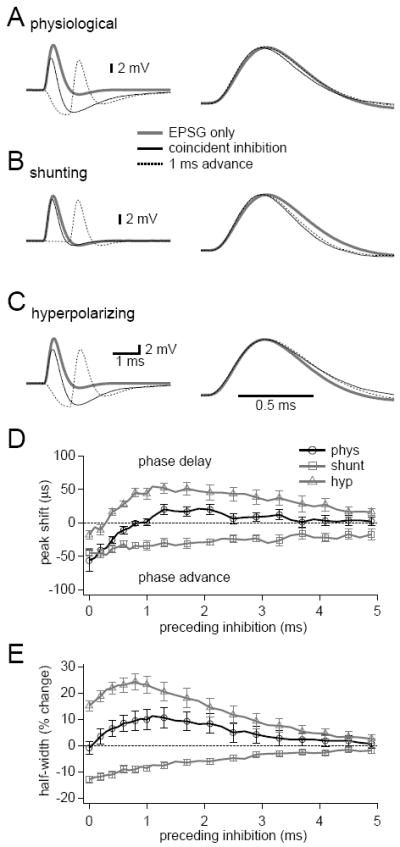
(A-C) Inhibitory conductances were simulated with dual exponential waveforms (time constants = 0.28 ms rise, 1.85 ms decay). EPSGs were simulated at 0-5 ms after the onset of inhibition. Normalized traces are shown to the right. EPSP shape remained consistent in the presence of physiological inhibition (A), peaked earlier and narrowed in the presence of purely shunting inhibition (B), and peaked later and widened in the presence of hyperpolarizing DC currents (C). (D, E) Summaries of effects of inhibition on EPSP peak times (D) and half-widths (E). Note that physiological inhibition slightly advanced the peak times of EPSGs evoked during the first 1 ms of an IPSG. For clarity, lines follow every data point, but markers and error bars are shown for every other data point. Error bars show SEM, n =8.