
Figure 8. Kv1 channel deactivation partially compensates for the additional conductance contributed by physiological inhibition.
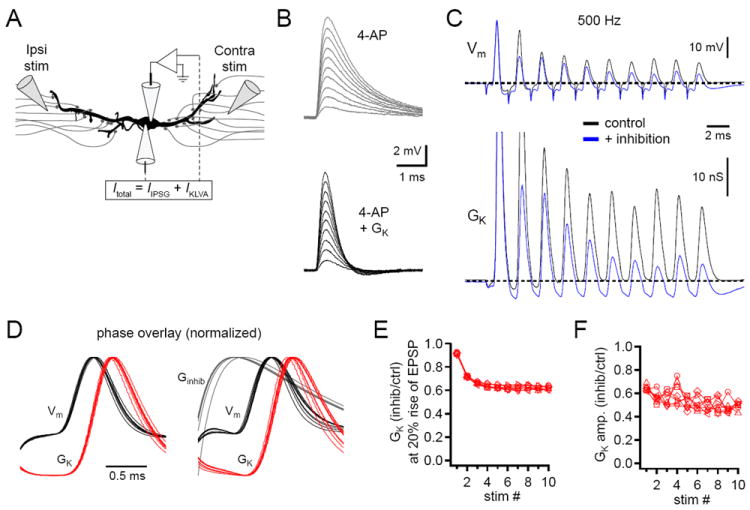
(A) Two electrode dynamic clamp configuration used for ITD train experiments. Endogenous K+ channels were blocked with 5 mM intracellular 4-AP. Kv1 and inhibitory conductances were simulated by dynamic clamp. (B) The amount of Kv1 conductance required to replace the blocked endogenous conductance was determined by measuring the half-widths of simulated EPSPs evoked by 5-50 nS EPSGs. Sample traces show EPSPs before (top, mean half-width = 1.20 ms) and after (bottom, mean half-width = 0.59 ms) Kv1 conductance was introduced by the dynamic clamp. (C) Sample traces showing voltage (top) and Kv1 conductance changes (bottom) in response to 500 Hz trains with ITD values = 0 ms in the absence (black) and presence (blue) of inhibition. Dashed lines indicate Vrest of -60 mV (top) and resting Kv1 conductance of 11 nS (bottom). (D) Averaged and normalized subthreshold responses from ten 500 Hz trains at 0 ITD from the cell shown in C. Cycles of the train are overlaid according to phase. Data on the left are from the control condition, on the right were in the presence of physiological inhibition. (E) Summary plot of average inhibition-induced decrease in Kv1 conductance at the 20% rise times of EPSPs during 500 Hz trains (n = 5). (F) Summary plot of the change in Kv1 conductance elicited by EPSPs in the presence versus the absence of inhibition (n = 5). ITD values covering ±150 μs are shown in (E, F). Data from P21-23 gerbils. See also Figure S4.