

Abstract
Marital discord is costly to children, families, and communities. The advent of the Internet, social networking, and on-line dating has affected how people meet future spouses, but little is known about the prevalence or outcomes of these marriages or the demographics of those involved. We addressed these questions in a nationally representative sample of 19,131 respondents who married between 2005 and 2012. Results indicate that more than one-third of marriages in America now begin on-line. In addition, marriages that began on-line, when compared with those that began through traditional off-line venues, were slightly less likely to result in a marital break-up (separation or divorce) and were associated with slightly higher marital satisfaction among those respondents who remained married. Demographic differences were identified between respondents who met their spouse through on-line vs. traditional off-line venues, but the findings for marital break-up and marital satisfaction remained significant after statistically controlling for these differences. These data suggest that the Internet may be altering the dynamics and outcomes of marriage itself.
Keywords: marital outcomes, social relationships, dyads
The rise in the Internet has transformed how Americans work, play, search, shop, study, and communicate. Facebook has grown from its inception in 2004 to over a billion users, and Twitter has grown from its start in 2006 to more than 500 million users. The 2011 American Time Use Survey indicates that, on average, men now spend 9.65% and women spend 6.81% of their leisure time on-line (1). The Internet has also changed how Americans meet their spouse. Meeting a marital partner in traditional off-line venues has declined over the past several decades but meeting on-line has grown dramatically (2), with on-line dating now a billion-dollar industry (3).
Experiments in which strangers are randomly assigned to interact using computer-mediated communications versus face-to-face communications show that the more anonymous on-line meetings produce greater self-disclosure and liking as long as the interaction is not under strong time constraints (3–6). Consistent with these experimental studies, research of on-line users suggests that authentic on-line self-disclosures are associated with more enduring face-to-face friendships (5).
Rosenfeld and Thomas (2) provide some evidence that relationship quality for partners who meet on-line may be higher and the 1-y break-up rate slightly lower than for partners who meet off-line. Solid empirical evidence on the marital outcomes associated with meeting on-line vs. off-line is absent, however (3). Here we report the results of a nationally representative survey of 19,131 respondents who married between 2005 and 2012 (Methods) to determine: (i) the percent of contemporary marriages in America that began through an on-line meeting; (ii) differences in the demographic characteristics of those who met their spouse on-line vs. off-line; (iii) the likelihood that a marital relationship that began on-line vs. off-line ended in a marital break-up (i.e., divorce or separation); (iv) the mean marital satisfaction of currently married respondents who met their spouse on-line vs. off-line; and (v) the extent to which the specific on-line venue, or the specific off-line venue, in which couples met is associated with marital satisfaction and marital break-ups. The latter analysis is important because on-line venues have tended to be treated as a homogenous terrain (2) despite on-line venues having grown in number, variety, and complexity.
Results
The demographic characteristics of the respondents who married between 2005 and 2012 as well as US Census data for married individuals indicated that the weighted sample of 19,131 respondents was generally representative (Table S1). For each marriage, participants were asked the month and year of the marriage and, if the most recent marriage ended in divorce, the month and year of the divorce. As summarized in Fig. 1A, 92.01% of the sample reported being currently married, 4.94% reported being divorced, 2.50% reported being separated from their spouse, and 0.55% reported being widowed (7). As in prior research (2), marital break-ups were defined as separated or divorced and constituted 7.44% of the sample.
Fig. 1.
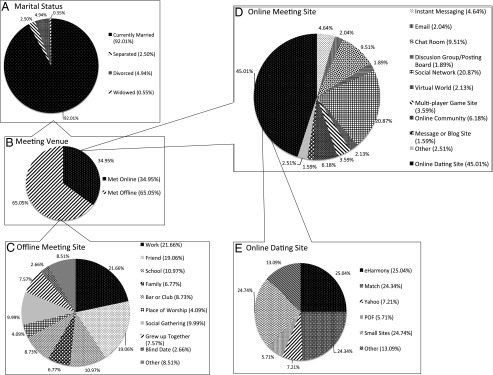
(A) Marital status among the 19,131 (unweighted) respondents. (B) Meeting venue. (C) Offline meeting site. 21.66% of the respondents who met their spouse offline met through work, 19.06% through friends, 10.97% at school, 6.77% through family, 8.73% at a bar/club, 4.09% at a place of worship, 9.99% at a social gathering, 7.57% grew up together, 2.66% met on a blind date, and 8.51% met through “other” venues. (D) Online meeting site. Of the respondents who met their spouse online, 4.64% met through instant messaging, 2.04% through e-mail, 9.51% in a chat room, 1.89% through a discussion group/posting board, 20.87% through social network, 2.13% in a virtual world, 3.59% on a multiplayer game site, 6.18% in an online community, 1.59% on a message/blog site, 45.01% through an online dating site, and 2.51% met through “other” online venues. (E) Online dating site. Of the 45.01% who met through an online dating site, 25.04% met on eHarmony, 24.34% on Match, 7.21% on Yahoo, 5.71% on Plenty of Fish (POF), 24.74% were spread in smaller numbers (<100) across the remaining 14 dating sites specified in the survey (labeled hereafter as “small”), and 13.09% met on a dating site they specified as “other.”
We found evidence for a dramatic shift since the advent of the Internet in how people are meeting their spouse (3, 8). Analyses of the weighted demographic data indicated that more than one-third of those married between 2005 and 2012 met on-line (Fig. 1B). We next investigated the characteristics of respondents who met their spouse on-line vs. off-line. Briefly, males, 30–49 y olds, Hispanics, individuals from higher socioeconomic status brackets, and working respondents more often reported meeting their spouse on-line than off-line (Table 1).
Table 1.
Weighted sample demographics for those who reported meeting on-line and off-line and significance tests for differences between the groups
| Demographic | Weighted means |
||
| On-line | Off-line | Significance test | |
| n | 6,654 | 12,384 | |
| Percent female | 44.72 | 56.98 | χ2(1) = 127.48* |
| Age (y) | |||
| Mean | 37.99 (0.22) | 37.74 (0.16) | F(1, 17,985) = 0.41 |
| 18–29 | 21.43% | 26.40% | χ2(4) = 42.94* |
| 30–39 | 40.92% | 36.74% | |
| 40–49 | 22.57% | 19.19% | |
| 50–64 | 12.02% | 14.09% | |
| 65+ | 3.05% | 3.57% | |
| Ethnicity | |||
| White/Caucasian | 64.01% | 69.89% | χ2(4) = 176.12* |
| Black/African American | 6.45% | 9.70% | |
| Hispanic | 24.54% | 14.92% | |
| Asian or Pacific Islander | 2.79% | 2.75% | |
| Other | 1.28% | 1.45% | |
| Income | |||
| Less than $15,000 | 2.39% | 4.37% | χ2(6) = 324.14* |
| $15,000 to $24,999 | 4.08% | 7.57% | |
| $25,000 to $34,999 | 6.01% | 8.88% | |
| $35,000 to $49,999 | 9.67% | 13.44% | |
| $50,000 to $74,999 | 18.41% | 20.36% | |
| $75,000 to $99,999 | 16.29% | 14.05% | |
| $100,000 or more | 40.50% | 26.14% | |
| Education | |||
| High school or less | 18.24% | 26.57% | χ2(3) = 80.71* |
| Associates or job training | 17.79% | 17.43% | |
| College | 49.26% | 43.90% | |
| Graduate school | 14.70% | 12.11% | |
| Religious affiliation | |||
| Catholic | 23.49% | 23.60% | χ2(6) = 64.81* |
| Christian/Protestant | 40.02% | 37.31% | |
| Jewish | 4.42% | 2.00% | |
| Mormon | 2.13% | 2.06% | |
| Spiritual, but unaffiliated | 13.47% | 15.58% | |
| Athiest/No Religion | 8.60% | 10.50% | |
| Other religion | 7.86% | 8.95% | |
| Employment Status | |||
| Used full or part time | 82.84% | 70.85% | χ2(1) = 178.97* |
| Retired | 6.13% | 6.84% | χ2(1) = 1.31 |
| Student | 8.21% | 8.70% | χ2(1) = 0.75 |
| Stay at home parent | 18.50% | 26.64% | χ2(1) = 86.42* |
Because of the number of unpredicted comparisons, we set significance at *P < 0.005. The χ2 tests were done using a Rao-Scott Correction to account for weighting the sample. Small percentages of participants did not report ethnicity (1.2%) or Income (4.3%) so column totals do not add to 100%. Because individuals could select multiple employment categories, χ2 tests were done for each employment status individually.
We next performed analyses of the demographic characteristics of respondents as a function of: (i) on-line meeting venues, (ii) on-line dating-sites, and (iii) off-line meeting venues. Analyses indicated that there are significant differences in the characteristics of individuals as a function of the specific venue in which they met their spouse across on-line venues, on-line dating sites, and off-line venues (Tables S2–S4). For example, respondents who met their spouse through e-mail were older than would be expected based on the age of all respondents who met their spouse on-line, whereas the respondents who met their spouse through social networks and virtual worlds were younger. These results raise questions about treating on-line venues (or even on-line dating sites) as a homogeneous lot and also underscore the potential for selection bias and the importance of addressing it.
We next focused on respondents whose marriages had ended in separation or divorce (i.e., marital break-ups) by the time of the survey. We performed a χ2 test to investigate the extent to which the percentage of marriages ending in separation or divorce differed for individuals who met their spouse on-line vs. off-line. The percentage of marital break-ups was lower for respondents who met their spouse on-line (5.96%) than off-line [7.67%; χ2(1) = 9.95, P < 0.002]. Importantly, after controlling for year of marriage, to account for different follow-up times across respondents, and for sex, age, educational background, ethnicity, household income, religious affiliation, and employment status as covariates, this difference was attenuated but remained significant [χ2(1) = 3.87, P < 0.05]. For marital break-ups, there was a significant interaction between meeting on-line vs. off-line and (i) year of marriage (P = 0.015), (ii) sex (P = 0.001), and (iii) ethnicity (P = 0.002). Those who were married relatively recently, males, and respondents of Hispanic and Asian/Pacific Islander ethnicity exhibited larger protective effects for meeting on-line (Appendix S2).
The differences in percentage of marital break-ups across on-line venues approached statistical significance [χ2(10) = 16.71, P = 0.08; Table S5], but differences across off-line venues were not statistically significant [χ2(9) = 10.17, P = 0.34], and neither test was significant after controlling for covariates [χ2(10) = 14.41, P = 0.17, and χ2(9) = 7.66, P = 0.56, respectively]. Analyses of on-line dating sites revealed that the various sites were only marginally significant over the period of study [χ2(5) = 10.92, P = 0.053] and were not significantly different after controlling for covariates [χ2(5) = 7.99, P = 0.16].
For respondents categorized as currently married at the time of the survey, we examined marital satisfaction. Analyses indicated that currently married respondents who met their spouse on-line reported higher marital satisfaction (M = 5.64, SE = 0.02, n = 5,349) than currently married respondents who met their spouse off-line [M = 5.48, SE = 0.01, n = 12,253; mean difference = 0.18, F(1, 17,601) = 46.67, P < 0.001]. The result remained statistically significant after controlling statistically for year of marriage, sex, age, educational background, household income, ethnicity, religious affiliation, and employment status [mean difference = 0.16; F(1, 16,622) = 43.39, P < 0.001]. For marital satisfaction, there was a significant interaction between meeting on-line vs. off-line and the following: year of marriage (P < 0.0001), religion (P = 0.001), and employment (P = 0.008). Those who were married relatively recently, who were unemployed or in “other” employments, and who identified their religion as Catholic, Spiritual but unaffiliated, or Atheist exhibited larger effects for meeting on-line (Appendix S2).
Fig. 1C summarizes the percentage of respondents who met their spouse through various off-line venues. Analyses indicated that the off-line venues in which respondents met their spouse also were associated with different levels of marital satisfaction [F(9, 12,252) = 5.65, P < 0.001], and these differences remained significant when adjusting for year of marriage, sex, age, educational background, household income, ethnicity, religious affiliation, and employment status as covariates [F(9, 11,466) =3.87, P < 0.001]. Those currently married who grew up together or who met their spouse through school, place of worship, or social gathering expressed the highest levels of marital satisfaction, whereas those who met their spouse through work, family, bar or club, blind date, or other expressed the lowest levels of marital satisfaction (Table 2).
Table 2.
Mean differences in marital satisfaction across different meeting venues
| Source | Weighted n | Unadjusted mean marital satisfaction scores | Coefficients from regression with covariates (SE) |
| On-line sources | |||
| Instant messaging | 279 | 5.66a | −0.04 (0.08) |
| 133 | 5.67ab | −0.02 (0.12) | |
| Chat room | 596 | 5.42bde | −0.25 (0.08) |
| Discussion group | 113 | 5.57ade | −0.12 (0.13) |
| Social network | 1,301 | 5.72a | 0.02 (0.05) |
| Virtual world | 125 | 5.65ab | −0.03 (0.11) |
| Multiplayer game | 222 | 5.72a | 0.05 (0.09) |
| On-line community | 393 | 5.29e | −0.37 (0.08) |
| Message on blog | 102 | 5.59ab | −0.07 (0.13) |
| Other (on-line) | 158 | 5.55d | 0.12 (0.12) |
| On-line dating | 2,782 | 5.69a | — |
| On-line dating sites | |||
| eHarmony | 714 | 5.86a | 0.34 (0.09) |
| Match | 663 | 5.70c | 0.15 (0.09) |
| Yahoo | 201 | 5.29d | −0.23 (0.15) |
| Plenty of Fish | 151 | 5.65abc | 0.07 (0.14) |
| Small sites | 691 | 5.71abc | 0.17 (0.11) |
| Other (on-line dating) | 361 | 5.52bd | — |
| Off-line sources | |||
| Work | 2,474 | 5.38de | −0.04 (0.06) |
| Friends | 2,135 | 5.47bc | 0.03 (0.06) |
| School | 1,277 | 5.59a | 0.12 (0.07) |
| Family | 769 | 5.43bcd | 0.01 (0.08) |
| Bar/club | 988 | 5.39cd | −0.03 (0.07) |
| Place of worship | 466 | 5.58ab | 0.10 (0.08) |
| Social gathering | 1,133 | 5.56ab | 0.12 (0.07) |
| Grew up together | 873 | 5.67a | 0.21 (0.07) |
| Blind date | 299 | 5.31ce | −0.15 (0.12) |
| Other (off-line) | 944 | 5.42cd | — |
Weighted cell size is listed in the second columns. Post hoc analyses are expressed in superscripts in the third column and were done using least-significant differences tests. Means under “On-line sources,” “On-line dating sources,” or “Off-line sources” that do not share a superscript differ at P < 0.05. The sample sizes differ across various pairwise comparisons, and the effect size required for statistical significance differs accordingly. In some cases, a given mean difference in a pairwise comparison based on a relatively large sample size (e.g., eHarmony vs. Match) reaches statistical significance even though a nominally larger mean difference in a pairwise comparison involving fewer observations (e.g., eHarmony vs. Plenty of Fish) does not reach statistical significance. The final column is regression coefficient effect estimates adjusting for year of marriage, sex, age, ethnicity, income, education, religion, and employment. Survey weights can bias estimates of SDs, so we report SEs in accordance with standard statistical practice for survey weighted data.
Fig. 1D summarizes the percentage of respondents who met their spouse through specific on-line venues. Among respondents who remained married at the time of the survey, marital satisfaction was observed to vary across the on-line venues in which they met their spouse [F(10, 5,348) = 4.03, P < 0.001]. As above, we repeated the analysis using year of marriage, sex, age, educational background, household income, ethnicity, religious affiliation, and employment status as covariates, and the results were unchanged [F(10, 5,155) = 3.46, P < 0.001]. Cell means and pairwise comparisons are summarized in Table 2. For example, currently married respondents who met their spouse through an on-line community or chat room expressed lower levels of marital satisfaction than those who met their spouse through other on-line venues. We also tested for interactions with on-line and off-line venues. Interactions with categorical predictors are available in Appendix S2.
Fig. 1D shows that the vast plurality of respondents who met their spouse on-line did so through on-line dating sites, and Fig. 1E summarizes the percentage of respondents who met their spouse through various on-line dating sites. Marital satisfaction differed across these venues [F(5, 2,381) = 6.42, P < 0.001] (Table 2), and repeating the analysis using year of marriage, sex, age, educational background, household income, ethnicity, religious affiliation, and employment status as covariates did not change these results [F(5, 2,273) = 5.91, P < 0.001].
Discussion
Traditionally, people met their spouse in off-line settings: work, school, social gatherings, and so forth. The majority of Americans still meet their spouse off-line, and among the off-line venues associated with high marital satisfaction are schools, growing up together, social gatherings, and places of worship, whereas among the venues associated with relatively low levels of marital satisfaction are bars/clubs, work, and blind dates.
We also found that a surprising proportion of marriages now begin on-line. Of respondents who married between 2005 and 2012, more than one in three met their spouse on-line. Of those who met their spouse on-line, nearly half met through on-line dating sites, whose number of users has increased dramatically just over the past decade (3). However, little has been known about the demographic characteristics of individuals who meet their spouse on-line or about the satisfaction or break-ups of marriages in which couples meet on-line vs. off-line. Various on-line dating sites claim that their methods for pairing individuals produce more frequent, higher quality, or longer lasting marriages, but the evidence underlying the claims to date has not met conventional standards of scientific evidence including: (i) sufficient methodological details to permit independent replication; (ii) open and shared data to permit a verification of analyses; (iii) the presentation of evidence through peer-reviewed journals rather than through Internet postings and blogs; (iv) data collection free of artifacts, such as expectancy effects, placebo effects, and confirmatory biases by investigators; and (v) randomized clinical trials (3, 9).
In studies of marital outcomes, one cannot randomize directly how one actually meets one’s spouse so the current study was designed to address methodological problems i through iv. Our results were weighted to best approximate marriages between 2005 and 2012, although the voluntary nature of the sampling process and on-line survey may partially limit representativeness (e.g., more men than women reported meeting their spouse on-line). Results indicated that of the continuing marriages, those in which respondents met their spouse on-line were rated as more satisfying than marriages that began in an off-line meeting. Moreover, analyses of break-ups indicated that marriages that began in an on-line meeting were less likely to end in separation or divorce than marriages that began in an off-line venue.
Demographic differences were found for individuals who met their spouse on-line vs. off-line, as well as across on-line venues, on-line dating sites, and off-line venues. For example, individuals who met their spouse on-line, rather than off-line, tend to be more educated and more likely to be used in full-time or part-time work. We also found some evidence that the marital consequences associated with the venue in which respondents met their spouse differ across demographic characteristics. Importantly, the effects found for marital satisfaction and marital break-ups persisted even after statistically controlling for linear and curvilinear differences (Methods) in the demographic characteristics of the respondents.
Whether these outcomes are attributable to something done by a particular on-line site, the greater pool of potential spouses that are available, or the nature of the users who are attracted to and gain access to that site is an important question. Although the observed differences in marital outcome across venues remained statistically significant after controlling for demographic differences, it is possible that individuals who met their spouse on-line may differ, for example, in personality (e.g., impulsivity), motivation to form a long-term marital relationship, or some other factor not assessed here. An alternative hypothesis for the associations is that the larger pool of potential spouses to which individuals who met their spouse on-line had access permitted these individuals to be more selective in identifying a compatible partner. A third hypothesis is that differences in self-disclosure between on-line and off-line venues, and the differences among on-line (and among off-line) venues, may contribute to the observed differences in marital outcomes. Laboratory research has shown that self-disclosures and affiliation are generally greater when strangers first meet on-line rather than face-to-face, and that the differences in self-disclosure can explain the differences in liking (5). Among on-line dating sites, it is also possible that the various matching algorithms may play a role in marital outcomes.
In conclusion, marital outcomes are influenced by a variety of factors. Where one meets their spouse is only one contributory factor, and the effects of where one meets their spouse are understandably quite small and do not hold for everyone. The results of this study are nevertheless encouraging, given the paradigm shift in terms of how Americans are meeting their spouse. The present results addressed marital outcomes in the first 6 or 7 y of marriage, and longer-term follow-up studies are important to determine whether the observed differences in marital outcomes intensify or dissipate over even longer periods of time. Although our analyses concern American marriages, the rapid increase in the use of the Internet is a global phenomenon. The mechanisms suggested above as contributing to our findings may not be specific to America, so investigations are needed to determine whether marriages that begin on-line, in contrast to off-line, predict better marital outcomes in other countries and traditional societies. What is clear from this research is that a surprising number of Americans now meet their spouse on-line, meeting a spouse on-line is on average associated with slightly higher marital satisfaction and lower rates of marital break-up than meeting a spouse through traditional (off-line) venues, and on-line venues are not as homogeneous as thought in terms of marital outcomes. Indeed, the present study shows that the tendency in past studies to treat all on-line venues as the same is no longer empirically justified.
Methods
The authors' involvement in and analysis of the data were reviewed and approved by the University of Chicago Institutional Review Board. The survey was conducted by Harris Interactive in June 2012. E-mail invitations to participate in an on-line survey were sent to 471,710 uSamp panelists. Of those who were e-mailed an invitation, 191,329 (40.06%) clicked on a Harris URL to electronically consent to take the survey. To determine eligibility, respondents were asked to specify: (i) whether they had married since 2005 (including 2005) (Yes/No), (ii) their year of birth, and (iii) their country of residence. Eligibility criteria were that respondents resided in the United States, were at least 18 y of age, and reported being married at least once since the start of 2005. Of these 191,329 respondents, 122,265 were not eligible for the study based on these three criteria, 41,736 exited the survey early, and 7,207 were identified as fraudulent by uSample. Fraudulent responding was defined by Harris Interactive and its contractors as: (i) multiple surveys from the same respondent; (ii) surveys that are completed too quickly to reflect valid data from a human respondent; (iii) surveys from computers with IP addresses that were not within the United States; (iv) surveys sent from a geographical address that was not within the United States; (v) surveys originating from a known list of “professional survey takers”; (vi) a survey from a respondent who is registered multiple times within the uSamp panel; (vii) surveys completed by respondents using an open proxy, which allows users to conceal or disguise their IP address; and (viii) respondents who gave incorrect responses to a respondent instruction. If a respondent met any of these criteria, Harris Interactive categorized the respondent as “Not Qualified.” Of the remaining 20,121 initially classified as qualified, 74 were identified by Harris Interactive as invalid based on evidence of response biases, such as straight-line responding and inaccurate responding to catch-trials or inconsistent responding, leaving a final sample of 20,047 (15.28%) respondents.
Of these 20,047 respondents: 19,131 (95.43%) reported being married once between 2005 and 2012; 172 (0.86%) reported being married between 2005 and 2012 but being currently engaged to another person; 623 (3.11%) reported being married twice between 2005 and 2012; 109 (0.54%) reported being married three times between 2005 and 2012; and 12 (0.05%) reported being married four or more times. Because of the relatively small number of participants in all but the first category, we focus in the text on analyses of the 19,131 respondents who reported being married once between 2005 and 2012 and are not currently engaged to another person. Results were not changed substantively when analyses were conducted using marriage as the unit of analysis (Tables S6–S10) or when means were adjusted for covariates (Tables S11 and S12).
Harris Interactive uses a weighting procedure based on propensity scores to be representative of the population of individuals married between 2005 and 2012. The demographics of the sample are summarized in Table S1. The analyses reported in the text are on weighted means and sample sizes. Harris Interactive sampled individuals, not couples, and slightly more men than women who served as respondents in this study reported meeting their spouses on-line. This finding suggests that the sample is an approximation rather than a perfect representation of the true population.
Respondents were asked to specify their sex, their current marital status [Married, Divorced, Separated, Engaged, Single (never married), or Widowed], and (if not Single) the number of times they had been married since 2005 (including 2005) [Appendix S1 and Dataset S1 (the full dataset is available in SPSS ready format and is available upon request from any of the authors)]. For each marriage, participants were asked the month and year of the marriage and, if the most recent marriage ended in divorce, the month and year of the divorce.
Then for each marriage, beginning with the most recent, respondents were asked whether or not they had met that spouse on-line (Yes, No). If they specified on-line, respondents were asked where on-line did they meet (Chat room, On-line community, Instant messaging, Multiplayer on-line game, Virtual world, On-line dating site, Social networking site, E-mail, Discussion group or posting board, Message or comment on personal Web site, and Other). If participants reported meeting their spouse using an on-line dating site, they were additionally asked which site and were given a list that specified the 18 on-line dating sites with the greatest market share (i.e., Adult Friend Finder, American Singles, Chemistry, Christian café, Christian Dating, Christian Mingle, Christian Singles, eHarmony, JDate, Match, MSN Dating & Personals, OK Cupid, Perfect Match, Plenty of Fish, Singlesnet, True, Yahoo!Personals, Zoosk) and Other. For each of these questions, potential responses were given in random order.
If they reported meeting that spouse off-line, respondents were asked where off-line did they meet (At work, Through friends, At school, Through family members, At a bar/club, At a place of worship, At a social gathering with friends, We grew up together/Have known since childhood, Through an arranged meeting/blind date, and Other). Potential responses were given in random order.
If the respondent was still married, she or he was asked a series of questions about the quality of the marriage. First, they were asked the four-item Couples Satisfaction index (CSI) (10), which included items such as “Please indicate the degree of happiness, all things considered, of your marriage,” and “In general, how satisfied are you with your marriage” on a scale of 1 “Extremely Unhappy” to 7 “Perfect.” The CSI was developed using Item Response Theory and provides excellent levels of precision and reliability (10). Consistent with prior research, the Cronbach α was excellent (α = 0.89) in our survey.
Next, respondents used a scale of 1 “Strongly Disagree” to 7 “Strongly Agree” to answer the following series of questions: “Thinking of your spouse, to what extent to you agree or disagree with the following statements? (a) “We have Chemistry”, (b) “We are happy”, (c) “We are able to understand each other’s feelings”, (d) “We are able to show each other affection”, (e) “We laugh a lot in our relationship”, (f) “We are able to disagree with one another without losing our tempers”, (g) “We ‘get’ each other”, (h) “We are in love”, (i) “We have great communication”, (j) “We are compatible”, and (k) “We trust each other.” Responses to these items were summed to create a second measure of relationship satisfaction. The Cronbach α for this scale was 0.97. The correlation between these two measures of marital satisfaction was 0.78, and a factor analysis confirmed that one factor was sufficient, so analyses were performed on the mean of these two measures.
Next, participants were asked a series of additional demographic questions, including their religion, their ethnic classification, their annual household income, their work status, and the number of children. Finally, participants were asked a series of questions that were used to determine fraudulent responding (as defined above) and to compute propensity weights for the sample. The demographic data served two purposes. First, we analyzed these data as a function of meeting venue to determine the characteristics of the respondents who, for example, met their spouse on-line vs. off-line. Second, to determine the extent to which these differences (i.e., selection bias) were contributing to differences in marital satisfaction or break-up as a function of meeting venue, we ran analyses that included in the statistical models the year of marriage, sex, age, educational background, household income, ethnicity, religious affiliation, and employment status as covariates. We also ran analyses that included quadratic terms for continuous variables that were not coded in categories; this did not change the statistical significance of the results.
Supplementary Material
Acknowledgments
We thank an anonymous reviewer for the perspicacious and constructive questions and suggestions.
Footnotes
Conflict of interest statement: Harris Interactive was commissioned by eHarmony.com to perform a nationally representative survey of individuals in America married between 2005 and 2012. Harris Interactive was not involved in data analyses. J.T.C. is a scientific advisor to eHarmony.com, S.C. is the spouse of J.T.C., and G.C.G. is the former Director of eHarmony Laboratories. To ensure the integrity of the data and analyses and in accordance with procedures specified by JAMA, independent statisticians (E.L.O. and T.J.V.) oversaw and verified the statistical analyses based on a prespecified plan for data analyses. In addition, an agreement with eHarmony was reached prior to the analyses of the data to ensure that any results bearing on eHarmony.com would not affect the publication of the study. The materials and methods used (including the Harris Survey, Codebook, and Datafile) are provided in the Appendix S1, Appendix S2, and Dataset S1 to ensure transparency and objectivity.
This article is a PNAS Direct Submission.
This article contains supporting information online at www.pnas.org/lookup/suppl/doi:10.1073/pnas.1222447110/-/DCSupplemental.
References
- 1.U.S. Bureau of Labor Statistics 2012. American Time Use Survey – 2011 Results (USDL-12-1246). Available at www.bls.gov/news.release/atus.t11.htm. Accessed May 13, 2013.
- 2.Rosenfeld MJ, Thomas RJ. Searching for a mate: The rise of the Internet as a social intermediary. Am Sociol Rev. 2012;77(4):523–547. [Google Scholar]
- 3.Finkel EJ, Eastwick PW, Karney BR, Reis HT, Sprecher S. Online dating: A critical analysis from the perspective of psychological science. Psychological Science in the Public Interest. 2012;13(1):3–66. doi: 10.1177/1529100612436522. [DOI] [PubMed] [Google Scholar]
- 4.Gergen KJ, Gergen MM, Barton WH. Deviance in the dark. Psychol Today. 1973;7:129–130. [Google Scholar]
- 5.McKenna KYA, Green AS, Gleason MEJ. Relationship formation on the internet: What’s the big attraction? J Soc Issues. 2002;58(1):9–31. [Google Scholar]
- 6.Walther JB, Anderson JF, Park DW. Interpersonal effects in computer-mediated interaction. Communic Res. 1994;21(4):460–487. [Google Scholar]
- 7.National Bureau of Economic Research 2011. Current Population Survey Basic Monthly Data March 2011. [Data file and code book]. Available at http://www.nber.org/data/current-population-survey-data.html. Accessed May 13, 2013.
- 8.Aron A. Online dating: The current status—and beyond. Psychological Science in the Public Interest. 2012;13(1):1–2. doi: 10.1177/1529100612438173. [DOI] [PubMed] [Google Scholar]
- 9.Houran J, Lange R, Rentfrow JP, Bruckner KH. Do online matchmaking tests work? An assessment of preliminary evidence for a publicized “predictive model of marital success.”. N Am J Psychol. 2004;6(3):507–526. [Google Scholar]
- 10.Funk JL, Rogge RD. Testing the ruler with item response theory: Increasing precision of measurement for relationship satisfaction with the Couples Satisfaction Index. J Fam Psychol. 2007;21(4):572–583. doi: 10.1037/0893-3200.21.4.572. [DOI] [PubMed] [Google Scholar]
Associated Data
This section collects any data citations, data availability statements, or supplementary materials included in this article.