Abstract
The nature of the coupling between the stalling of the elongated nascent peptide chain in the ribosome and its insertion through the translocon is analyzed, focusing on the recently discovered biphasic force that overcomes the stalling barrier. The origin of this long-range coupling is explored by coarse-grained simulations that combine the translocon (TR) insertion profile and the effective chemical barrier for the extension of the nascent chain in the ribosome. Our simulation determined that the inserted H segment is unlikely to climb the TR barrier in parallel with the peptide synthesis chemical step and that the nascent chain should first overcome the chemical barriers and move into the ribosome–TR gap region before the insertion into the TR tunnel. Furthermore, the simulations indicate that the coupled TR-chemistry free energy profile accounts for the biphasic force. Apparently, although the overall elongation/insertion process can be depicted as a tug-of-war between the forces of the TR and the ribosome, it is actually a reflection of the combined free-energy landscape. Most importantly, the present study helps to relate the experimental observation of the biphasic force to crucial information about the elusive path and barriers of the TR insertion process.
Keywords: arrest peptide, coarse grained model, empirical valence bond, Langevin dynamics, secM
The elongation of nascent peptide chains during their synthesis by the ribosome and the translocon (TR)-assisted insertion of the generated chain into the membrane are coupled in an intriguing way. A glimpse into this coupling has been provided recently by the von Heine group (1), who observed an interplay between the stalling of the elongation process and the TR insertion process. More specifically, it was found that in cases when the elongation stalls due to the presence of an RXXP-type sequence, the process is reactivated by the force generated in the TR for different lengths of the inserted chain. While this finding is very exciting, it is not clear what the exact origin of the applied force is and how it can be coupled to the elongation process, where the insertion into the TR involves an uphill penetration process.
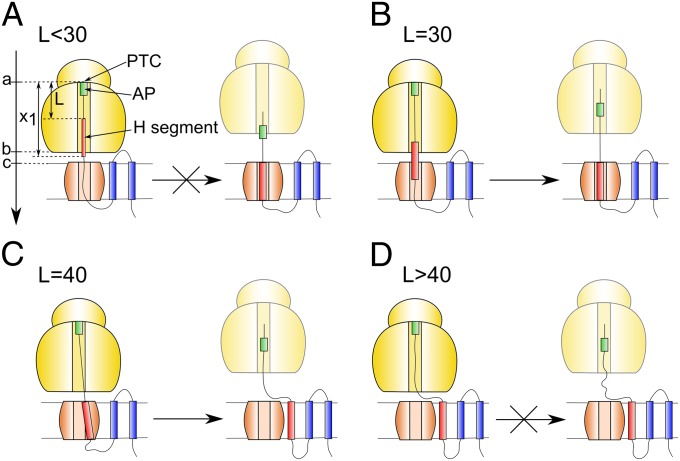
The peptide elongation process and the subsequent insertion are described schematically in Fig. 1 for the system studied by von Heijne and coworkers (1). As seen from the figure, after the peptide bond is synthesized, the extended peptide moves through the TR and then inserts into the membrane. However, the chain extension process can be stalled during the elongation process of the RXXP and other sequences (2–6). This stall reflects, most probably, the increase in the activation barrier for the peptide bond formation, due in part to changes in the preorganization of the active site (SI Text). As demonstrated in ref. 1, for some lengths of the linker (denoted by L) the stalling is released as the H segment (a 19-residue leucine–alanine–based peptide, which was introduced into the leader peptidase protein) passes through the TR (Fig. 1 B and C). On the other hand, for other lengths the stalling cannot be overcome and the ribosome remains attached to the TR (Fig. 1 A and D). Thus, the ratio between the released full-length proteins and stalled proteins, fFL, for different values of L, must contain crucial information of the free energy of the insertion process. However, the analysis of the TR–ribosome coupling force is extremely challenging due to the absence of critical structural information and the enormous complexity associated with the task of combining different parts of the overall puzzle. Attempts to describe this type of biological processes have included phenomenological considerations (7, 8), which have not included system-specific modeling or structure–energy considerations. Coarse-grained (CG) modeling of the transfer of the nascent protein through the TR has been reported (9–11), but the coupling to the ribosome or related systems has not been explored.
Fig. 1.
A schematic description of the effect of having different linker lengths (L) in the ribosome/TR system. The linker starts from the PTC and includes the arrested peptide (AP). (A) At short L the H segment insertion is blocked and the elongation is stalled. (B, C) At L = 30 and L = 40, the H segment insertion helps to break the stall and the ribosome is detached from the TR (probably after completing the synthesis of the rest of the peptide). (D) Finally for L > 40, the H segment is inserted into the membrane and it is not able to break the stalling. The figure also defines key parameters of the system. The arrow in A designates the x coordinate.
Here, on the other hand, we combine all of the elements of the problem with realistic structure-based simulations, using a powerful CG modeling and explicit empirical valence bond (EVB) evaluation of chemical barriers. This combination allows us to elucidate the structural basis of the pulling force as well as to explore the elusive nature of the landscape for the overall stalling process.
Analysis and Results
Constructing Effective Free-Energy Surfaces.
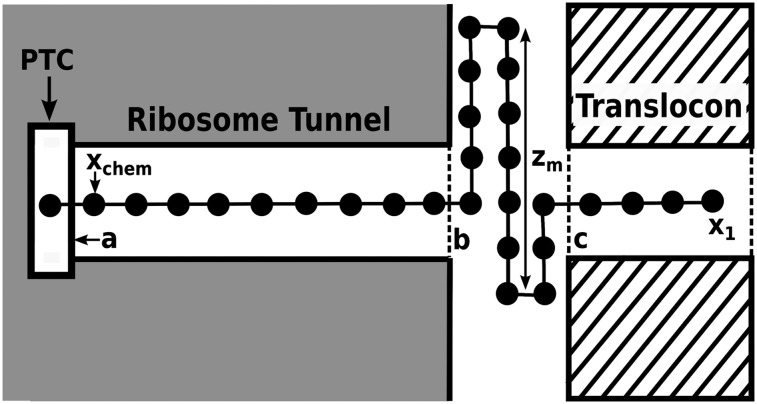
To analyze the energetics of the TR–ribosome coupling, we started by representing the overall system according to the schematic description of Fig. 2. The figure describes schematically the system from the peptidyl transferase center (PTC) to the N-terminal of the H segment (note that the residues preceding the H segment are not included in the current model), where the part of the nascent peptide in the gap region is represented in a linear way for simplicity. More realistic length considerations are given in SI Text including consideration of a partial unfurling of the H segment and helix formation in the ribosome tunnel.
Fig. 2.
A schematic representation of the model, describing the coordinates used in analyzing the system. The beads along the chain are spaced in a schematic way and not according to the realistic and denser spacing. The positions labeled a, b, and c are, respectively, the coordinate of the peak of the chemical barrier, the end of the ribosome, and the start of the TR. x1 is the coordinate of the peptide N-terminal (taken as the end of the H segment, while not including the preceding parts of the protein), and zm is the distance from the furthest points of the peptide stretched in the z direction of the ribosome–TR gap region. This stretching, which reflects the constraint discussed in the text, represents in a simplified way all of the parts of the nascent peptide that are not extended in a linear way in the gap region.
Obviously to combine the effect of the TR and the ribosome, we must consider the combination of the corresponding landscapes. To move in this direction, we expressed the overall energy surface in terms of the key variables, writing:
 |
where UTR is the TR insertion profile, Uchem is the chemical surface, Uribo is the profile for moving through the ribosome tunnel, and Ubond is the bond-stretching potential. The coordinate y is not considered here since it does not provide any additional insight.
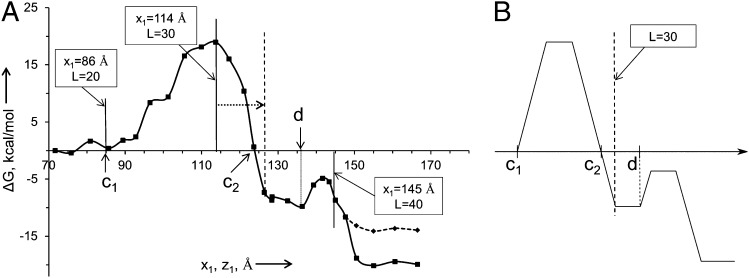
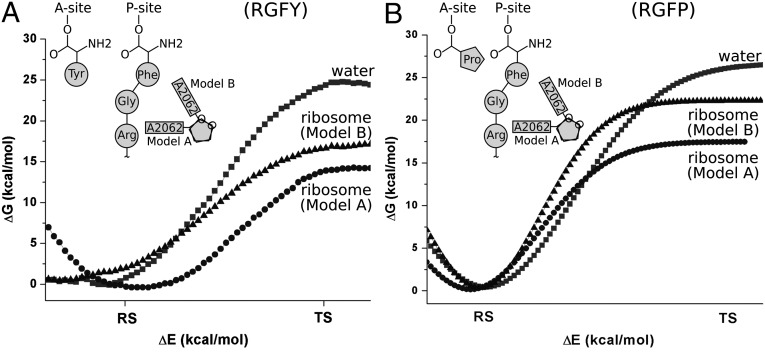
The different terms have been evaluated as follows: (i) The general shape of the TR insertion profile, UTR, was obtained by the same approach used in our recent CG modeling (11), using, however, a more uniform reaction coordinate (SI Text). This profile is depicted in Fig. 3A, where it is related to the length of the fully extended chain and the key values of L are marked, following the considerations outlined in SI Text and Fig. S1. We also converted the CG profile to a generic profile UTR (Fig. 3B), with features that are based on the calculated profile, but with the option to adjust some parameter based on the experimental study of the biphasic force. It is important to note that the region of L around 30 is likely to be shifted to a larger value of x1, reflecting the stretch of the H segment or the uncertainties in the effect of the ribosome on the potential of mean force (PMF) and the ambiguous width of the ribosome–TR gap region (SI Text). Additional features of the TR insertion profile are depicted in Figs. S2 and S3 and discussed in SI Text. (ii) The effective potential Uchem for the chemical barriers of the regular and stalled peptide bond formations was obtained by combining the EVB results and the relevant experimental information about the bond formation in the stalled RGFP sequence (taken as an approximation to RAGP) and in the reference RGFY sequence. Briefly (see full model description in SI Text and Fig. S4), the modeling of the stall barrier was performed by the EVB method starting with the following structures: the X-ray structure with Protein Data Bank (PDB) ID code 1FG0 (12) (where the A site is occupied by 3′-terminal CC tRNA coupled to puromycin) was superimposed on to 1M90 (13) (where the A site is occupied with sparsomycin and the P site with CCA–Phe–caproic acid–biotin). The superimposed structures were used to build a model (model A) where the A site of 1M90 was replaced by CC–puromycin and the P site remained unchanged (CCA–Phe–caproic acid–biotin). The puromycin moiety (at the A site of our model A) was then converted to 3′-linked adenine–tyrosine, and the P site CCA–Phe–caproic acid was changed to CCA–Phe–Gly. In addition, the P site was further elongated by an Arg–Gly–Gly–Gly–Gly peptide chain. The 5′-end CCA sequence of both the A and P sites was terminated with hydroxyl groups. PDB ID code 1VQ7 (14) was taken as a representative of the structure with a flipped A2062 (2, 15) and used as the starting point for building model B (SI Text). The resulting surface (which is presented in Fig. 4) reproduces a significant increase in the activation barrier for the stalled sequence when A2062 undergoes the flipping conformational transition. The analytical form of the resulting chemical barriers is given in SI Text. (iii) In considering Uribo, we noted that this potential reflects both the motion through the ribosome channel and factors such as the elongation factor G (EF-G) involvement in the elongation process (16). However, it is very reasonable to assume that the corresponding barriers are lower than the chemical barrier. Thus, we only introduce a repulsive force (the Urep, which is described in SI Text) that prevents the amino acid that passes the chemical barrier from moving backward. This restoring potential can be considered as a tentative representation of the EF-G action and other vectorial effects. (iv) Ubond is the potential that describes the effective free energy of stretching the virtual bond between the neighboring amino acids. This potential also incorporates the effect of extension of the length of the nascent chain in the ribosome channel. The evaluation of this potential is considered in SI Text and Fig. S5.
Fig. 3.
The profile for the insertion of the 6L/13A H helical segment. The figure is based on the model used in our previous work (11) but with a more uniform reaction coordinate (SI Text). (A) The actual PMF [scaled by 0.7 to represent the effect of the ribosome (11)]. (B) A schematic generic potential. c1 and d are, respectively, the coordinates where the TR and membrane insertion profiles start to go up. Intersection of the TR insertion profile with the horizontal axis is labeled as c2. Note that the position of L ∼ 30 could be shifted to a larger value of x1, reflecting the stretch of the H segment and other effects (SI Text).
Fig. 4.
The EVB reaction free-energy profiles for transition from the reactant state (RS) to the TS for the peptide bond formation reaction in water and in ribosome for both the RGFY (A) and RGFP (B) sequences, at the peptidyl transfer centers of both the models (model A and model B). The free-energy profile is given as a function of the energy gap reaction coordinate (ΔE). The solution reaction corresponding to the sequence RGFY was calibrated against the activation barrier of 24 kcal/mol and for the sequence RGFP against 26 kcal/mol. The calibrated parameters were transferred to ribosome simulations without any change. The schematic picture shows the orientation of the A2062 nucleobase for models A and B in both systems.
Note that the coupling between the chemical barrier of the stalled residue and the stretching of the chain comes through the force applied on the x coordinate of the reacting residue. More sophisticated coupling forms are possible, but with the present structural uncertainties, they are not justified.
Simplified Strong Coupling Model and the Constraint of Sequential Pulling and Insertion Processes.
The potential of Eq. 1 will be used in LD simulations, with all possible values of the coordinates of each amino acid (see next subsection). However, it is very useful to consider the limit when the subunits are strongly coupled by rigid bonds (with the option of uniform stretching) and to explore this surface in a more restricted and schematic space defined by Fig. 2. In this model the folding of the chain in the region between the ribosome and the TR is projected into a single line. The main features of the corresponding surface can be described and conceptualized by Fig. 5, which considers the energetics in the space defined by zm and x1, which are, respectively, the length of the peptide loop stretched in the z-directions and the coordinate of the N-terminal particle. Here the dependence of Uchem on x1 comes through the implicit relationship between x1 and xchem, which is the distance from the PTC to the last residue in the elongated peptide, where:
where  is the standard effective spacing between subsequent amino acids, assumed here to be equal for simplicity (SI Text), l is the number of amino acids in the chain, and zm is the distance from the furthest points that the fully stretched peptide can reach in the z direction of the ribosome–TR gap region. Thus, we have:
 |
where  is the effective bonding potential, for equal stretching of all bonds, expressed in terms of x1 (SI Text). The dependence on the z coordinates in the TR and in the ribosome is eliminated here since we constrain the motion to zi = 0 at these regions and we do not explore the motion to the membrane with this specific effective potential.
Fig. 5.
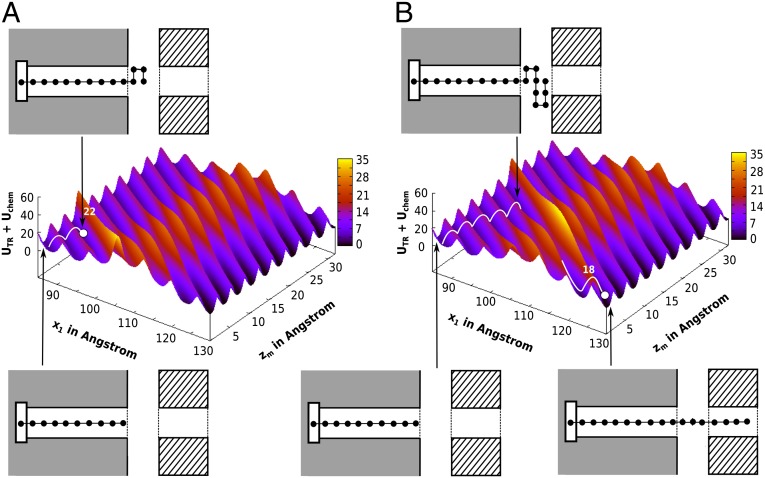
The free-energy surface for the chain motion in the ribosome/TR system in the effective x1, zm space. The figure shows that the least energy path must involve a diagonal motion along the  zm = –
 x1 path so that the chemical barrier will not be added to the TR barrier. The figure presents the least energy path for L = 24 (A) and L = 30 (B), showing that the stall barrier is drastically reduced for L = 30, where the chain can now pass the TR barrier overcoming the effect of stall. The schematic figures on the side panels show the configurations of the chain. The overall length of the chain folded in between the ribosome and TR is denoted by 2zm. The barriers used for the regular chemical, TR insertion, and the stall chemical processes are 15, 18, and 22 kcal/mol, respectively. The x1 scale reflects an extension of the H segment.
The landscape of U′eff (Fig. 5) has the following regions: at zm = 0, the increase of x1 leads to a potential, which is the combination of UTR and Uchem, where x1 corresponds in this case to the length of the stretched chain. When x1 increases and zm decreases, the profile reflects UTR, and in this case, we move along the diagonal of the surface. When x1 is pulled with a fixed zm, Uchem is activated and we have contributions from both UTR and Uchem. When zm changes with a fixed x1, only Uchem changes. Overall the least energy path involves increasing x1 and decreasing zm. The most interesting point resolved by the map is the observation that moving with a fully stretched chain cannot work, since the barrier will be the sum of the chemical barrier and the TR barrier. This would make it impossible to pass at any range, where the TR potential is positive, with the stall potential and even with smaller chemical potential (see the surface for zm = 0). Moving the peptide in the zm direction (or the equivalent ym in a 3-D model) with low TR barrier and then moving along the diagonal (changing x and z) allows decoupling of the TR and the chemical barrier along uphill parts of the TR potential. As seen from the figure, the stall barrier is drastically reduced for L around 30 (using a model where x1 for L > 30 corresponds to a region to the right of the TR barrier). The reason for this crucial effect will be discussed below. The decoupling of the chemistry from the TR potential could occur if after each move in the z direction, both x1 and z change, or if first a sufficient amount of the chain is folded in the z direction and then x1 is extended by pulling the chain. At any rate, the complete system imposes the constraint that a part of the nascent peptide must be extended to the z direction before being inserted into the ribosome.
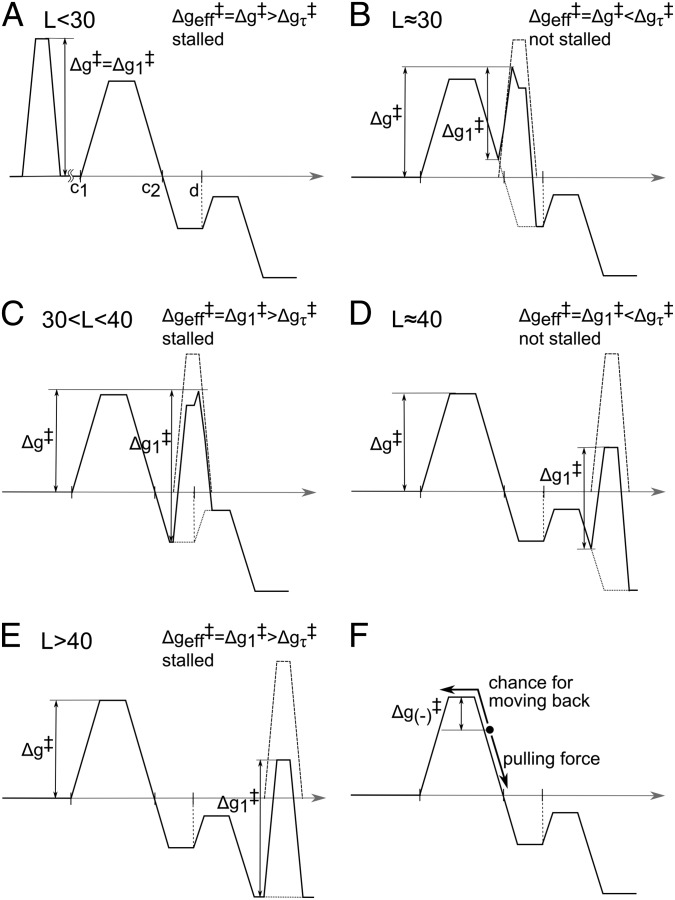
While the surface of Fig. 5 describes the general features of the insertion/stalling process, it is useful to consider the details of the barriers along the least energy path of Fig. 5, for different values of L, and this is done in Fig. 6. In the range of L < 30 (Fig. 5A), the chain moves along zm, where it cannot pass the stall barrier. Moving along x1 would lead to an even higher barrier, as shown in Fig. 6. Thus, the least energy path (Fig. 6A) has a barrier, which is larger or equal to the stall barrier. When L∼30 (Fig. 5B) and x1 increases, we start to have both negative slope and negative value of UTR (note the above considerations of the position of L = 30). Thus, the activation barrier for moving across the chemical (stall) barrier is reduced. Now, the effective barrier, Δg≠, is sufficiently small to allow the system to pass the stall barrier and to move forward from the stall region (Fig. 6B). At the range of 30 < L < 40 (Fig. 6C), the kinetics is controlled by the barrier  that corresponds to kcat in enzyme kinetics. This barrier is similar to the original stall barrier and the system stay stalled. Now when L is around 40 (Fig. 6D), we have a sliding motion into the membrane where the slope is negative and the barrier,
  , is low. Finally, at the range of L > 40 (Fig. 6E), the helix is fully inserted in the membrane and the slope of the potential is close to zero. Thus, although the absolute energy of the transition state (TS) is low,
  is high and the stall is retained.
Fig. 6.
Analyzing the combined effect of the TR surface and stalling barrier for different values of L. The figure considers in a schematic way the least energy paths of Fig. 5, for different values of L, and analyzes the corresponding effective barrier. The figure does not consider the chemical barriers, which are not involved in the stall, since they are overcome by the diagonal motion of Fig. 5. The combined chemical and TR profile is drawn in a solid line. Δgτ‡ is the barrier that corresponds to the time larger than the experimental time or the time when competing processes stop the insertion. (A–E) The profiles obtained by combining the chemical and the TR profiles for different values of L. The figure shows that the displacement of the chemical barrier along the reaction coordinate can lead to either stalled or non stalled cases, depending on the value of Δgeff‡. Δg1‡ and Δg‡ are defined by the figure and Δgeff‡ is estimated by considering the expected kinetics with the given profile. (F) Showing the case where x1 is in a region with a pulling force but with a small backward barrier. In this case the pulling force from the TR might be not enough to overcome the stall (because some of the molecules will move backward to the other side of the barrier).
LD Simulations of the Coupling Between the Insertion and Stalling Processes.
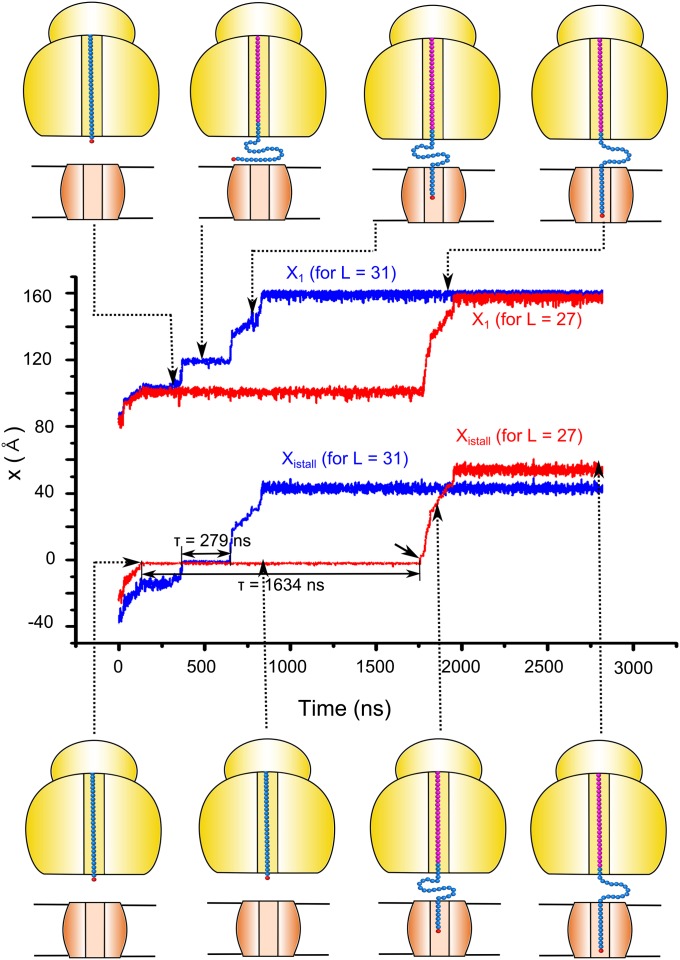
While the general features of the staling process have been explored above with U′eff and the restricted space of x1 and zm, it is also crucial to explore the nature of the biphasic force by using the Ueff of Eq. 1 and the set of coordinates of the amino acids involved. This is important since the coupling assumed for the units of the chain might not be fully justified. In particular, one can argue that we have here “interference” effects, where the motions in the region of x1 are not coupled to the motions in the stalled region. Furthermore, one may assume non-Boltzmann dynamical effects that will complicate the analysis of Figs. 5 and 6, where we basically assumed that the motions of x1 and xistall are identical. Thus, we used LD simulations of the full model of Eq. 1 with the frictional parameters discussed in SI Text. Some results of the simulations are described in Fig. 7 (and in Movie S1). The figure describes trajectories for L = 31 and L = 27, where we show that the trajectory with L = 27 spends much longer time at the stall region. Similar behavior would occur at L∼40, when the trajectory moves the system to the membrane. As in previous studies, we run trajectories in a relatively short time with scaled-down barriers and then established that the time for higher barriers is scaled like the Boltzmann factor (see figure S2 in ref. 17). This scaling was then used in extrapolating the passage time to the value that corresponds to the full barrier. More specifically, the simulations where all of the barriers were scaled by 0.43 yielded a first passage time of about 0.28 10−6 s for L = 31 (scaled stalled barrier of about 9.4 kcal/mol and TR barrier of about 8.5 kcal/mol) and 1.63 10−6 s for L = 27. The simulations presented in Fig. 7 would give for the unscaled case (a stall barrier of 22 kcal/mol) a first passage time of about 370 s or a rate constant of 2.7 10−3 s−1 for L = 31. On the other hand, the unscaled rate constant for L = 27 is around 4.6 10−4 s−1. The ratio between the rate constants of the L = 31 and L = 27 models can also be larger with different coupling models, but the main point of the simulations is that the time of passing the stalled barrier is significantly shorter for L = 31.
Fig. 7.
The results of LD simulation of the peptide penetration process and the stalling effect. The figure describes the time dependence of xistall and x1 for a peptide chain with 40 and 36 units, which corresponds to L = 31 (blue) and 27 (red), respectively. [The barriers used for the LD simulations were obtained by scaling down the energy terms by 0.43. This allowed simulating the insertion process in a relatively short time and then estimating the relevant time for the actual barriers by using the corresponding Boltzmann probability (SI Text).]. The snapshots on the top and bottom of the plot shows the configuration of the nascent peptide chain for L = 31 and L = 27, respectively. The ribosome and TR are shown schematically, the starting configuration of the nascent chain is in cyan, the leading particle (x1) is in red, and all other particles added to the growing chain are shown in magenta. The interpolated time (that should be obtained without scaling) for L = 31 and L = 27 are 6 min and 36 min, respectively. Other parameters can lead to a larger time difference.
At this point it may be useful to comment on the analogy between the full LD and the treatment of Figs. 5 and 6. That is, in the case of L > 30, one may wonder why we combined the free energies of the stall and TR profiles in, for example, the case when xistall < xchem and x1 = c2. The answer is that the chance of xistall to be at the stall region and x1 to be at the given TR region is determined by the product of the corresponding Boltzmann factors. Of course, one may suggest that if the trajectory of x1 is downhill, it is more likely to pull xistall uphill, but when x1 is near the top of the barrier with a downhill slope and is being held by the stall force, it can just pass back to the other side of the barrier, since the corresponding free-energy cost is small (Fig. 6F). Apparently the situation is complex and is best handled by the LD simulations.
Overall the differences between the LD results and the approximation of correlated motion of Fig. 5 provide some interesting insight. First, for the cases with L < 30, we find that x1 does not have to continue in climbing on the TR potential when the stall potential is reached by xistall, since it costs less energy when x1 stays at the low-energy region in the TR channel. Thus, the time of passing the stall barrier is mainly limited by the time of passing the pure stall barrier (no TR effect) and can be approximated by:
where  is the apparent time of passing the stall barrier and
  is the average time of passing the stall chemical barrier without any involvement of the TR. On the other hand, the effect of the TR at L > 30 is more direct and can be expressed by:
where  is the effect of the TR in reducing the effective stall barrier.
Another potentially interesting aspect is the time of forming the helix in the b–c region or inside the TR. This time was not simulated here explicitly as we did not introduce realistic potential for helix coil transition and since the actual space between the ribosome and the TR is not yet known and the corresponding effect might change the insertion time. However, here we have a high stall potential and a relatively large TR barrier, and the overall rate is likely to be determined by the highest barriers.
It might be also useful to comment here on the friction constant of 10 ps−1 obtained by our renormalization approach (SI Text). The corresponding range of diffusion coefficient D (∼10−8 cm2/s) has been reported for freely diffusing peptide chains (18, 19). However, efforts to model the transfer of protein chains through translocation pores led some workers (20, 21) to a much lower value (∼10−15 cm2/s). This value probably reflects the missing effects of the translocation barrier through the pore.
Examining the Consistency Between the Calculations and the Experimental Observations.
At this stage it is important to explore the consistency between the calculation and the relevant experimental information. We start by examining the relationship between the calculated PMF (Fig. 3A) or the generic potential of Fig. 3B with the relevant experimental information. One of the key requirements for reproducing the experimental trend is the position of c1 and in requirement that the region between c2 and d has negative energy relative to c1. This is essential since with positive energy at the c2–d region, the barrier for the stalled chemical step cannot be reduced for L about 30. Now as seen from Fig. 3A and Fig. S1, we find that L = 30 is at x1 of ∼114 Å. While the PMF at this point is too high, stretching the helix by 5–8 Å (SI Text) can extend x1 to a point that moves toward c2. This stretched position is in fact consistent with the length estimate of ref. 1, where the helix was assessed to be partially unfolded. Alternatively the uncertainties in the effect of the ribosome on the PMF or on the distance between b to c can rationalize by moving to the description of Fig. 3B. Furthermore, other features are clearly consistent with the changes in the PMF upon changes in the sequence of the H segment. For example, when the sequence becomes more hydrophobic (changing from 19A to 6L/13A and to 11L/8A), the profile drops down (Fig. S2A), thus reducing the TR and membrane insertion barriers. This correlates with the observation (1) that more hydrophobic sequences for both L = 28 and L = 39 increase the fraction of molecules that overcome the stall (figure 2D in ref. 1). Another example is provided by examining the mutation studies reported in ref. 1, where the Ala to Arg mutation at the center of the of the 6L/13A H segment (c–R) changes fFL from 0.9 to 0.7 for L = 30 and from 0.9 to 0.4 for L = 39. On the other hand, the Ala to Arg mutation at the beginning of the helix (N–R) changes fFL from 0.9 to 0.5 for L = 30 and from 0.9 to 0.4 for L = 39. The trends of these results are consistent with the results reported in Fig. S2B, where we observed negative  for going from c–R to N–R at x1 of around 120 Å that corresponds to the critical region for L = 30, whereas we observed positive
  at the region of x1 = 150 Å that corresponds to L = 40.
An important validation of our LD simulation comes from the estimation of the ribosomal translation rate. Using the data from Fig. 7, we can see that the istall particle moves by about 38 Å along the ribosome tunnel in 400 ns, which corresponds to the 2.5 s for the unscaled chemical barrier of 16.5 kcal/mol. Using the average peptide bond distance of 3 Å, we find that 12.6 amino acids are added to the peptide in this timeframe. This gives a ribosomal translation rate of 5 aa/s, which is close to the experimentally observed rate of 5–20 aa/s (22, 23).
Additional issues of consistencies between the calculated and observed trends are discussed in SI Text, including the implications of the results of Fig. S3.
Concluding Discussion
The remarkable observation that the insertion of the growing nascent chain into the TR and the corresponding biphasic force can overcome the stalling effect in the ribosome presents an intriguing puzzle whose resolution should provide an important biological insight. This observation is both insightful and a potentially powerful tool for understanding both the energetics of the chain propagation in the ribosome and the insertion process in the TR. Exploring the origin of this effect by molecular-based simulation approaches requires one to account both for the effect of the ribosome and the TR and thus presents a major challenge. Here we applied our CG model, which combined the PMF from our recent simulations of the energetics of the TR insertion process and a simulation of the stalling process in the ribosome. The combined CG model reproduces the observed experimental trend and provides insight on the nature of the TR “force.” It is demonstrated that the effect of the TR on the stalling reflects the free-energy landscape of the insertion process, where overcoming the stalling requires the PMF to be both negative and with a negative slope. It is also found that the TR–ribosome coupling provides a constraint on the penetration path, where a direct insertion with a stretched peptide would be blocked by the sum of the TR and chemical potential (see the profile for moving along x1 in Fig. 5). Thus, the path that avoids the penalty of the chemical barrier involves first the stretch of the nascent chain into the space between the TR and the ribosome. However, at some point, the effect of the two barriers must be added and the system should overcome the sum of the height of the TR profile at the given point and the height of the chemical barrier. Fortunately when the TR breaks the stall, the sum is smaller than the stall barrier.
Overall the simulations are consistent with several key experimental facts including the estimate of the ribosomal translation rate. However, some features of the models were not uniquely determined. In particular, the model used in this work is based on a PMF of the TR insertion process and the corresponding profile can be reduced significantly by the interaction between the TR and the ribosome (11), whose actual nature requires more structural information. Apparently, it is possible that the TR barrier is lower than our estimate and that the interaction between the TR and the ribosome involves structural coupling, where the penetration of the peptide to the TR changes the structure of the ribosome in a way that affects the stall.
Obviously, the present simulations do not cover all of the possible options for the observed coupling. Thus, it may have been interesting to consider the inverse problem of trying to construct different generic TR potentials and to explore by LD simulations which one accounts best for the observed fFL. However, as in the case with other complex systems, it is unlikely that such an analysis would lead to unique conclusions. However, the present simulations seem to suggest that the general features of the TR profile, as well as its coupling with the highest barriers of the profile for the extension of the nascent peptide through the ribosome tunnel, have been captured by the CG modeling. This yields a more detailed view on the overall insertion process and a hope for further structure-based advances. Furthermore, the current study provides an insight on the nature of the stall and its response to the long-distance pulling effect. Overall, it seems that the combination of experimental measurements and simulations can help to quantify the details of the TR profile.
Methods
The present work uses a CG model that describes the main chains by an explicit model and represents the side chains by a simplified united atom model (9). The model includes a unique treatment of the electrostatic energy including the self-energy that gives its reliable features. The CG treatment used to obtain the insertion profile has been described in ref. 11. The EVB calculations used to obtain the chemical barrier in the ribosome and the details of the LD simulations are described in SI Text.
Supplementary Material
Acknowledgments
We thank Dr. Matthew Mills for his help with the movie creation and the University of Southern California’s High Performance Computing and Communication Center for computer time. This work was supported by National Institutes of Health Grants GM40283 and GM02449.
Footnotes
The authors declare no conflict of interest.
This article contains supporting information online at www.pnas.org/lookup/suppl/doi:10.1073/pnas.1307869110/-/DCSupplemental.
References
- 1.Ismail N, Hedman R, Schiller N, von Heijne G. A biphasic pulling force acts on transmembrane helices during translocon-mediated membrane integration. Nat Struct Mol Biol. 2012;19(10):1018–1022. doi: 10.1038/nsmb.2376. [DOI] [PMC free article] [PubMed] [Google Scholar]
- 2.Bhushan S, et al. SecM-stalled ribosomes adopt an altered geometry at the peptidyl transferase center. PLoS Biol. 2011;9(1):e1000581. doi: 10.1371/journal.pbio.1000581. [DOI] [PMC free article] [PubMed] [Google Scholar]
- 3.Tanner DR, Cariello DA, Woolstenhulme CJ, Broadbent MA, Buskirk AR. Genetic identification of nascent peptides that induce ribosome stalling. J Biol Chem. 2009;284(50):34809–34818. doi: 10.1074/jbc.M109.039040. [DOI] [PMC free article] [PubMed] [Google Scholar]
- 4.Yap M-N, Bernstein HD. The plasticity of a translation arrest motif yields insights into nascent polypeptide recognition inside the ribosome tunnel. Mol Cell. 2009;34(2):201–211. doi: 10.1016/j.molcel.2009.04.002. [DOI] [PMC free article] [PubMed] [Google Scholar]
- 5.Doerfel LK, et al. EF-P is essential for rapid synthesis of proteins containing consecutive proline residues. Science. 2013;339(6115):85–88. doi: 10.1126/science.1229017. [DOI] [PubMed] [Google Scholar]
- 6.Pavlov MY, et al. Slow peptide bond formation by proline and other N-alkylamino acids in translation. Proc Natl Acad Sci USA. 2009;106(1):50–54. doi: 10.1073/pnas.0809211106. [DOI] [PMC free article] [PubMed] [Google Scholar]
- 7.Elston TC. Models of post-translational protein translocation. Biophys J. 2000;79(5):2235–2251. doi: 10.1016/S0006-3495(00)76471-X. [DOI] [PMC free article] [PubMed] [Google Scholar]
- 8.Wang H, Oster G. Energy transduction in the F1 motor of ATP synthase. Nature. 1998;396(6708):279–282. doi: 10.1038/24409. [DOI] [PubMed] [Google Scholar]
- 9.Rychkova A, Vicatos S, Warshel A. On the energetics of translocon-assisted insertion of charged transmembrane helices into membranes. Proc Natl Acad Sci USA. 2010;107(41):17598–17603. doi: 10.1073/pnas.1012207107. [DOI] [PMC free article] [PubMed] [Google Scholar]
- 10.Zhang B, Miller TF., 3rd Long-timescale dynamics and regulation of Sec-facilitated protein translocation. Cell Rep. 2012;2(4):927–937. doi: 10.1016/j.celrep.2012.08.039. [DOI] [PMC free article] [PubMed] [Google Scholar]
- 11.Rychkova A, Warshel A. Exploring the nature of the translocon-assisted protein insertion. Proc Natl Acad Sci USA. 2013;110(2):495–500. doi: 10.1073/pnas.1220361110. [DOI] [PMC free article] [PubMed] [Google Scholar]
- 12.Nissen P, Hansen J, Ban N, Moore PB, Steitz TA. The structural basis of ribosome activity in peptide bond synthesis. Science. 2000;289(5481):920–930. doi: 10.1126/science.289.5481.920. [DOI] [PubMed] [Google Scholar]
- 13.Hansen JL, Schmeing TM, Moore PB, Steitz TA. Structural insights into peptide bond formation. Proc Natl Acad Sci U S A. 2002;99(18):11670–11675. doi: 10.1073/pnas.172404099. [DOI] [PMC free article] [PubMed] [Google Scholar]
- 14.Schmeing TM, Huang KS, Strobel SA, Steitz TA. An induced-fit mechanism to promote peptide bond formation and exclude hydrolysis of peptidyl-tRNA. Nature. 2005;438(7067):520–524. doi: 10.1038/nature04152. [DOI] [PubMed] [Google Scholar]
- 15.Vázquez-Laslop N, Ramu H, Klepacki D, Kannan K, Mankin AS. The key function of a conserved and modified rRNA residue in the ribosomal response to the nascent peptide. EMBO J. 2010;29(18):3108–3117. doi: 10.1038/emboj.2010.180. [DOI] [PMC free article] [PubMed] [Google Scholar]
- 16.Schmeing TM, Ramakrishnan V. What recent ribosome structures have revealed about the mechanism of translation. Nature. 2009;461(7268):1234–1242. doi: 10.1038/nature08403. [DOI] [PubMed] [Google Scholar]
- 17.Mukherjee S, Warshel A. Electrostatic origin of the mechanochemical rotary mechanism and the catalytic dwell of F1-ATPase. Proc Natl Acad Sci USA. 2011;108(51):20550–20555. doi: 10.1073/pnas.1117024108. [DOI] [PMC free article] [PubMed] [Google Scholar]
- 18.Simon SM, Peskin CS, Oster GF. What drives the translocation of proteins? Proc Natl Acad Sci USA. 1992;89(9):3770–3774. doi: 10.1073/pnas.89.9.3770. [DOI] [PMC free article] [PubMed] [Google Scholar]
- 19.Peskin CS, Odell GM, Oster GF. Cellular motions and thermal fluctuations: The Brownian ratchet. Biophys J. 1993;65(1):316–324. doi: 10.1016/S0006-3495(93)81035-X. [DOI] [PMC free article] [PubMed] [Google Scholar]
- 20.Liu H, Shi Y, Chen XS, Warshel A. Simulating the electrostatic guidance of the vectorial translocations in hexameric helicases and translocases. Proc Natl Acad Sci USA. 2009;106(18):7449–7454. doi: 10.1073/pnas.0900532106. [DOI] [PMC free article] [PubMed] [Google Scholar]
- 21.Chauwin JF, Oster G, Glick BS. Strong precursor-pore interactions constrain models for mitochondrial protein import. Biophys J. 1998;74(4):1732–1743. doi: 10.1016/S0006-3495(98)77884-1. [DOI] [PMC free article] [PubMed] [Google Scholar]
- 22.Hershey JW. Translational control in mammalian cells. Annu Rev Biochem. 1991;60:717–755. doi: 10.1146/annurev.bi.60.070191.003441. [DOI] [PubMed] [Google Scholar]
- 23.Bilgin N, Claesens F, Pahverk H, Ehrenberg M. Kinetic properties of Escherichia coli ribosomes with altered forms of S12. J Mol Biol. 1992;224(4):1011–1027. doi: 10.1016/0022-2836(92)90466-w. [DOI] [PubMed] [Google Scholar]
Associated Data
This section collects any data citations, data availability statements, or supplementary materials included in this article.


