Abstract
Undulatory locomotion, a gait in which thrust is produced in the opposite direction of a traveling wave of body bending, is a common mode of propulsion used by animals in fluids, on land, and even within sand. As such, it has been an excellent system for discovery of neuromechanical principles of movement. In nearly all animals studied, the wave of muscle activation progresses faster than the wave of body bending, leading to an advancing phase of activation relative to the curvature toward the tail. This is referred to as “neuromechanical phase lags” (NPL). Several multiparameter neuromechanical models have reproduced this phenomenon, but due to model complexity, the origin of the NPL has proved difficult to identify. Here, we use perhaps the simplest model of undulatory swimming to predict the NPL accurately during sand-swimming by the sandfish lizard, with no fitting parameters. The sinusoidal wave used in sandfish locomotion, the friction-dominated and noninertial granular resistive force environment, and the simplicity of the model allow detailed analysis, and reveal the fundamental mechanism responsible for the phenomenon: the combination of synchronized torques from distant points on the body and local traveling torques. This general mechanism should help explain the NPL in organisms in other environments; we therefore propose that sand-swimming could be an excellent system with which to generate and test other neuromechanical models of movement quantitatively. Such a system can also provide guidance for the design and control of robotic undulatory locomotors in complex environments.
Keywords: neuromechanics, resistive force theory, electromyography, movement, biomechanics
Animal movement emerges from the complex interplay of nervous and musculoskeletal systems with the environment. Much progress has been made in understanding the neural control patterns and motor systems responsible for effective locomotion (1–7). Although the environment’s influence on neural control is increasingly recognized (8, 9), challenges remain in understanding how environments shape the control strategy of locomotion. Particular behaviors, gaits, and environments have revealed themselves to be amenable to detailed comparison of experiment and theory to elucidate neuromechanical principles of control (4, 10–12). Much progress has been made in the study of undulatory locomotion, a movement strategy used by numerous, phylogenetically diverse animals, such as fish, snakes, worms, and sandfish lizards (Scincus scincus) (13–18) (Fig. 1), to traverse fluids, solids, and even sand.
Fig. 1.
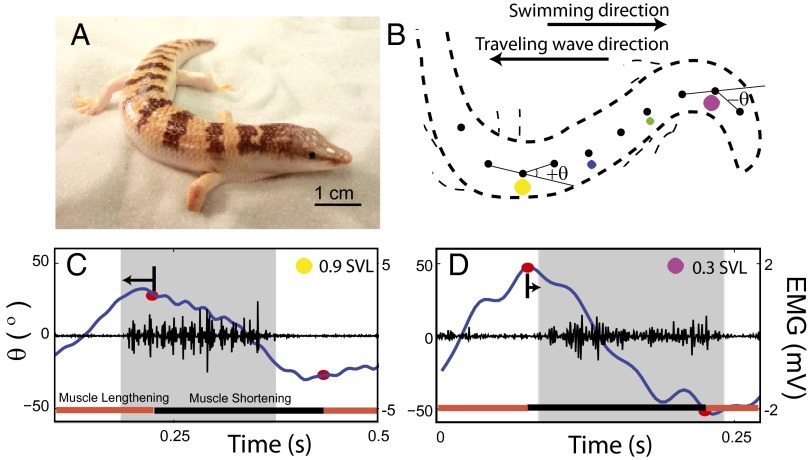
NPL of the sandfish during sand-swimming. (A) Sandfish lizard resting on 0.3-mm-diameter glass particles. (B) Trace of an X-ray image of the sandfish during subsurface sand-swimming at time t = 0.21 s in C and D. Opaque markers (black circles) are attached to the exterior midline to facilitate tracking. Electrodes are implanted in epaxial musculature on the right side of the body at 0.3 (magenta circle), 0.5 (green circle), 0.7 (blue circle), and 0.9 (yellow circle) SVL locations (where the vent is just posterior to the pelvic girdle and the SVL is ∼0.75 of the total body length). (C and D) Electromyogram (EMG) recordings at 0.9 and 0.3 SVLs, respectively, during sand-swimming. Gray regions indicate time duration over which the rectified filter EMG is above a threshold (equal to the mean of the rectified-filtered signal) indicating muscle activation [more details are provided in the study by Sharpe et al. (26)]. The blue line shows the measured angle between consecutive markers (B). The red circles show the maximum or minimum of the best second-order polynomial fit to the angle vs. time series for each half-cycle. Arrows indicate the difference in time between the onset of muscle activation and maximal convexity. Note the different scales for EMG due to different electrode constructions.
In undulatory locomotion, a traveling wave of muscle activation (and curvature) propagates from head to tail resulting in forward movement. The forces produced on different “segments” of the body can be decomposed into thrust and drag, and summing these over the body at any instant in time determines the propulsion of the animal. Many robots have also been built that use such a gait (19–21). A feature of undulatory locomotion that is observed across a range of animal sizes and environments is that the wave of muscle activation travels faster than the wave of curvature (22–26). Consequently, the relative phase of the muscle activation to the curvature advances along the body. Physically, this means that more posterior muscles begin activating earlier in the muscle strain cycle (i.e., while the muscle is lengthening) and produce more negative work than anterior muscles. The phenomenon of the advancing neuromechanical phase is often referred to as “neuromechanical phase lags” (NPL) (Fig. 1 C and D).
Two complementary modeling approaches are used to understand movement principles. The “bottom-up” approach (referred to as “anchoring” in ref. 27) integrates realistic models of multiple biocomponents and the complex interactions among them, as well as with models of the environment. For example, a model (28) might incorporate tens to hundreds of muscles, hundreds to thousands of neurons, chemical kinetics, and the nonlinear couplings among them. Further complexity could be added by coupling these models to fluids that are governed by complex partial differential equations. In contrast, the “top-down” approach (referred to as “templates” in ref. 27) identifies coordinated components as one single element to generate reduced models and seeks general principles of system behavior. Using the first approach, many multiparameter neuromechanical models (10, 28–33) have been proposed to model undulatory locomotion. Although such models qualitatively reproduce the NPL in undulatory swimming, due to uncertainties about the passive body properties and the hydrodynamical forces, as well as the model complexity and number of parameters, it remains a challenge to explain the origin of the phenomenon.
In this paper, we show that what might seem to be a specialized and complex system, a lizard “swimming” in sand using an undulatory gait, facilitates quantitative comparison between experiment and theory, and helps explain the fundamental origin of the NPL in undulatory locomotion in other environments. We base the present work on our previous biological muscle activity measurements (26), which revealed that the sandfish displays NPL when targeting a particular behavior: escape. Using a template approach, inputting kinematics of the lizard that confer swimming speed and energetic benefits (34) into a previously developed granular resistive force model of sand-swimming, and abstracting the nervous system and musculoskeletal system as a “black box,” we are able to reproduce internal torque timing patterns (i.e., from muscle contractions) with no fitting parameters. The simple kinematics combined with the relatively simple rheological features of organism-fluidized sand allow us to analyze the model, and thus make statements about general principles of neuromechanics in swimming that are applicable to organisms and robots in other environments.
Model
Resistive Force Theory Model.
Previously, we developed a granular resistive force theory (RFT) model and a numerical simulation that explained the swimming performance of the sandfish (18, 34, 35). The models showed that the lizards swim within a self-generated “frictional fluid,” wherein frictional forces between the granular particles dominate both body inertia and inertial forces from the environment. As before, we prescribe body kinematics (in the frame of the animal) based on the experimental observation that the body position of a sandfish in the body frame is approximately a single-period sinusoidal wave traveling posteriorly (Fig. 2):
 |
where  is the lateral displacement from the midline of a straight animal, A is the amplitude, T is the period of undulation, λ is the wavelength, t is the time, and
  is the distance along a line parallel to the direction of the traveling wave measured from the tail tip. Here, we normalize both the wavelength and period to 2π such that
  . Because the trunk of the sandfish is quite uniform [with body width variations less than about 5% from 0.1 snout-to-vent length (SVL) to 1.0 SVL] and the diameter of the body decreases significantly after about 1.2 SVL, we used a uniform body shape and took the total arc length (L) in the model to be 1.2 times the average SVL (8.9 ± 0.3 cm) of the animal. Dissection revealed after 1.2 SVL, the tail is composed of mostly adipose tissue and a small amount of muscle; therefore, both the external and internal torques on the tail should be minimal for the tail beyond 1.2 SVL. We neglected the variation of the horizontal position xb of a segment within a cycle; thus, the normalized position on the animal body,
  , corresponded to the horizontal position xb in the model, where s is the arc length from the tail end. When a smaller amplitude was used, the wavelength was kept as 2π.
Fig. 2.
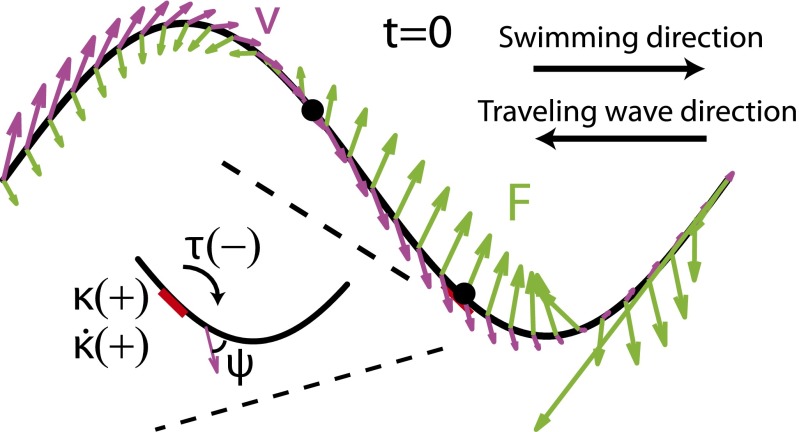
Diagram of the model. Magenta arrows represent velocity, and green arrows represent forces from the medium. Signs of the torque (τ), the curvature (κ), and the rate of change of curvature ( ) at ∼0.6 SVL on the body. Negative τ corresponds to no muscle activation on the right side of the body (red thick line). ψ indicates the angle between the segment axis and its velocity.
For swimming in sand, the granular force,  , on any infinitesimal segment of the swimmer is independent of the segment speed (and thus undulation frequency), proportional to its depth, and is a function of the angle (ψ in Fig. 2) between the segment axis and its velocity direction (the empirically determined granular force,
  , is shown in Supporting Information). The depth of a segment is calculated assuming the model sandfish swims with its center 3.5 cm below the horizontal plane and at an entry angle of 22° [an average value for the sandfish (18)]. The entry angle is the angle between the horizontal plane and the plane in which the animal moves (26).
Because the estimated inertial force is negligible, the swimmer moves in a way such that net external force and torque are approximately zero. In this study, we consider all 3 df in a plane, namely, the forward (the only df in our previous RFT models), lateral, and yaw motion (“recoil”), and we determine the velocities of the 3 df by solving the force/torque balance equations at every instant of time. Because the motion of a point on the body is the superposition of the prescribed and center of mass (CoM) motions, the net external force,  , and net external torque about the CoM,
  , are functions of the CoM velocity
  and rotation rate about the CoM
  . For the CoM movement, Newton’s laws give
 |
where M is total mass and L is angular momentum. By setting the inertial terms on the right sides of these equations to zero, the CoM velocities ( and
and  ) can be numerically determined.
Torque Calculation in RFT.
Because inertia is negligible, the net torque due to the granular force on a portion (e.g.,  ) of the sandfish body about any point of interest
  is also approximately zero. From this, we calculate the internal torque (i.e., the torque generated by muscle) at
 :
:
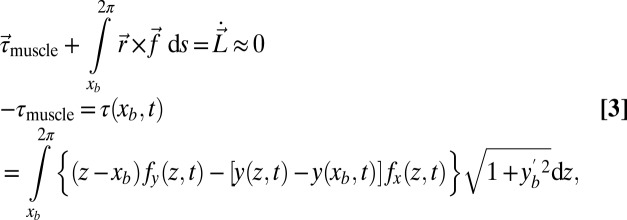 |
where  is the granular force per unit length. We assume the muscle must only overcome torque from resistive forces τ, thus, internal passive body forces are small compared with external resistive forces. This assumption was tested by performing in vivo bending tests on an anesthetized animal (Materials and Methods and Supporting Information) and measuring stiffness and damping coefficients at varying rotation rates; we estimate that the maximal torques from elastic (0.094 ± 0.027 N·cm) and damping (0.055 ± 0.034 N·cm) forces are over an order of magnitude smaller than the maximal torque from resistive forces (4.1 N·cm). We also assume the time lag between neural activation and muscle force development is small compared with the sandfish undulation period (≈0.5 s). We thus assume activation timing approximately corresponds to “muscle” torque timing. Therefore, we use the sign of τ to predict muscle activation (Figs. 2 and 3): Positive τ (or negative
  ) corresponds to muscle activation on the right side of the body.
Fig. 3.
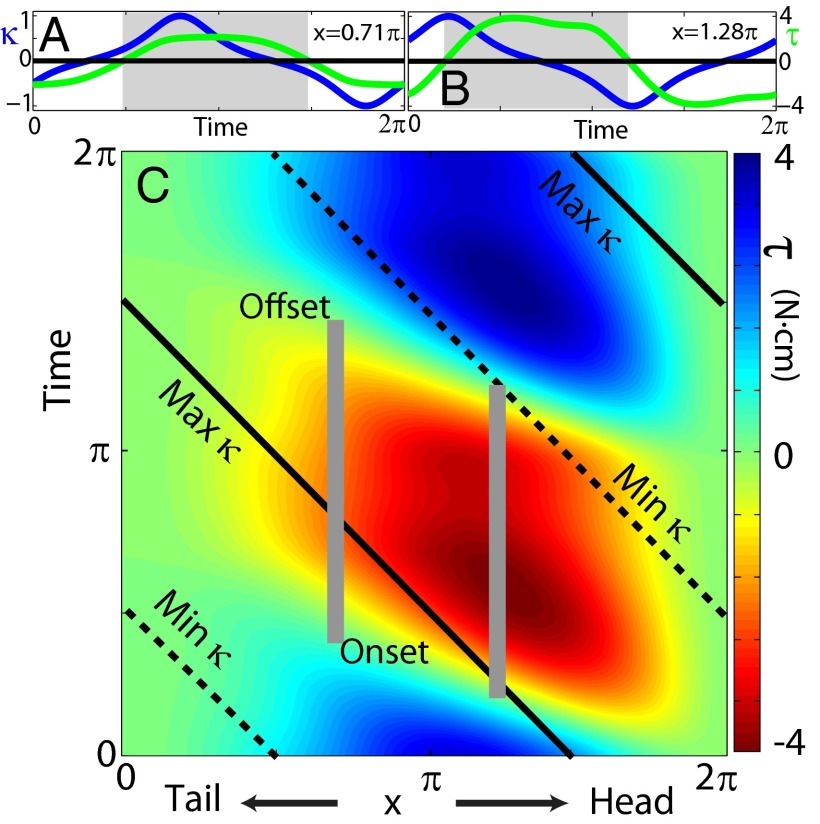
NPL in the model. (A and B) Curvature (blue lines), torque (green lines), and the predicted region of muscle activation (gray shaded region) from the RFT model at two representative points indicated by black dots in Fig. 2 and gray vertical lines in C. (C) Torque as a function of time and position along the body. Gray vertical bars indicate the predicted muscle activation durations at two representative points. Solid and dashed black lines represent the time when the maximal curvature and minimal curvature are reached, respectively.
Results and Discussion
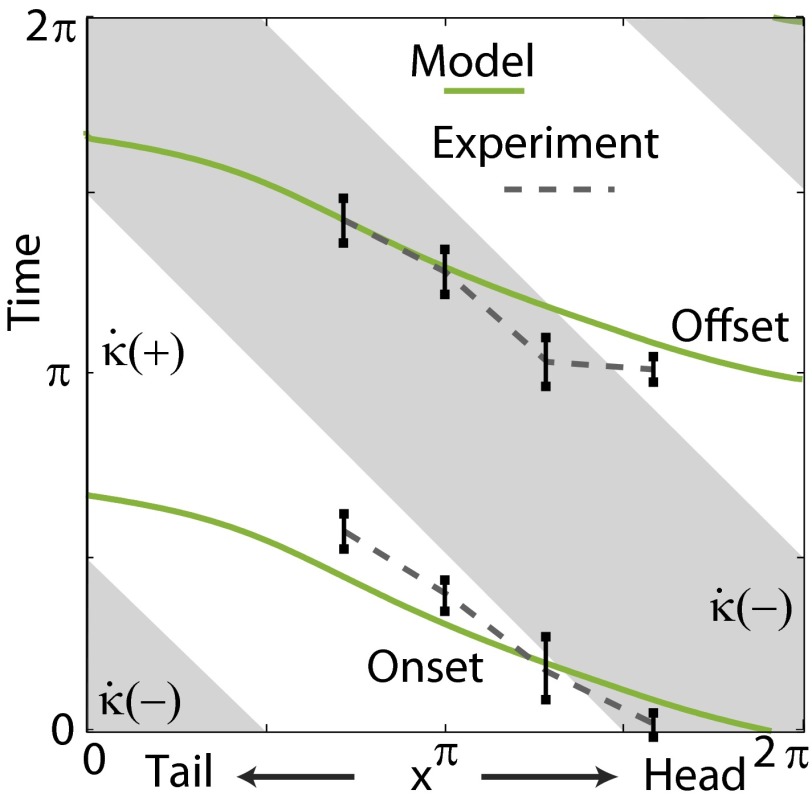
We find that phase lags between internal torque and curvature in the model can explain the NPL between the electromyogram (EMG) and curvature seen in experiments. A traveling wave pattern is displayed by τ, and positive τ occurs in a range close to that of measured EMG activation (Figs. 3 and 4). Without corrections from body passive forces or consideration of muscle physiology or body structure, the average phase difference between the beginning and ending of positive τ in the model compared with EMG onset and offset in experiments is less than 5%, where 2π is the range of possible phase lags (Supporting Information). A large portion of the positive torque region overlaps with the region in which the curvature decreases (negative  ), but the positive τ region lags behind the negative
  region near the head and leads it near the tail. The agreement between experiment and theory is striking, particularly because our model has no fitting parameters; we posit this is largely a consequence of the simple movement and the relatively simple but strong environmental interaction.
Fig. 4.
Predicted onset and offset of muscle activation from the model (green lines) compared with EMG measurements from the sandfish experiment [black error bars indicate SD; dashed gray lines are given as guides to the eye; adapted from the study by Sharpe et al. (26)]. Gray areas indicate the periods of negative  .
.  , and the model sandfish body is oriented at a downward entry angle of 22° relative to the horizontal. The corresponding positions of the electrodes in the model are approximated based on the curvature phases.
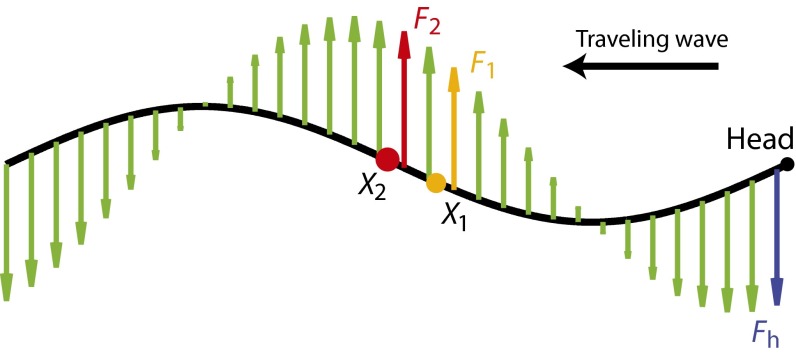
To gain more insight into how the phase lags arise due to torque contributions from different parts of the body, we consider a simplified case in which amplitude is small, forward motion is negligible, and the resistive force is viscous. This makes analytical calculation of torque straightforward but does not change the results qualitatively. In this simpler case, the torque from the fore-aft forces is negligible, and only the lateral force (per unit length),  , need be considered.
For simplicity and to separate the effects, we first neglect yaw motion. The torque can be calculated analytically from Eq. 3:  . For example, if we take two points
  and
and  near the middle of the body, we obtain
  and
and  , where
  . The NPL are still captured because the phase difference between
  and
and  is a fraction (0.29) of Δ, the phase difference between
  and
and  . The torque contribution can be approximately divided into three parts, as follows:
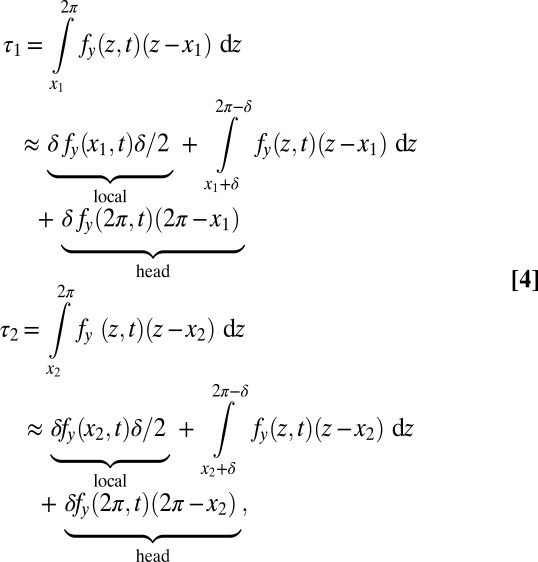 |
where δ is a small length. The phase difference between the torque contributions from local forces for the two points is Δ, which is the same as the phase difference of other local variables (e.g., κ) on the traveling wave (Fig. 5). In contrast, the phase of the torque transmitted from a distant point on the body (e.g., the head) is the same for both points (even though the magnitude differs). This synchronized torque contribution can be thought of as either a standing wave or a traveling wave with infinite speed. Because of the combination of the torques from local and distant forces and the continuous force distribution, the net phase difference between  and
and  is less than Δ and the torque wave speed is greater than the curvature wave speed. A similar analysis can be performed if the integration is done on the posterior side of the body (toward the tail).
Fig. 5.
Local and distant forces contribute to the torque on two points near the middle of the body. Green arrows represent the forces on the body. The red and orange arrows indicate the force adjacent to  and
and  , respectively. The blue arrow indicates the force at the head (Fh). Note that this is an analysis for a small-amplitude case, and the lateral displacement is exaggerated in the figure for visibility.
The balance of torque on the body leads to an overall yaw motion, whose phase is the same along the body. Superposition of yaw motion and lateral motion of the body results in variation of both the magnitude and phase of the lateral motion along the body in the laboratory frame (See figure and derivation in SI Text). However, the overall speed of the lateral displacement in the laboratory frame is the same as the prescribed lateral displacement (sinusoidal wave) in the body frame. Therefore, the yaw motion only changes the relative phase between the curvature wave and the apparent displacement (or force) wave locally.
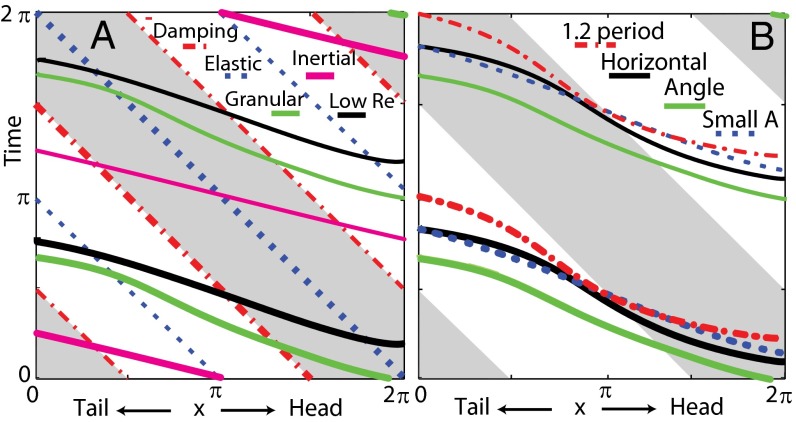
Because the only requirement for this mechanism is a traveling wave pattern of force, it predicts the NPL are general for torques from distributed forces. As shown in Fig. 6A, localized elastic and damping forces, by definition, have constant phase differences with the curvature. In accord with previous studies (28, 30), our calculations show that the relative phase between the torque from inertial forces and curvature advances in the posterior direction. However, the overall phase of the inertial torque advances by about 0.4π compared with the sandfish EMG phase. The phase lags persist if the granular resistive forces in the model are replaced with viscous resistive forces, which low Reynolds number swimmers like nematodes experience (13).
Fig. 6.
NPL for varying model parameters. (A) Starting (slightly thicker lines) and ending of positive torque generated by granular force (solid green lines), viscous fluid force (solid black lines), inertial force (solid magenta lines), damping force (dashed-dotted red lines), and elastic force from the body (dotted blue lines). (B) Beginning and ending of positive torque when the model sandfish swims in a horizontal plane (solid black line, control case), at an entry angle of 22° (solid green line), at a small amplitude  (dotted blue line), and with a 1.2 period of wave on its body (dashed-dotted red line). We aligned the head for the 1.2-period case, and only the anterior portion (1 period of the wave) is shown in the figure. Gray areas indicate negative
  .
.
Although passive body forces are not responsible for the NPL, they can still influence the observed pattern. For example, we find that the inclusion of viscous forces in the body shifts the phase of the torque in granular media toward the phase pattern produced from only viscous forces (dashed-dotted red lines in Fig. 6A); that is, the phase difference between the torque and  is smaller and the torque wave speed is smaller, in accord with previous studies in fluids (10, 29). This suggests that the small internal viscous forces within the body may partially account for the phase differences we observe between the torque from resistive forces and EMG. For swimming in a fluid with a high Reynolds number, the duration of muscle activation is generally smaller than that observed for the sandfish (≈0.5 s) (23). Previous studies (e.g., ref. 29) suggest that the torque from external forces may be overcome by passive elements of the body. The nearly 0.5 duty factor of the muscle is evidence that resistive forces dominate in a granular environment, and the slight decrease of the duty factor [a relatively larger decrease is typical during swimming in fluids (23)] implies passive forces play a small role in swimming of the sandfish.
Variations of locomotor kinematics also affect the timing of the torque (Fig. 6B). For example, a downward entry angle [observed in the animal experiments (26)] advances the phase of the torque compared with the horizontal swimming case. This occurs because when the body is oriented downward, the head, which has a more advanced phase, contributes more to the overall torque due to its greater depth and correspondingly larger resistive forces. Also, a larger number of periods (longer body and smaller ratio of wave length to body length) both delays the phase of torque and reduces the torque wave speed. The phase shift is due to the contribution of the extra tail length, where the phase of the force lags behind that at anterior positions. The effect of period (body length) can be used to estimate the error in timing that may occur due to neglecting the tail after 1.2 SVL: The error should be a small fraction of the difference between the 1.2-period case and the control case. Further, we found that a smaller undulation amplitude reduced the variation in torque wave speed.
The time delay between EMG activation and force production (36) might affect the phase lag timing of EMG activation, but we argue that this delay is small compared with the typical period of undulation for the sandfish (≈2-ms latency compared with ≈500-ms undulation period). If the time delay were significant and approximately constant, the EMG/curvature phase relation would change for different frequencies.
Conclusions
We developed a theory to explain the basic control signals needed to generate a particular undulatory movement pattern in a sand-swimming lizard. We abstracted the nervous/musculoskeletal system by assuming that passive body forces are small and that internal torque is synchronized with neural activation timing; this abstraction revealed that the NPL are intrinsic to undulatory locomotion, provided that distributed forces, such as resistive or inertial forces, play major roles. For undulatory locomotion in other environments, the principle of the simultaneous response to distant torques should also apply, although quantities, such as the phase of the force, will differ from the sandfish case. Building on this principle could help future studies explain other variations of the NPL.
Because we now have a system in which experiment and theory are in quantitative agreement, we can begin to develop more detailed models [i.e., anchors (27)] that answer specific questions about nervous system control, muscle configuration, and morphology, for example. As a case in point, it has been established that the intersegmental coordination of neural oscillators along the body of swimmers is influenced by sensory feedback (37). Detailed models of central pattern generators, sensory neurons, and muscles can be used to understand how external torque and neural activation interact so that the intersegmental phase lags produce single-period sinusoidal motion. As such, a hierarchy of anchors can be used to generate testable hypotheses and understand actuation timing for animals in a variety of environments.
More broadly, we have demonstrated that the seemingly specific and peculiar sand-swimming behavior could be an excellent system in which to develop quantitative models of neuromechanics. Due to relatively simple but dominant environmental interactions, the neuromechanical control pattern is greatly constrained by the environment. In addition, the granular RFT provides an excellent model for interaction with the substrate; this is in contrast to locomotion in true fluids, in which more complex theories (38) are needed to compare experiments and models quantitatively. We hypothesize that by studying subarenaceous animals within dry and saturated granular substrates (e.g., those on the bottom of the ocean floor), animal models with potentially fewer parameters can be analyzed in detail. This, in turn, can help provide guidance for the design and control of artificial undulatory locomotors in complex environments (39–41). Better physical models can also improve our understanding of the biological systems.
Materials and Methods
EMG Recordings.
Previous work (26) using a micro-CT scan of a single sandfish revealed 26 vertebrae in the trunk and more than 13 anterior caudal vertebrae in the tail. The iliocostalis musculature was targeted for implantation and is located on the dorsolateral portion of the trunk. Dissection revealed qualitatively similar muscle morphology to that described for Iguana iguana (42, 43), where iliocostalis musculature spanned ∼1 vertebrae.
Electrodes were implanted in one side of the body at 0.3 (magenta), 0.5 (green), 0.7 (blue), and 0.9 (yellow) SVLs (Fig. 1B), where the average SVL was 8.9 cm (n = 5 animals). EMG data used in this paper were taken from sandfish swimming trials (n = 37). The EMG signal was filtered with a second-order Chebyshev filter and rectified to facilitate EMG burst detection. A burst threshold was set equal to the mean of this rectified filtered EMG trace. Burst onset was defined as the time when the filtered EMG signal exceeded the threshold and afterward remained above it for a minimum of 0.04 s. EMG burst offset was defined as when the filtered EMG signal became lower than the threshold and remained below it for at least 0.08 s (44). This burst detection was necessary to exclude small voltage changes that did not constitute an EMG burst, such as noise due to movement artifact. More details on the EMG recording and analysis technique are provided elsewhere (26).
Dynamic Bending Tests.
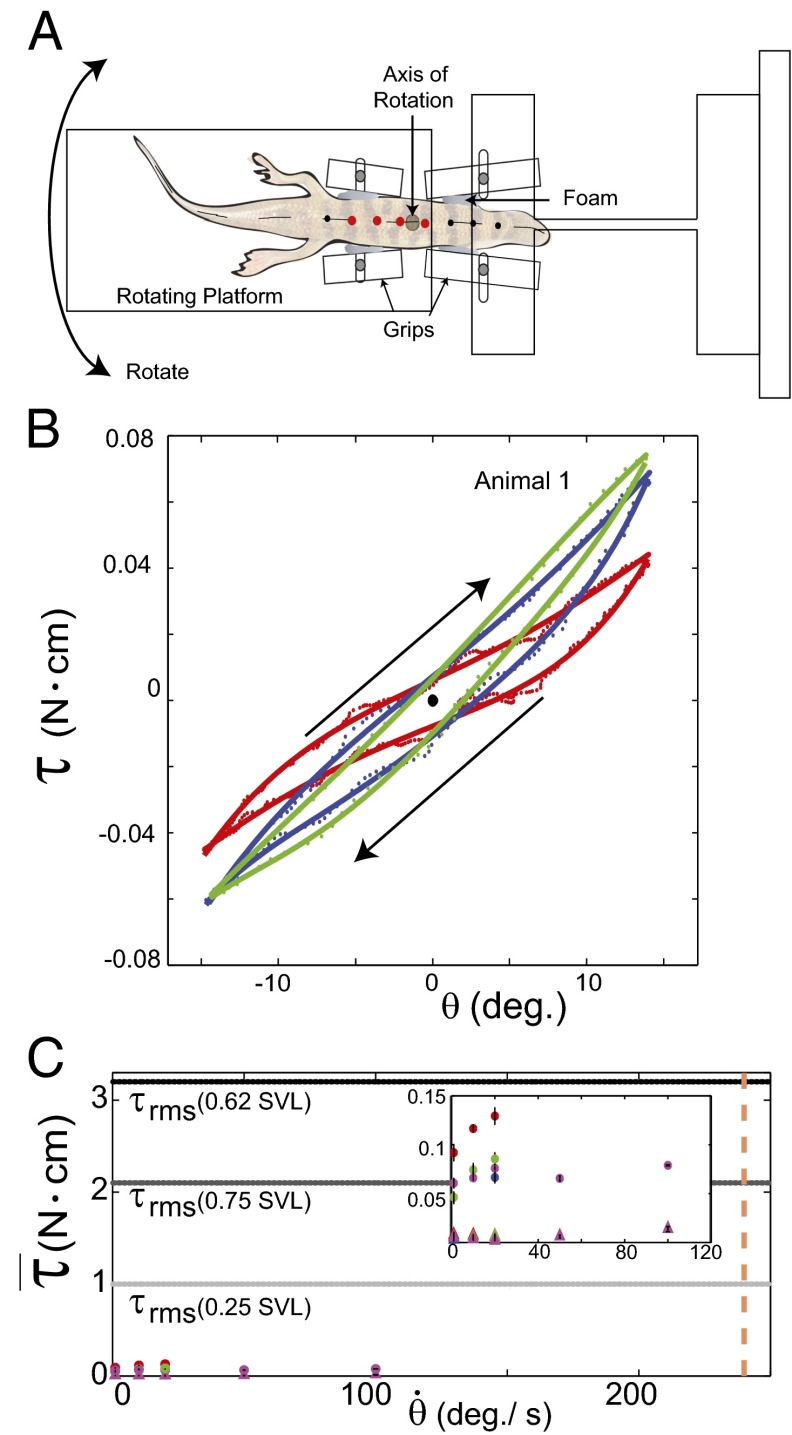
Three anesthetized sandfish (mass = 15, 16, and 25 g) were gently clamped at ∼0.5 SVL and 0.6 SVL (Fig. 7A) with adjustable grips. The grips were attached to a rigid platform and to a rotating platform, respectively. A motor rotated the anterior region of the sandfish through ±15° for three cycles at angular velocities of 1, 10, and 20°/s. The first and last half-cycles were excluded from the analysis due to varying rotation velocities. The anterior end of the sandfish was clamped to a platform with two strain gages (KFG-3-120-C1-11L1M2R; Omega) used to record resulting torques. Signals were amplified (INA125P; Digi-Key) by 5,000 before data acquisition and analyzed using custom software (LabVIEW; National Instruments). Black points were marked on the animal midline at increments of 0.1 SVL. The best-fit line through the markers circled in red was used to calculate the angle θ.
Fig. 7.
Experimental measurements of sandfish body elasticity and damping. (A) Top view of the setup. (B) Representative work loop for animal 1 with angular velocities of  (red),
  (blue), and
  (green). The direction is indicated by the arrows, where the angle is initially zero and increases to ≈0.26 rad (15°), decreases to ≈−0.26 rad (−15°), and then returns to zero. Work loops are shown for constant angular velocity (i.e., the system has reached a steady state). Dotted trajectories represent the experimentally recorded torque; solid curves are the best polynomial fits. (C) Estimated average torque using calculated elastic (circles) and damping (triangles) coefficients is compared with the maximum
  due to external forces calculated from discrete element simulation (34) [0.62 body length (BL); dashed horizontal black line]. Average
  values for 0.25 BL (light gray dashed line) and 0.75 BL (dark gray dashed line) are also shown. For animal 1 (red), animal 2 (blue), and animal 3 (green), coefficients were measured for 1, 10, and 20°/s. In animal 4 (magenta), coefficients were measured for 1, 10, 20, 50, and 100°/s. The average angular speed of a sandfish segment is 240°/s (dashed vertical orange line). (Inset) Zoomed-in region of data in the main figure (units are the same).
Body stiffness, K, was estimated using the slope of the best-fit line through the torque-angular displacement curve (Fig. 7B) for a single cycle (n = 8 trials each). Using a viscoelastic model (or Voigt model), the viscous damping coefficient, c, was approximated by quantifying the viscous torque ( ) at zero angular displacement during steady-state rotation and dividing by the angular speed (
 ), (i.e.,
  ).
).
For the hysteretic damping model, the structural damping coefficient, h, was proportional to angular displacement, θ, and  out-phase. The value of h was estimated by finding the torque at zero displacement during steady-state rotation and dividing by the maximum angular displacement:
  . The loss factor was calculated as η=h/K. The area contained within the work loop
  was determined using polynomial fits to the torque vs. angle curves for increasing and decreasing angles.
To interrogate stiffness and damping coefficients at higher speeds, we repeated the experiment with one of the sandfish (animal 2; Supporting Information) using angular speeds of 1, 10, 20, 50, and 100°/s and compared the results of this experiment with previous results.
We substituted the values during sand-swimming (angular excursion of 30° and angular velocity of 240°/s) and the average calculated K and c at 20°/s into our viscous damping model to estimate torques during sand-swimming (Fig. 7C and Supporting Information). For hysteretic damping, we estimated the damping torque at 240°/s by extending the trend line between calculated torque from hysteretic damping and angular speed between 20 and 100°/s.
Pendulum Swing Tests.
In the second technique, sandfish were modeled as a physical pendulum to estimate K, c, and η at higher angular frequencies. The same sandfish were used as in the previous experiment. Animals were oriented vertically and clamped at ∼0.5 SVL. The tail of the sandfish was bent upward and released, allowing the body to swing freely. The sandfish body was modeled as a rigid cylinder, and the tail was modeled as a cone with uniform density. The angular motion, θ, was fit to a damped harmonic oscillator:
where  is the distance from the point of rotation to the center of mass, m is the mass of the unclamped portion of the sandfish, I is the moment of inertia, and
  is the angular acceleration. Angular motion during the first half-cycle after the tail was released was neglected due to large angles and body bending. The value of θ was determined between the 0.5-SVL and 0.8-SVL body positions.
We also fit the motion using a hysteretic damping model:
For both models, we used the small-angle approximation  . Best-fit parameters were determined using minimization techniques (MATLAB; MathWorks). Both viscous and hysteretic models fit the angular displacement trajectory well
  . Experimental setup diagrams and detailed results are provided in Supporting Information.
Supplementary Material
Acknowledgments
We thank Paul B. Umbanhowar, Silas Alben, George Lauder, Tom Daniel, and Robert J. Full for helpful discussions and Humaira Taz for assistance with construction of the experimental apparatus. We thank Elizabeth A. Gozal for providing the EMG analysis code (Spinal Motor Output Detector). This work was supported by National Science Foundation Physics of Living Systems Grants PHY-0749991 and PHY-1150760, Army Research Laboratory Micro Autonomous System Technologies Collective Technology Alliance W911NF-11-1-0514, Army Research Office Grant W911NF-11-1-0514, and the Burroughs Wellcome Fund.
Footnotes
The authors declare no conflict of interest.
This article is a PNAS Direct Submission.
This article contains supporting information online at www.pnas.org/lookup/suppl/doi:10.1073/pnas.1302844110/-/DCSupplemental.
References
- 1.Holmes P, Full RJ, Koditschek D, Guckenheimer J. The dynamics of legged locomotion: Models, analyses, and challenges. SIAM Rev Soc Ind Appl Math. 2006;48(2):207–304. [Google Scholar]
- 2.Ijspeert AJ. Central pattern generators for locomotion control in animals and robots: A review. Neural Netw. 2008;21(4):642–653. doi: 10.1016/j.neunet.2008.03.014. [DOI] [PubMed] [Google Scholar]
- 3.Alexander RM. Principles of Animal Locomotion. Princeton: Princeton Univ Press; 2003. [Google Scholar]
- 4.Nishikawa K, et al. Neuromechanics: An integrative approach for understanding motor control. Integr Comp Biol. 2007;47(1):16–54. doi: 10.1093/icb/icm024. [DOI] [PubMed] [Google Scholar]
- 5.Orlovsky GN, Deliagina T, Grillner S, Orlovskii G, Grillner S. Neuronal Control of Locomotion: From Mollusc to Man. New York: Oxford Univ Press; 1999. [Google Scholar]
- 6.Josephson R. The mechanical power output of a tettigoniid wing muscle during singing and flight. J Exp Biol. 1985;117:357–368. [Google Scholar]
- 7.Hof AL. EMG and muscle force: An introduction. Hum Mov Sci. 1984;3:119–153. [Google Scholar]
- 8.Tytell ED, Holmes P, Cohen AH. Spikes alone do not behavior make: Why neuroscience needs biomechanics. Curr Opin Neurobiol. 2011;21(5):816–822. doi: 10.1016/j.conb.2011.05.017. [DOI] [PMC free article] [PubMed] [Google Scholar]
- 9.Chiel HJ, Ting LH, Ekeberg Ö, Hartmann MJ. The brain in its body: Motor control and sensing in a biomechanical context. J Neurosci. 2009;29(41):12807–12814. doi: 10.1523/JNEUROSCI.3338-09.2009. [DOI] [PMC free article] [PubMed] [Google Scholar]
- 10.Tytell ED, Hsu CY, Williams TL, Cohen AH, Fauci LJ. Interactions between internal forces, body stiffness, and fluid environment in a neuromechanical model of lamprey swimming. Proc Natl Acad Sci USA. 2010;107(46):19832–19837. doi: 10.1073/pnas.1011564107. [DOI] [PMC free article] [PubMed] [Google Scholar]
- 11.Dickinson MH, et al. How animals move: An integrative view. Science. 2000;288(5463):100–106. doi: 10.1126/science.288.5463.100. [DOI] [PubMed] [Google Scholar]
- 12.Schmitt J, Holmes P. Mechanical models for insect locomotion: Dynamics and stability in the horizontal plane-II. Application. Biol Cybern. 2000;83(6):517–527. doi: 10.1007/s004220000180. [DOI] [PubMed] [Google Scholar]
- 13.Cohen N, Boyle J. Swimming at low Reynolds number: A beginners guide to undulatory locomotion. Contemporary Physics. 2010;51(2):103–123. [Google Scholar]
- 14.Gray J, Hancock G. The propulsion of sea-urchin spermatozoa. J Exp Biol. 1955;32:802–814. [Google Scholar]
- 15.Hu DL, Nirody J, Scott T, Shelley MJ. The mechanics of slithering locomotion. Proc Natl Acad Sci USA. 2009;106(25):10081–10085. doi: 10.1073/pnas.0812533106. [DOI] [PMC free article] [PubMed] [Google Scholar]
- 16.Lauder B, Lauder G. Speed effects on midline kinematics during steady undulatory swimming of largemouth bass, Micropterus salmoides. J Exp Biol. 1995;198(Pt 2):585–602. doi: 10.1242/jeb.198.2.585. [DOI] [PubMed] [Google Scholar]
- 17.Sfakiotakis M, Lane D, Davies J. Review of fish swimming modes for aquatic locomotion. IEEE Journal of Oceanic Engineering. 1999;24(2):237–252. [Google Scholar]
- 18.Maladen RD, Ding Y, Li C, Goldman DI. Undulatory swimming in sand: Subsurface locomotion of the sandfish lizard. Science. 2009;325(5938):314–318. doi: 10.1126/science.1172490. [DOI] [PubMed] [Google Scholar]
- 19.Wright C, et al. Proceedings of the IEEE International Conference on Intelligent Robots and Systems (IEEE) (San Diego), 2007. Design of a modular snake robot; pp. 2609–2614. [Google Scholar]
- 20.Crespi A, Ijspeert A. Online optimization of swimming and crawling in an amphibious snake robot. IEEE Transactions on Robotics. 2008;24(1):75–87. [Google Scholar]
- 21.Choset H, et al. Design and motion planning for serpentine robots. Proc SPIE. 2000;3990:148–155. [Google Scholar]
- 22.Jayne B, Lauder G. Red muscle motor patterns during steady swimming in largemouth bass: Effects of speed and correlations with axial kinematics. J Exp Biol. 1995;198(Pt 7):1575–1587. doi: 10.1242/jeb.198.7.1575. [DOI] [PubMed] [Google Scholar]
- 23.Wardle C, Videler J, Altringham J. Tuning in to fish swimming waves: Body form, swimming mode and muscle function. J Exp Biol. 1995;198(Pt 8):1629–1636. doi: 10.1242/jeb.198.8.1629. [DOI] [PubMed] [Google Scholar]
- 24.Gillis G. Environmental effects on undulatory locomotion in the American eel Anguilla rostrata: Kinematics in water and on land. J Exp Biol. 1998;201:949–961. [Google Scholar]
- 25.Williams L, et al. Locomotion in lamprey and trout: The relative timing of activation and movement. J Exp Biol. 1989;143:559–566. [Google Scholar]
- 26.Sharpe SS, Ding Y, Goldman DI. Environmental interaction influences muscle activation strategy during sand-swimming in the sandfish lizard Scincus scincus. J Exp Biol. 2013;216(Pt 2):260–274. doi: 10.1242/jeb.070482. [DOI] [PubMed] [Google Scholar]
- 27.Full RJ, Koditschek DE. Templates and anchors: Neuromechanical hypotheses of legged locomotion on land. J Exp Biol. 1999;202(Pt 23):3325–3332. doi: 10.1242/jeb.202.23.3325. [DOI] [PubMed] [Google Scholar]
- 28.McMillen T, Williams T, Holmes P. Nonlinear muscles, passive viscoelasticity and body taper conspire to create neuromechanical phase lags in anguilliform swimmers. PLOS Comput Biol. 2008;4(8):e1000157. doi: 10.1371/journal.pcbi.1000157. [DOI] [PMC free article] [PubMed] [Google Scholar]
- 29.Cheng J, Pedley T, Altringham J. A continuous dynamic beam model for swimming fish. Philos Trans R Soc Lond B Biol Sci. 1998;353(1371):981–997. [Google Scholar]
- 30.Bowtell G, Williams T. Anguilliform body dynamics: Modelling the interaction between muscle activation and body curvature. Philos Trans R Soc Lond B Biol Sci. 1991;334(1271):385–390. [Google Scholar]
- 31.Chen J, Friesen WO, Iwasaki T. Mechanisms underlying rhythmic locomotion: Body-fluid interaction in undulatory swimming. J Exp Biol. 2011;214(Pt 4):561–574. doi: 10.1242/jeb.048751. [DOI] [PMC free article] [PubMed] [Google Scholar]
- 32.Pedley TJ, Hill SJ. Large-amplitude undulatory fish swimming: Fluid mechanics coupled to internal mechanics. J Exp Biol. 1999;202(Pt 23):3431–3438. doi: 10.1242/jeb.202.23.3431. [DOI] [PubMed] [Google Scholar]
- 33.Fang-Yen C, et al. Biomechanical analysis of gait adaptation in the nematode Caenorhabditis elegans. Proc Natl Acad Sci USA. 2010;107(47):20323–20328. doi: 10.1073/pnas.1003016107. [DOI] [PMC free article] [PubMed] [Google Scholar]
- 34.Ding Y, Sharpe SS, Masse A, Goldman DI. Mechanics of undulatory swimming in a frictional fluid. PLOS Comput Biol. 2012;8(12):e1002810. doi: 10.1371/journal.pcbi.1002810. [DOI] [PMC free article] [PubMed] [Google Scholar]
- 35.Maladen RD, Ding Y, Umbanhowar PB, Kamor A, Goldman DI. Mechanical models of sandfish locomotion reveal principles of high performance subsurface sand-swimming. J R Soc Interface. 2011;8(62):1332–1345. doi: 10.1098/rsif.2010.0678. [DOI] [PMC free article] [PubMed] [Google Scholar]
- 36.Daley MA, Biewener AA. Muscle force-length dynamics during level versus incline locomotion: A comparison of in vivo performance of two guinea fowl ankle extensors. J Exp Biol. 2003;206(Pt 17):2941–2958. doi: 10.1242/jeb.00503. [DOI] [PubMed] [Google Scholar]
- 37.Marder E, Bucher D, Schulz DJ, Taylor AL. Invertebrate central pattern generation moves along. Curr Biol. 2005;15(17):R685–R699. doi: 10.1016/j.cub.2005.08.022. [DOI] [PubMed] [Google Scholar]
- 38.Rodenborn B, Chen CH, Swinney HL, Liu B, Zhang HP. Propulsion of microorganisms by a helical flagellum. Proc Natl Acad Sci USA. 2013;110(5):E338–E347. doi: 10.1073/pnas.1219831110. [DOI] [PMC free article] [PubMed] [Google Scholar]
- 39.Hirose S. Oxford Univ Press, Oxford; 1993. Biologically inspired robots: Snake-like locomotors and manipulators. [Google Scholar]
- 40.Roper D, Sharma S, Sutton R, Culverhouse P. A review of developments towards biologically inspired propulsion systems for autonomous underwater vehicles. Proceedings of the Institution of Mechanical Engineers, Part M: Journal of Engineering for the Maritime Environment. 2011;225(2):77–96. [Google Scholar]
- 41.Colgate J, Lynch K. Mechanics and control of swimming: A review. IEEE Journal of Oceanic Engineering. 2004;29(3):660–673. [Google Scholar]
- 42.Carrier D. Activity of the hypaxial muscles during walking in the lizard Iguana iguana. J Exp Biol. 1990;152:453–470. doi: 10.1242/jeb.152.1.453. [DOI] [PubMed] [Google Scholar]
- 43.Ritter D. Axial muscle function during lizard locomotion. J Exp Biol. 1996;199(Pt 11):2499–2510. doi: 10.1242/jeb.199.11.2499. [DOI] [PubMed] [Google Scholar]
- 44.Hochman S, et al. Enabling techniques for in vitro studies on mammalian spinal locomotor mechanisms. Front Biosci. 2012;17:2158–2180. doi: 10.2741/4043. [DOI] [PMC free article] [PubMed] [Google Scholar]
Associated Data
This section collects any data citations, data availability statements, or supplementary materials included in this article.


