

Significance
While genomes are being sequenced at an accelerating pace, the elucidation of the function of human genes and their interactions remains a formidable challenge. Genetic interaction maps, which report on how genes work together, provide a powerful tool for systematically defining gene function and pathways. Here we present the complete quantitative framework underlying our recently developed approach for systematic mapping of genetic interactions in mammalian cells and demonstrate its broad potential. Maps obtained in different cell types and treatment conditions dissect context-dependent pathways. Our approach can provide a rational basis for defining combination therapies by targeting genes with strong genetic interactions.
Keywords: epistasis, RNA interference, synthetic lethality, functional genomics, human genome
Abstract
A major challenge of the postgenomic era is to understand how human genes function together in normal and disease states. In microorganisms, high-density genetic interaction (GI) maps are a powerful tool to elucidate gene functions and pathways. We have developed an integrated methodology based on pooled shRNA screening in mammalian cells for genome-wide identification of genes with relevant phenotypes and systematic mapping of all GIs among them. We recently demonstrated the potential of this approach in an application to pathways controlling the susceptibility of human cells to the toxin ricin. Here we present the complete quantitative framework underlying our strategy, including experimental design, derivation of quantitative phenotypes from pooled screens, robust identification of hit genes using ultra-complex shRNA libraries, parallel measurement of tens of thousands of GIs from a single double-shRNA experiment, and construction of GI maps. We describe the general applicability of our strategy. Our pooled approach enables rapid screening of the same shRNA library in different cell lines and under different conditions to determine a range of different phenotypes. We illustrate this strategy here for single- and double-shRNA libraries. We compare the roles of genes for susceptibility to ricin and Shiga toxin in different human cell lines and reveal both toxin-specific and cell line-specific pathways. We also present GI maps based on growth and ricin-resistance phenotypes, and we demonstrate how such a comparative GI mapping strategy enables functional dissection of physical complexes and context-dependent pathways.
The first human genome sequence was determined more than 10 years ago (1, 2), and the revolution in sequencing technology has facilitated the deciphering of hundreds more human and cancer genomes since then (3, 4). The next frontier is the development of strategies for the systematic elucidation of gene function in health and disease contexts.
RNAi technology has facilitated genetic approaches in mammalian cells, but the analysis of genome-wide RNAi screens remains challenging (5). Major confounding factors are false-negative results caused by insufficiently active shRNAs and false-positive results caused by off-target effects. Indeed, the challenges of off-target effects have been highlighted recently in papers by Schultz et al (6) and Adamson et al. (7), which show that these effects can be pervasive in genome-wide screens and are not robustly detected by some of the standard precautions typically used.
Furthermore, even when hit genes are identified correctly, effective follow-up to uncover their function often requires intense effort. In yeast and other microorganisms, high-density genetic interaction (GI) maps have been highly successful at defining gene function, revealing functional relationships between previously uncharacterized genes and elucidating cellular pathways (8–16). GIs quantify the effect that the loss of function of one gene has on the phenotype caused by the loss of function of another gene. In GI maps, GIs are determined for a large number of pairwise combinations of genes, and genes are clustered based on the similarity of their GI patterns. The clustering typically reveals groups of genes that encode physically interacting proteins or act in a common pathway (17).
In human cells, such a systematic elucidation of the functional interactions between human genes will be key to understanding how combinations of genes cause common polygenetic diseases and to developing precise therapies based on a patient’s genetic background. Additionally, GI maps can detect rare synthetic lethal gene pairs, which would be ideal drug targets for combination therapies that prevent the development of drug resistance of rapidly evolving diseases like cancer.
We recently established a technology platform for constructing high-density GI maps in mammalian cells based on pooled shRNA screens and demonstrated its potential by using it to identify pathways controlling the sensitivity of human cells to the toxin ricin (18). Our two-step strategy integrates several key innovations to address the challenges to the effective application of RNAi-based approaches to study gene function in mammalian systems. A primary genome-wide screen is conducted using an ultra-complex shRNA library to identify genes of interest. A double-shRNA library targeting all pairwise combinations of hit genes from the primary screen then is used to measure genetic interactions based on a pooled experiment.
Here, we describe a principled framework for collecting and analyzing data and illustrate the broad potential of our approach. We extract different quantitative, shRNA-intrinsic phenotypes, such as growth or drug sensitivity, from pooled screens. We establish a strategy for robust identification of hit genes in primary screens. Individual shRNAs targeting these hit genes are selected to construct focused single-shRNA and double-shRNA libraries. We demonstrate the use of focused libraries to compare pathways controlling sensitivity of different human cell lines to ricin and Shiga toxin. We describe our strategy for constructing a high-density GI map based on pooled screening of a double-shRNA library. We show how shRNAs with partial off-target effects can be identified and removed from GI maps. GI maps can be constructed based on different quantitative phenotypes. As described in Discussion, our strategy has several features that distinguish it from array-based approaches in which individual combinations of genes are targeted by interfering RNAs in separate wells (19(–21). Importantly, the same double-shRNA library can be screened rapidly for different phenotypes to compare context-specific GI maps. We compare a growth-based GI map and a ricin resistance-based GI map to illustrate how this strategy facilitates the dissection of functional pathways in different conditions and cellular states.
Results
Integrated Platform for Genome-Wide Screening and Mapping of Genetic Interactions.
We have developed an integrated suite of experimental and computational approaches to identify genes of interest robustly using pooled shRNA-based screens in mammalian cells and to map genetic interactions between these genes systematically to uncover functional relationships. This section and Fig. 1 give an overview of our multistep strategy; the subsequent sections provide the rationale, describe the details, and demonstrate the performance of the individual steps.
Fig. 1.

Overview of the technology platform. (A) Primary screen. (B) Focused shRNA library targeting hit genes from the primary screen. (C) Double shRNA screen and Genetic Interaction (GI) maps.
First, we conduct a primary genome-wide screen (Fig. 1A) using an ultra-complex shRNA library. Our current shRNA library targets each human protein-coding gene with ∼25 independent shRNAs and includes a large number (>1,000) of negative-control shRNAs (18). The library is introduced into mammalian cells via lentiviral infection at a low multiplicity of infection (∼0.3). A fraction of this infected cell population is subjected to selection for a phenotype of interest. Depending on the biological question, this selection can consist simply of a period of growth under standard conditions or growth in the presence of a drug, toxin, or other selective pressure. Any method that physically isolates or enriches cells based on a phenotype of interest, such as selection for cell migration, cell size, or expression of a reporter gene by fluorescence-activated cell sorting and other technologies, also can be used. The frequencies of shRNA-encoding cassettes in the selected population and an unselected control population are determined by deep sequencing. From these data, hit genes and shRNAs that effectively target them are identified.
Next, individually barcoded lentiviral vectors for expression of the shRNAs selected from the primary screen are constructed (Fig. 1B). These vectors are pooled for batch retesting of the shRNA phenotypes and can also be used to compare the role of the targeted genes in different cell lines or with different selective pressures.
Finally, the barcoded shRNA vectors are digested and ligated in a pooled format to generate a library expressing all pairwise combinations of double-shRNAs (Fig. 1C). The phenotypes of these double-shRNAs are measured in a pooled screen, and from these phenotypes, GIs are calculated. GI patterns of shRNAs targeting the same gene then are averaged, and genes are clustered based on their GI pattern to obtain a high-density GI map. The same double-shRNA library can be screened for different phenotypes or in different cell lines to generate a set of GI maps. Comparison of these GI maps reveals condition- and background-specific GIs and pathways.
Quantitative shRNA Phenotypes from Pooled shRNA Screens.
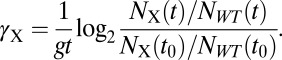
Detection of hits in primary screens and construction of GI maps requires a method for inferring underlying quantitative phenotypes based on behavior in pooled growth experiments. We developed a principled framework to derive distinct phenotypes that reflect shRNA-intrinsic effects from pooled shRNA screens. The simplest experimental design for a pooled screen is a growth-based screen in which the frequencies of knockdown cells are compared between the starting time point (t0) and a later time point in the screen (t). If cells are maintained in exponential growth phase throughout the screen, and g is the growth rate of WT cells, we define the effect of an shRNA X such that cells expressing this shRNA have a growth rate of (1+ γX)g (Fig. 2A). Thus, positive γX represents an increase in fitness, whereas negative γX represents a decrease in fitness (Fig. 2B). γX can be calculated from the shRNA frequencies determined by deep sequencing and the observed growth parameters of the bulk cell population (Methods). The γ values calculated in this way are highly reproducible between independent screens (Fig. 2C), thus facilitating direct comparison and averaging of data from screens that were carried out separately. It also is possible to compare samples taken at different time points (t1, t2, and so forth) to ensure that enrichment of certain shRNAs was caused by consistently higher growth rates rather than by rare jackpot effects (Fig. 2D).
Fig. 2.

Quantitative framework for quantitative phenotypes from pooled screens. (A) Illustration of exponential growth of WT cells (black) and cells expressing an shRNA X (orange) under standard conditions (unselected population, solid lines) or selective pressure (selected population, dashed lines). shRNA X affects the growth rate g for unselected cells by a factor (1 + γX) and the selective pressure k by a factor (1 – ρX). (B) Illustration of the biological meaning of the quantitative phenotypes γ and ρ. (C–E) Agreement between shRNA phenotypes. Gray lines: WT phenotype. (C) K562 cell growth γs from two independent experimental replicates. (D) K562 cell ricin resistance ρs determined at different time points of the same experiment. (E) K562 cell ricin resistance ρs from experiments with slightly different doses of ricin.
Many genetic screens address the growth of cells in the presence of a specific selective pressure, k, that inhibits the net growth of WT cells, resulting in a diminished net growth rate, g – k (Fig. 2A). We define the resistance phenotype ρ of an shRNA such that the growth rate of cells expressing shRNA X in the presence of selective pressure is (1 + γX)g – (1− ρX)k (Fig. 2A). Full resistance corresponds to ρX = 1, partial resistance to 0 < ρX < 1, and sensitization to ρX < 0 (Fig. 2B). To determine ρX, frequencies of cells expressing shRNAs are compared in unselected and selected populations (Methods).
When the selection experiment is designed, the selective pressure should be titrated in preliminary experiments to obtain a desired value of k. Larger selective pressures will enhance the differential changes in cell frequencies. However, if the selective pressure is so large that the population size decreases dramatically, this population bottleneck will increase Poisson noise for the frequency measurements and will increase the likelihood of losing some species completely. We obtained good results with k/g around 0.5 over a time corresponding to 8–12 doublings of WT cells in standard conditions.
Experiments with modest differences in levels of selective pressure show good reproducibility of ρ values in our hands (Fig. 2E), again allowing averaging of data from independent screens. Very divergent levels of selective pressure, such as very different concentrations of a drug or toxin, may interact with different cellular pathways, and thus ρ values from experiments are not necessarily comparable across a wide range of selective pressures.
Some biological problems, such as the drug treatment of a cancer cell line that is resistant to this drug, require k ∼ 0, with the goal of recovering shRNAs that resensitize the cells to the drug. Definitions of quantitative phenotypes for this case and for sorting-based screens are given in Methods.
Identification of Hit Genes from the Primary Screen.
To address the problems of false-positive and false-negative results in genome-wide RNAi screens, we created an ultra-complex library that targets each human protein-coding gene with ∼25 independent shRNAs and contains a large set (>1,000) of negative-control shRNAs (18). Qualitatively, the reasoning behind the use of such libraries is that the large number of shRNAs targeting each gene increases the likelihood of including several effective shRNAs, which should reduce the false-negative rate. Requiring several independent shRNAs targeting a gene to cause the phenotype of interest to call the target gene a hit gene should reduce the false-positive rate caused by off-target effects.
We reasoned that analysis of screening data based on hard cut-offs for shRNA phenotypes and numbers of active shRNAs per gene would discard much of the information contained in the rich dataset. Instead, statistical evaluation of the phenotype distribution of all shRNAs targeting a given gene uses all available information to evaluate whether the gene is a hit. This concept also underlies the RIGER approach (22). However, RIGER compares shRNAs targeting a gene of interest with the entire set of shRNAs targeting all genes, whereas an important innovation in our strategy is the comparison of the shRNAs targeting each gene with the negative control shRNAs (Fig. 3A). The large set of negative control shRNAs provides the appropriate “null distribution” by controlling for both the measurement noise and unintended off-target effects.
Fig. 3.

Robust identification of hit genes from primary screens with an ultra-complex shRNA library. (A) Our current ultra-complex shRNA library targets each human protein-coding gene with ∼25 shRNAs and also contains >1,000 negative-control shRNAs not targeting any human transcript. To detect hits in the primary screen, P values for each gene were calculated using the MW test by comparing phenotypes of shRNAs targeting each gene with the phenotypes of negative-control shRNAs. (B) A ricin resistance screen was carried out in K562 cells with a test library targeting 1,079 genes with 50 shRNAs each. For analysis, the shRNAs targeting each gene were divided randomly into two groups of 25 shRNAs; P values for each gene were calculated based on these half-libraries and are plotted here. Genes were called hits for an FDR < 5% (gray lines). The overlap in called hits based on the two half-libraries is highly significant (P = 6 × 10⁻²⁸, Fisher’s exact test).
We compared two statistical tests that derive a P value for each gene: The Mann–Whitney U test (MW test) and the two-sample Kolmogorov–Smirnov test (KS test) generally yielded very similar answers (Fig. S1A), with a few exceptions (Fig. S1 B and C). In our experience, the MW test performed more robustly with noisy datasets, and therefore we generally used the MW test.
The use of negative controls for statistical testing increased the sensitivity of hit detection, as illustrated in Fig. S1D: Based on a ricin resistance screen in K562 cells, the P value for a given gene was calculated by comparing shRNAs targeting the gene either with negative control shRNAs or with the distribution of all shRNAs in the library. When negative controls were used, more hits were significant at a false discovery rate (FDR) of 5%. To obtain robust results, we estimate that ∼200 or more negative control shRNAs are ideal (Fig. S1E).
To test the robustness of our approach for hit identification, we conducted a ricin resistance screen using an shRNA library targeting 1,079 genes each with 50 independent shRNAs and randomly divided the shRNAs targeting each gene into two “half-libraries.” P values for each gene were calculated separately based on the results of each half-library (Fig. 3B). Genes were called hits for a false-discovery rate (FDR) <5%. The overlap in called hits (at an FDR rate below 5%) was highly significant (P = 6 ×10⁻²⁸, Fisher’s exact test for the example shown in Fig. 3B; similar values were obtained in other random divisions of the test library into half-libraries, as shown in Fig. S1F). Our ultra-complex shRNA library also yielded robust results when hits were called based on the RIGER algorithm in its original version (based on the KS test) (Table S1 and Fig. S1G). Our approach is validated further by the results obtained in our pilot genome-wide screen for genes affecting ricin susceptibility, which identified a wide range of protective and sensitizing hit genes with remarkable specificity and sensitivity (18).
Barcoding of Individual shRNAs and Comparative Screening of Focused Libraries.
After the genome-wide primary screen, the next step in our strategy is the selection of shRNAs targeting hit genes for further characterization and inclusion in a double-shRNA library. The selected shRNAs are individually cloned into the barcoded vectors pMK1098 or pMK1200 (Fig. 4A and Methods) and are pooled, and their phenotypes are confirmed in a batch retest experiment. The resulting focused library also can be screened for different phenotypes and in different cell lines. To illustrate this strategy, we determined resistance phenotypes for ricin in K562, HeLa, and Raji cells and for Shiga toxin in HeLa and Raji cells. (K562 cells are not Shiga toxin-sensitive because they lack the cell-surface receptor CD77.) These experiments were carried out in replicate, using two or more shRNAs per gene, and gene-based phenotypes were determined either by averaging ρs for shRNAs targeting a gene (Fig. S2) or by calculating one-sample t values representing the confidence that ρs for shRNAs targeting a gene from both experimental replicates were different from 0 (Fig. 4B). Phenotype patterns across experiments were correlated for functionally related and physically interacting genes. Although many gene knockdowns were either protective or sensitizing in all experiments, the results also suggest both toxin-specific pathways (ARL1 and YIPF5 knockdown sensitizes to ricin but protects from Shiga toxin; the p24 proteins TMED2 and TMED10, as well as the COPII components SEC23B and SAR1A, show the opposite pattern) and more complicated patterns, depending on both the toxin and the cell line (as for the COPI complex).
Fig. 4.

Cloning of hit shRNAs for focused comparative screens and construction of double-shRNA libraries. (A) shRNAs selected from the primary screen are cloned individually into a minimal miR30 context flanked by N10 barcodes on either side. (B) The focused library of hit shRNAs can be screened rapidly in different cell lines and for different phenotypes. Here, results are shown for ricin resistance in K562, HeLa, and RajiB cells and for Shiga toxin (Stx) resistance in HeLa and RajiB cells. Functionally related groups of genes show related phenotypic profiles across experiments, as revealed by hierarchical clustering (applied to the t statistic obtained from the phenotype distribution of shRNAs targeting a given gene in two experimental replicates). Highlighted examples of such functional groups are discussed in the text. (C) A double-shRNA library is created by a pooled restriction digest and ligation strategy. In the resulting plasmids, two shRNAs are expressed each from a miR30 context in the 3′ UTR of the same mRNA. A combinatorial barcode created at the junction uniquely identifies each double shRNA. SP, primer binding site for deep sequencing.
Construction and Screening of Double-shRNA Libraries.
To construct a double-shRNA library from individually barcoded shRNAs, we pooled active shRNAs (usually three shRNAs targeting each hit gene) and negative-control shRNAs and created all pairwise combinations of shRNAs by a pooled ligation strategy. In the resulting double-shRNA plasmids, both shRNAs are processed from minimal miR30a-contexts embedded in the 3′ UTR of the same RNA-polymerase II–transcribed mRNA (Fig. 4C). The combinatorial barcode created by ligation uniquely identifies each double-shRNA and is read out by deep sequencing. Thus far, we have created square GI maps from double-shRNA libraries in which the same set of shRNAs was present in the first and second position. This strategy can be modified easily by using different pools of shRNA plasmids to create the backbone and insert for ligation. Thus, rectangular GI maps can be constructed in which one dimension comprises “bait genes” representative of different cellular pathways and the other dimension comprises a larger number of “query genes,” which include genes of unknown function.
Pairwise combination of active shRNAs and negative control shRNAs results in three classes of double-shRNAs: (i) pairs of negative-control shRNAs, which are used to derive the WT phenotype; (ii) pairs of one active shRNA and one negative-control shRNA, which represent the individual phenotypes of the single active shRNA (18); and (iii) pairs of two active shRNAs (Fig. 1C). Importantly, shRNAs maintain their activity in either position within our double-shRNA construct (18). Pooled screening of the double-shRNA libraries allows the measurement of tens or hundreds of thousands of double-shRNA phenotypes in a single experiment.
Calculation of GIs from Double-shRNA Phenotypes.
GIs generally are defined as the deviation of observed double-mutant phenotypes from the phenotype expected based on the two individual mutant phenotypes. If the phenotype is directly related to fitness or growth rate, the expected double-mutant phenotype commonly is defined as product of the two single mutant phenotypes, although other definitions exist, such as the sum definition (23). For more complex phenotypes, such as the activation of a reporter gene, the expected double-mutant phenotype has successfully been defined empirically for each gene (10): Based on the assumption that strong GIs are rare, a fit of the observed double-mutant phenotypes to a rationally chosen function is used to define the expected phenotype, and GIs are quantified as deviations from this fitted function.
In the case of our ricin resistance screen, the relationship between single-shRNA phenotypes and double-shRNA phenotypes in combination with a given bait shRNA could be described adequately by a linear function (Fig. 5A and Methods). We fit linear functions for each bait shRNA and compared their slopes with the slopes obtained with the product and sum definitions for expected double-shRNA phenotypes (Fig. 5A and Fig. S3). The fit for some baits agreed reasonably well with either the sum or the product model, but for many others it deviated significantly. Intriguingly, fit functions for shRNAs targeting the same gene seemed to have more similar slopes than those for other shRNAs with similar single-shRNA phenotypes (Fig. S3), indicating a possible biological relevance of the slopes.
Fig. 5.

Derivation of genetic interactions from double-shRNA phenotypes. Data from growth and ricin resistance screens in K562 cells. (A) Genetic interactions are calculated as deviations from the expected double-mutant phenotype, which can be defined as product (dark blue) or sum (light blue) of the single mutant phenotypes or can be derived empirically by linearly fitting (red) the relationship between single shRNA phenotypes and double-shRNA phenotypes in combination with an shRNA of interest (in this example SEC23B_ii). The heatmap displays GIs from negative (cyan) to positive (yellow), based on the linear fit for expected double-shRNA phenotypes. (B) Comparison of biologically meaningful information obtained using the different definitions of expected double-shRNA phenotypes. Average correlation z-scores of GIs between shRNAs targeting the same gene (orange), compared with shRNAs targeting different genes (light gray), and shRNAs targeting genes encoding subunits of the same protein complex (purple) compared with others (dark gray). (C and D) GI patterns are compared for shRNAs targeting the physically interacting proteins WDR11 and C17orf75 to detect off-target effects. (C) Hierarchical clustering of GI patterns (excerpt of dataset), heatmap display of GIs from negative (cyan) to positive (yellow). (D) Distribution of correlation coefficients of GI patterns between C17orf75_i and all other shRNAs; GI correlations for shRNAs targeting WDR11 and C17orf75 are indicated by arrows. (E) GI correlations for all pairwise combinations of shRNAs targeting WDR11 and C17orf75, shown as heatmap of z values based on normalization of all GI correlation coefficients for the shRNA denoting the column. Phenotypes of individual shRNAs are listed. (F) In the ricin resistance double-shRNA screen, lack of high GI correlation for shRNAs targeting the same gene was more common for shRNAs with weaker phenotypes. The absolute values of ricin resistance, |ρ|, are binned; numbers refer to the upper bounds of the bins, and the last bin contains all cases exceeding the previous bound, as indicated by the > sign. Numbers of shRNAs passing or failing the intragene GI correlation cutoff of z = 0.8 are shown as orange and gray bars, respectively. The percentage of active shRNAs per bin is indicated by the red line.
To investigate which of the definitions would yield GIs capturing useful biological information, we compared the average Pearson correlation of GI patterns between pairs of shRNAs targeting either the same genes or genes encoding members of the same known protein complex and other pairs of shRNAs. We reasoned that an appropriate definition of GIs should lead to higher GI correlation for shRNA pairs targeting the same genes or genes encoding subunits of a physical complex than for others, because related functions of genes typically are reflected in similar GI patterns.
For GIs based both on growth and ricin resistance in K562 cells, the fit-based definition resulted in better differentiation of intragene and intracomplex shRNA pairs from other shRNA pairs than obtained with either the product or sum definition (Fig. 5B). We therefore used this definition for further analysis. It is likely that the best definition for GIs needs to be determined individually for other types of screens; the criterion we have presented here will be a useful tool for evaluating and comparing different possible definitions.
Exclusion of shRNAs with Partial Off-Target Effects.
The high Pearson correlation between GI patterns of independent shRNAs targeting the same gene (Fig. 5B) is to be expected if the shRNA phenotypes are caused predominantly by the depletion of the intended target gene. However, we observed exceptions to this rule for some genes, such as C17orf75. Among the three shRNAs targeting C17orf75, only the GI patterns for C17orf75_i and C17orf75_ii were highly correlated; C17orf75_iii showed only a partial similarity in the spectrum of GIs and had a low correlation with both C17orf75_i and C17orf75_ii (Fig. 5 C–E). In cases like these, we assumed that the highly correlated shRNAs were acting through the intended target, whereas the shRNA with the divergent GI pattern had partial off-target effects. In the case of C17orf75, this assumption is supported by the observation that C17orf75_i and C17orf75_ii also show a more correlated GI pattern than C17orf75_iii with shRNAs targeting WDR11 (Fig. 5E); WDR11 and C17orf75 encode physically interacting proteins (18).
To minimize the impact of off-target effects on the GI map, we excluded from further analysis shRNAs that lacked sufficient correlation with the other shRNAs targeting the same gene. To define sufficient correlation, we chose an empirically determined threshold of z = 0.8 on the basis of the normalized distribution of GI correlation coefficients for the shRNA.
An alternative explanation for the lack of strong GI pattern correlation between shRNAs targeting the same gene is low signal-to-noise caused by a weak phenotype. This is not the case for C17orf75_iii, which has a phenotypic strength comparable to that of the correlated shRNAs C17orf75_i and C17orf75_ii (Fig. 5E). However, in the ricin resistance dataset, there was a global trend for shRNAs with weaker phenotypes to be more likely to lack sufficient GI correlation (Fig. 5F).
The example of C17orf75_iii highlights the importance of using several shRNAs per gene: Even for bona-fide hit genes, shRNAs that show the expected phenotype individually and may effectively knock down the intended target gene can have additional off-target effects. Different off-target effects will be relevant, depending on the assayed phenotype, and it is unlikely that any given shRNA has no off-target effects whatsoever. The approach outlined above allows the exclusion of shRNAs from GI maps specifically based on off-targets relevant for the phenotype of interest.
Functional Dissection of Pathways and Complexes by Comparative GI Mapping.
To construct GI maps, we average GIs for sufficiently correlated shRNAs targeting the same gene and cluster genes based on the Pearson correlation between their GI patterns. To make GIs more easily interpretable, we display GIs as buffering or synergistic (SI Text and Fig. S4). An important advantage of our pooled screening approach is the ease with which the same double-shRNA library, once constructed, can be screened for different phenotypes, or in different cell lines. We constructed GI maps for the same set of genes based on K562 cell growth (Fig. 6A and the fully labeled version in Fig. S5) and ricin resistance (Fig. 6B and the fully labeled version in Fig. S6). Both GI maps recapitulated many known functional groups of genes. These included pathways (such as the small GTPase ARF1 and its nucleotide exchange factor GBF1, or a cluster including ribosomal proteins and a translation initiation factor), as well as physical complexes (such as GARP, ILF2/3, and the WDR11/C17orf75 complex).
Fig. 6.
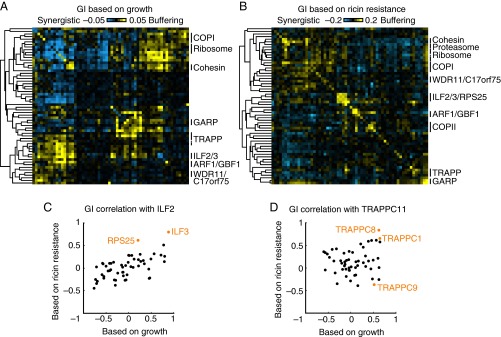
Growth-based and differential GI maps reveal protein complexes and pathways. (A and B) GI maps based on growth and ricin resistance, respectively, in K562 cells. Heatmap display of synergistic (cyan) and buffering (yellow) GIs. Groups of genes encoding known functionally or physically interacting proteins are labeled on the right.(Figs. S5 and S6 are fully labeled versions of these GI maps.) (C and D) Differences in GI correlation patterns between the growth-based and the ricin resistance-based GI maps. (C) GI pattern correlation between ILF2 and the other genes in the GI map (black). Two genes are highlighted in orange: ILF3, which together with ILF2 encodes the two subunits of the ILF2/3 complex, and RPS25, which shows a highly correlated GI pattern with ILF2 only based on ricin resistance. (D) GI pattern correlation between TRAPPC11 and the other genes in the GI map (black). Three genes are highlighted in orange: TRAPPC8, which we propose to be a member of a specialized TRAPP complex with TRAPPC11; TRAPPC9, which we propose to be a member of a different specialized TRAPP complex; and TRAPPC1, presumably a constitutive member of all TRAPP complexes. Dissection of the two specialized TRAPP complexes is possible only based on ricin resistance, not simply on growth.
Notably, shRNAs for the double-shRNA library were chosen based on their ricin resistance phenotype (ρ), and some had only very minor effects on growth (γ). Consequently, the amplitude of GIs was much lower for the growth-based GI map than for the ricin resistance-based GI map (Fig. 6 A and B). Despite the lower signal for individual GIs, correlation between GI patterns was highly reproducible (Fig. S7A), and clustering of related genes in the growth-based GI map was robust (Fig. 6A).
Although most GI correlations and clusters were very similar in the growth-based and ricin resistance-based GI maps, there were intriguing exceptions. Surprisingly, knockdown of the small ribosomal subunit RPS25 caused ricin resistance, whereas knockdown of large ribosomal subunits sensitized cells to ricin (18). In the ricin-based GI map, the GI pattern of RPS25 was highly correlated with ILF2 and ILF3, genes encoding two subunits of a heterodimeric complex with roles in transcription, mRNA processing, and translation (24). In contrast, RPS25 was mostly uncorrelated with ILF2/3 in the growth-based GI map (Fig. 6C). Furthermore, RPS25 shows a strongly buffering GI with ILF2/3 in the ricin-based GI map (Fig. S6) but not in the growth-based GI map (Fig. S5). Conversely, ILF2 and ILF3 showed highly correlated GI patterns and buffering GIs in both GI maps (Fig. 6C). Together, these results suggest that RPS25 and ILF2/3 have related or joined functions in ricin-intoxicated cells but that RPS25-unrelated roles of ILF2/3 are relevant for survival and growth in the absence of ricin.
A second example is our identification of two functionally distinct TRAPP complexes, which differentially interact with COPI and COPII vesicle coats (18). Our biochemical validation experiments suggest that the COPI-interacting complex mTRAPPII contains the specific subunits TRAPPC9 and TRAPPC10, whereas the COPII-interacting complex mTRAPPIII specifically contains TRAPPC8, TRAPPC11, TRAPPC12 and TRAPPC13 (18). The clue for the existence of these complexes came from the observation that TRAPPC9 was anti-correlated with other TRAPP components in the ricin-based GI map (Fig. 6D). The functional specialization would not have been detected in the growth-based GI map, where TRAPPC9 correlates with the other TRAPP components (Fig. 6D). Although we could demonstrate biochemically that the distinct TRAPP complexes exist in the absence of ricin (18), their distinct roles in the cell did not affect growth differentially, whereas they had opposing effects on ricin susceptibility.
These findings illustrate the value of interrogating the same set of GIs under different conditions, a concept previously proposed on the basis of differential GI maps (or “dEMAPs”) obtained in yeast by determining growth-based GIs under different conditions and subtracting them from each other (16). More recently, more robust results were obtained using differential phenotypes from treated and untreated yeast replicates to calculate GIs (25). Similarly, here we propose defining a differential phenotype (such as ricin resistance, which is quantified by comparing growth in the presence and absence of ricin) and determining GIs based on this differential phenotype. Although the resulting map theoretically should be identical to a differential GI map, determining differential phenotypes for each experimental replicate before calculating GI maps clearly improves the reproducibility of the resulting GI maps (Fig. S7A). GI maps based on differential phenotypes also reveal context-dependent pathways more clearly (Fig. 6 C and D) than growth-based GI maps derived from different conditions (Fig. S7 B and C). In the future, systematic comparison of GI maps obtained for a wide range of specific phenotypes (Fig. 1C) should enable important insights into the dynamic nature of cellular networks.
Discussion
We have developed an integrated technology platform for functional genomics in mammalian cells based on quantitative pooled shRNA screens. First, we identify genes of interest in a pooled genome-wide screen. Our key innovations for the primary screen are the ultra-high coverage (∼25 shRNAs per gene) and the extensive set of negative-control shRNAs, which allow us to detect hit genes with great sensitivity and robustness. Second, we construct high-density GI maps based on pooled screening of a double-shRNA library targeting all combinations of hit genes from the primary screen. Many of the quantitative strategies presented here also will apply to other methodologies interfering with gene expression, such as variations of the bacterial CRISPR system (26).
Our pooled double-shRNA strategy has the important limitation that only certain phenotypes can be assayed: those based on cell growth and survival under different conditions and phenotypes that can be used for the physical separation of cells. Although fluorescence-coupled phenotypes can be the basis for separation of cells by flow cytometry, complex phenotypes are assayed more readily in an arrayed screening format, where each gene pair is knocked down in a separate well by a combination of interfering RNAs (19–21).
However, our pooled shRNA-based strategy also has several advantages over arrayed approaches. Pooled screens subject all cells to an identical environment and selective pressure, thus removing major sources of experimental variability. They can be carried out in standard cell culture vessels, obviating the need for specialized high-throughput equipment for screen setup and phenotype readout. The knockdown mediated by siRNAs is transient, whereas cells stably expressing shRNAs can be subjected to longer continuous screens, which are relevant for investigating biological processes such as senescence or proliferation of cancer cells. Furthermore, shRNAs can be expressed at levels that do not saturate the cellular RNAi machinery (27); this feature is an important prerequisite for maintaining knockdown efficiency in the double-shRNA format, whereas siRNAs can cause side effects by saturating the cellular machinery (28). Importantly, pooled screens using suspension cell lines or adherent cell lines growing on microcarriers can be scaled up seamlessly in simple stirrer flasks or more sophisticated bioreactors without increasing the time required for the screen, whereas the time required for the sequential setup and phenotype readout of well-based screens scales linearly with the number of GIs. Because the number of GIs increases as the square of the number of genes under investigation, scalability is a criterion of paramount importance for the construction of larger GI maps. Finally, once a double-shRNA library is constructed, it can be screened rapidly in a variety of cell types (including primary patient cells) or under a variety of different selective pressures (such as different drugs).
Here, we demonstrate biological findings obtained by comparing GI maps based on different phenotypes (effects on growth versus ricin susceptibility). In the future, comparative GI mapping can provide a 3D dataset of GIs across multiple different cell types or primary cells from different individuals or phenotypic readouts. Growth-based and resistance-based maps could be combined with richer phenotypic read-outs (e.g., induction of a transcriptional response, turning on a signaling pathway, a switch from latent to lytic phases of a viral infections, or cell migration). Together, these maps should yield fundamental insights both into the rewiring of cellular pathways in different contexts and, conversely, into the functional consequences of complex differences in genetic and epigenetic background.
Methods
Cell Culture.
K562 and Raji B cells were grown in RPMI-1640 medium supplemented with 10% (vol/vol) FBS, glutamine, and penicillin/streptomycin. HeLa cells were grown in DMEM supplemented with 10% (vol/vol) FBS, glutamine, and penicillin/streptomycin. Lentiviral production and infection was carried out as previously described (18).
shRNA Libraries.
We have previously described the design and production of shRNA libraries (18). Briefly, an shRNA-expressing cassette was stably integrated in the genome of human cell lines by lentiviral transduction. shRNAs were expressed in a minimal miR30 context (29, 30) in the 5′ UTR of a transcript encoding puromycin resistance and mCherry, driven by the human EF1A promoter. In our genome-wide shRNA library, each human annotated protein-coding gene was targeted by ∼25 independent shRNAs, which were designed using the shRNA retriever (29) or si/shRNA selector (31) programs. This library also contained >1,000 negative control shRNAs with a matching base frequency distribution but not targeting any human transcript.
Barcoded shRNA vectors.
We previously described cloning of individual shRNAs into pMK1098 (18). pMK1098 was used for all experiments described in this study. The miR30a context in pMK1098 is based on the design in vector pSM2 (29) and contains a mutation creating an EcoRI site in a motif recently shown to be important for efficient miRNA processing (32). For future studies, we therefore constructed a new vector, pMK1200, which is identical to pMK1098, except that the mutation is eliminated to restore the WT sequence of miR30a at that position. The sequence of the mini-miR30a context in pMK1200 is as follows: 5’-CCTAGG-N10-GACTCGAGAAGAAGGTATATTGCTGTTGACCCAGAGCGTTGG-stuffer-CCACTGCCTTGGGCCTCGGACTTCAAGGGGTCAGTCACACTCTTTCCCTACACGACGCTCTTCCGATCT-N10-TCTAGA-3’. (BstXI sites are shown in bold, the nucleotide differing from pMK1098 is underlined.)
Pooled Screens.
The number of cells for each screen was chosen based on the complexity of the shRNA library. The average representations were ∼1,000 cells per shRNA element for primary screens, ∼50,000 cells per shRNA element for screens with focused shRNA libraries, and ∼4,000 cells per double-shRNA element for double-shRNA screens. The double-shRNA library used here encompassed ∼37,000 different shRNA combinations. Frequencies of shRNA-encoding cassettes in a population of cells were quantified by deep sequencing (18). For growth phenotypes, a cell population harvested at t0 was compared with the untreated cells at the end of the screen, which typically lasted ∼12 d. For toxin resistance screens, toxin-treated and untreated cells were grown for the same number of days and compared. Toxin-treated cells were subjected to rounds of 24-h toxin treatment followed by recovery periods until pretreatment doubling rates were achieved. The following doses were typically used: ricin (Vector Laboratories): 0.5 ng/mL (standard dose in K562 cells and HeLa cells), 0.8 ng/mL (high dose in K562 cells, Fig. 2E) and 40 ng/mL (in Raji B cells); Shiga toxin (Toxin Technology): 1.5 pg/mL (in HeLa cells and Raji B cells).
Determination of shRNA Phenotypes from Pooled Screens.
During exponential growth, the number of WT cells, NWT, will increase over time as:
where g is the growth rate of WT cells (Fig. 2A). We define the effect of shRNA X on NX(t), the growth of cells expressing X, as γX, such that
γX can be calculated from the change in frequency of cells expressing X compared with WT cells as quantified by deep sequencing:
 |
Note that the observed growth rates represent the net result of cell proliferation and cell death and may not always be constant over the time course of the experiment, depending on the dynamics of the selection procedure. The growth rate of WT cells, g, is determined by exploiting the fact that the cell population contains some fraction of cells (typically 10–20%) that have not been infected with the shRNA-mCherry–expressing construct. g is calculated by measuring the growth of the bulk population (using standard cell counting and viability assays) and correcting for differences in growth between the WT cells and the bulk population by tracking the fraction of mCherry-negative subpopulation using flow cytometry.
For screens carried out in the presence of selective pressure, we define a selective pressure k such that:
For k < g, cells grow with a reduced net rate (because of growth inhibition or cell death); for k > g, the population decreases because of net cell death. We define the resistance that an shRNA X confers to the selective pressure as ρX, such that
To determine ρX, frequencies of cells expressing shRNAs are compared in unselected (U) and selected (S) populations:
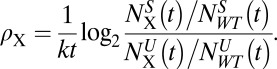 |
Frequencies at t0 need not be measured to calculate ρX as long as the unselected and selected populations are separated from a common parent population at t0. However, k needs to be calculated as the reduction in growth rate that WT cells experience under selective conditions compared with standard conditions. As with g (see above), we calculate k by measuring bulk population growth and monitoring the fraction of mCherry-negative cells for both the unselected and selected populations.
In experiments with k ∼ 0, ρX is not a useful measure, and instead we use the differential growth metric δX, defined as:
 |
Selection does not have to be growth-based; it also can rely on physical separation methods such as fluorescence-activated cell-sorting or cell-migration assays. If the separation always is carried out according to the same protocol, differential enrichment εX represents a directly comparable metric of phenotype:
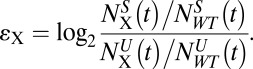 |
Definitions for Expected Double-shRNA Phenotypes.
For shRNAs X and Y with individual phenotypes ϕX and ϕY (where ϕ can be γ, ρ, or δ as defined above), the expected phenotype for the double-shRNA XY is ϕX + ϕY according to the sum definition and is (1 + ϕX) · (1 + ϕY) − 1 according to the product definition. To derive the expected double-shRNA phenotype from a linear fit, all single-shRNA phenotypes were plotted against the phenotypes of the same shRNAs paired with X, as in Fig. 5A, and fit by linear regression. We forced the linear function fX to assume ϕX for a single-shRNA phenotype of 0 (WT). Thus, the only degree of freedom for each bait was the slope of the linear fit. Similarly, we fit a linear function fY describing the relationship between all single-shRNA phenotypes and the phenotypes of the same shRNAs paired with Y. fX(ϕY) and fY(ϕX) generally agreed well, and we defined the fit-based expected double-shRNA phenotype as the average of fX(ϕY) and fY(ϕX).
Data Analysis.
We developed custom scripts in Python/Numpy for most data analysis and plotting, which will be made available on request. We used QVALUE (33) for Q value (FDR) calculation. Genes were clustered hierarchically based on Pearson correlation of GIs in Cluster (34) and visualized by TreeView (35).
Supplementary Material
Acknowledgments
We thank Sean Collins for advice on data analysis; Jacob Stewart-Ornstein, Gene-Wei Li, Sean Collins and members of the J.S.W. laboratory for helpful discussions and critical reading of the manuscript; Shuyi Wang and Owen Chen for technical assistance; and Max Horlbeck for testing pMK1200. M.K. was funded by fellowships from the Jane Coffin Childs Memorial Fund for Medical Research and the University of California, San Francisco Program for Breakthrough Biomedical Research. M.C.B. was funded by a fellowship from the Leukemia and Lymphoma Society. J.S.W. was funded by the Howard Hughes Medical Institute, National Institutes of Health Grant 1U01CA168370-01, and a Howard Hughes Collaborative Initiative Award.
Footnotes
The authors declare no conflict of interest.
This article contains supporting information online at www.pnas.org/lookup/suppl/doi:10.1073/pnas.1307002110/-/DCSupplemental.
References
- 1.Lander ES, et al. International Human Genome Sequencing Consortium Initial sequencing and analysis of the human genome. Nature. 2001;409(6822):860–921. doi: 10.1038/35057062. [DOI] [PubMed] [Google Scholar]
- 2.Venter JC, et al. The sequence of the human genome. Science. 2001;291(5507):1304–1351. doi: 10.1126/science.1058040. [DOI] [PubMed] [Google Scholar]
- 3.Abecasis GR, et al. 1000 Genomes Project Consortium An integrated map of genetic variation from 1,092 human genomes. Nature. 2012;491(7422):56–65. doi: 10.1038/nature11632. [DOI] [PMC free article] [PubMed] [Google Scholar]
- 4.Mardis ER. Genome sequencing and cancer. Curr Opin Genet Dev. 2012;22(3):245–250. doi: 10.1016/j.gde.2012.03.005. [DOI] [PMC free article] [PubMed] [Google Scholar]
- 5.Kaelin WG., Jr Molecular biology. Use and abuse of RNAi to study mammalian gene function. Science. 2012;337(6093):421–422. doi: 10.1126/science.1225787. [DOI] [PMC free article] [PubMed] [Google Scholar]
- 6.Schultz N, et al. Off-target effects dominate a large-scale RNAi screen for modulators of the TGF-β pathway and reveal microRNA regulation of TGFBR2. Silence. 2011;2:3. doi: 10.1186/1758-907X-2-3. [DOI] [PMC free article] [PubMed] [Google Scholar]
- 7.Adamson B, Smogorzewska A, Sigoillot FD, King RW, Elledge SJ. A genome-wide homologous recombination screen identifies the RNA-binding protein RBMX as a component of the DNA-damage response. Nat Cell Biol. 2012;14(3):318–328. doi: 10.1038/ncb2426. [DOI] [PMC free article] [PubMed] [Google Scholar]
- 8.Collins SR, et al. Functional dissection of protein complexes involved in yeast chromosome biology using a genetic interaction map. Nature. 2007;446(7137):806–810. doi: 10.1038/nature05649. [DOI] [PubMed] [Google Scholar]
- 9.Frost A, et al. Functional repurposing revealed by comparing S. pombe and S. cerevisiae genetic interactions. Cell. 2012;149(6):1339–1352. doi: 10.1016/j.cell.2012.04.028. [DOI] [PMC free article] [PubMed] [Google Scholar]
- 10.Jonikas MC, et al. Comprehensive characterization of genes required for protein folding in the endoplasmic reticulum. Science. 2009;323(5922):1693–1697. doi: 10.1126/science.1167983. [DOI] [PMC free article] [PubMed] [Google Scholar]
- 11.Pan X, et al. A robust toolkit for functional profiling of the yeast genome. Mol Cell. 2004;16(3):487–496. doi: 10.1016/j.molcel.2004.09.035. [DOI] [PubMed] [Google Scholar]
- 12.Roguev A, et al. Conservation and rewiring of functional modules revealed by an epistasis map in fission yeast. Science. 2008;322(5900):405–410. doi: 10.1126/science.1162609. [DOI] [PMC free article] [PubMed] [Google Scholar]
- 13.Tong AH, et al. Systematic genetic analysis with ordered arrays of yeast deletion mutants. Science. 2001;294(5550):2364–2368. doi: 10.1126/science.1065810. [DOI] [PubMed] [Google Scholar]
- 14.Tong AH, et al. Global mapping of the yeast genetic interaction network. Science. 2004;303(5659):808–813. doi: 10.1126/science.1091317. [DOI] [PubMed] [Google Scholar]
- 15.Schuldiner M, et al. Exploration of the function and organization of the yeast early secretory pathway through an epistatic miniarray profile. Cell. 2005;123(3):507–519. doi: 10.1016/j.cell.2005.08.031. [DOI] [PubMed] [Google Scholar]
- 16.Bandyopadhyay S, et al. Rewiring of genetic networks in response to DNA damage. Science. 2010;330(6009):1385–1389. doi: 10.1126/science.1195618. [DOI] [PMC free article] [PubMed] [Google Scholar]
- 17.Collins SR, Schuldiner M, Krogan NJ, Weissman JS. A strategy for extracting and analyzing large-scale quantitative epistatic interaction data. Genome Biol. 2006;7(7):R63. doi: 10.1186/gb-2006-7-7-r63. [DOI] [PMC free article] [PubMed] [Google Scholar]
- 18.Bassik MC, et al. A systematic mammalian genetic interaction map reveals pathways underlying ricin susceptibility. Cell. 2013;152(4):909–922. doi: 10.1016/j.cell.2013.01.030. [DOI] [PMC free article] [PubMed] [Google Scholar]
- 19.Horn T, et al. Mapping of signaling networks through synthetic genetic interaction analysis by RNAi. Nat Methods. 2011;8(4):341–346. doi: 10.1038/nmeth.1581. [DOI] [PubMed] [Google Scholar]
- 20.Roguev A, et al. Quantitative genetic-interaction mapping in mammalian cells. Nat Methods. 2013;10(5):432–437. doi: 10.1038/nmeth.2398. [DOI] [PMC free article] [PubMed] [Google Scholar]
- 21.Laufer C, Fischer B, Billmann M, Huber W, Boutros M. Mapping genetic interactions in human cancer cells with RNAi and multiparametric phenotyping. Nat Methods. 2013;10(5):427–431. doi: 10.1038/nmeth.2436. [DOI] [PubMed] [Google Scholar]
- 22.Luo B, et al. Highly parallel identification of essential genes in cancer cells. Proc Natl Acad Sci USA. 2008;105(51):20380–20385. doi: 10.1073/pnas.0810485105. [DOI] [PMC free article] [PubMed] [Google Scholar]
- 23.Mani R, St Onge RP, Hartman JL, IV, Giaever G, Roth FP. Defining genetic interaction. Proc Natl Acad Sci USA. 2008;105(9):3461–3466. doi: 10.1073/pnas.0712255105. [DOI] [PMC free article] [PubMed] [Google Scholar]
- 24.Barber GN. The NFAR’s (nuclear factors associated with dsRNA): Evolutionarily conserved members of the dsRNA binding protein family. RNA Biol. 2009;6(1):35–39. doi: 10.4161/rna.6.1.7565. [DOI] [PubMed] [Google Scholar]
- 25.Bean GJ, Ideker T. Differential analysis of high-throughput quantitative genetic interaction data. Genome Biol. 2012;13(12):R123. doi: 10.1186/gb-2012-13-12-r123. [DOI] [PMC free article] [PubMed] [Google Scholar]
- 26.Qi LS, et al. Repurposing CRISPR as an RNA-guided platform for sequence-specific control of gene expression. Cell. 2013;152(5):1173–1183. doi: 10.1016/j.cell.2013.02.022. [DOI] [PMC free article] [PubMed] [Google Scholar]
- 27.An DS, et al. Optimization and functional effects of stable short hairpin RNA expression in primary human lymphocytes via lentiviral vectors. Mol Ther. 2006;14(4):494–504. doi: 10.1016/j.ymthe.2006.05.015. [DOI] [PMC free article] [PubMed] [Google Scholar]
- 28.Khan AA, et al. Transfection of small RNAs globally perturbs gene regulation by endogenous microRNAs. Nat Biotechnol. 2009;27(6):549–555. doi: 10.1038/nbt.1543. [DOI] [PMC free article] [PubMed] [Google Scholar]
- 29.Paddison PJ, et al. Cloning of short hairpin RNAs for gene knockdown in mammalian cells. Nat Methods. 2004;1(2):163–167. doi: 10.1038/nmeth1104-163. [DOI] [PubMed] [Google Scholar]
- 30.Silva JM, et al. Second-generation shRNA libraries covering the mouse and human genomes. Nat Genet. 2005;37(11):1281–1288. doi: 10.1038/ng1650. [DOI] [PubMed] [Google Scholar]
- 31.Matveeva OV, et al. Optimization of duplex stability and terminal asymmetry for shRNA design. PLoS ONE. 2010;5(4):e10180. doi: 10.1371/journal.pone.0010180. [DOI] [PMC free article] [PubMed] [Google Scholar]
- 32.Auyeung VC, Ulitsky I, McGeary SE, Bartel DP. Beyond secondary structure: primary-sequence determinants license pri-miRNA hairpins for processing. Cell. 2013;152(4):844–858. doi: 10.1016/j.cell.2013.01.031. [DOI] [PMC free article] [PubMed] [Google Scholar]
- 33.Storey JD, Tibshirani R. Statistical significance for genomewide studies. Proc Natl Acad Sci USA. 2003;100(16):9440–9445. doi: 10.1073/pnas.1530509100. [DOI] [PMC free article] [PubMed] [Google Scholar]
- 34.Eisen MB, Spellman PT, Brown PO, Botstein D. Cluster analysis and display of genome-wide expression patterns. Proc Natl Acad Sci USA. 1998;95(25):14863–14868. doi: 10.1073/pnas.95.25.14863. [DOI] [PMC free article] [PubMed] [Google Scholar]
- 35.Saldanha AJ. Java Treeview—extensible visualization of microarray data. Bioinformatics. 2004;20(17):3246–3248. doi: 10.1093/bioinformatics/bth349. [DOI] [PubMed] [Google Scholar]
Associated Data
This section collects any data citations, data availability statements, or supplementary materials included in this article.