

Abstract
Previous genome-wide association studies (GWAS) have identified common variants in genes associated with variation in bone mineral density (BMD), although most have been carried out in combined samples of older women and men. Meta-analyses of these results have identified numerous SNPs of modest effect at genome-wide significance levels in genes involved in both bone formation and resorption, as well as other pathways. We performed a meta-analysis restricted to premenopausal white women from four cohorts (n= 4,061 women, ages 20 to 45) to identify genes influencing peak bone mass at the lumbar spine and femoral neck. Following imputation, age- and weight-adjusted BMD values were tested for association with each SNP. Association of a SNP in the WNT16 gene (rs3801387; p=1.7 × 10⁻⁹) and multiple SNPs in the ESR1/C6orf97 (rs4870044; p=1.3 × 10⁻⁸) achieved genome-wide significance levels for lumbar spine BMD. These SNPs, along with others demonstrating suggestive evidence of association, were then tested for association in seven Replication cohorts that included premenopausal women of European, Hispanic-American, and African-American descent (combined n=5,597 for femoral neck; 4,744 for lumbar spine). When the data from the Discovery and Replication cohorts were analyzed jointly, the evidence was more significant (WNT16 joint p=1.3 × 10⁻¹¹; ESR1/C6orf97 joint p= 1.4 × 10⁻¹⁰). Multiple independent association signals were observed with spine BMD at the ESR1 region after conditioning on the primary signal. Analyses of femoral neck BMD also supported association with SNPs in WNT16 and ESR1/C6orf97 (p< 1 × 10⁻⁵). Our results confirm that several of the genes contributing to BMD variation across a broad age range in both sexes have effects of similar magnitude on BMD of the spine in premenopausal women. These data support the hypothesis that variants in these genes of known skeletal function also affect BMD during the premenopausal period.
Keywords: Bone mineral density, GWAS, premenopausal, meta-analysis, genetics
INTRODUCTION
Osteoporosis, a major public health problem due to the associated increased risk of fractures and consequent morbidity and excess mortality, is a skeletal disorder characterized by compromised bone strength predisposing to an increased risk of fracture. Low bone mass is a major contributor to reduced bone strength. In the United States osteoporosis accounts for 1.5 million new fracture cases each year, and more than 40 million people (primarily women) either have osteoporosis or are at high risk due to low bone mass. (1)
Previous studies have demonstrated that bone mineral density (BMD) in older adults is influenced by genes underlying both bone accrual (i.e., peak bone mass) and bone loss.(2) The contribution of genetic factors to variation in BMD is substantial;(3,4) however, only recently have specific genes and variants associated with BMD been identified and replicated. (5–12) Because of the small effect sizes of identified variants, the most robust results have been obtained by combining results across numerous studies, most including older women and men, to obtain very large sample sizes. These highly powered meta-analyses with very large discovery and replication samples have both replicated known genes or variants and detected novel genes or variants contributing to BMD variability.(13,14) However, these studies have not focused on the genetic determinants of premenopausal bone density.
Peak BMD, which generally occurs around the third to fourth decade of life at the lumbar spine, and much earlier at the hip,(15) is one of the strongest predictors of BMD in later life. Peak BMD is highly heritable, with estimates in Caucasian samples that 50–85% of its variation is genetically determined.(2) De-coupling the effects of peak BMD and premenopausal bone loss(16,17) on BMD in later life is important for understanding osteoporosis risk. Bone loss with age is influenced by substantial environmental as well as genetic factors. These factors may or may not also contribute to peak BMD. Thus, studies of older populations in whom bone loss is likely to have begun may not identify genes that uniquely contribute to acquisition and maintenance of peak BMD. Rather, in women changes in BMD related to the menopausal transition may be influenced by genetic variants that do not reflect peak BMD and may mask the ability to identify specific variants associated with this phenotype.
This study was designed to identify genes contributing to peak BMD in premenopausal women. While several drugs exist to inhibit bone loss, including bisphosphonates and RANKL inhibitors, there are currently few medicines aimed at enhancing bone formation. Thus, the identification of genes responsible for bone accrual may serve to identify drug targets whose manipulation could aid in the improvement of BMD, which has been a successful strategy for therapeutic development.(18)
METHODS
Discovery Sample
Genotypic and phenotypic data were obtained from four cohorts of well-characterized European-American premenopausal women, with DXA BMD data available at both the lumbar spine (L1-L4 or L2-L4) and femoral neck (Table 1 and Supplemental Methods). All four Discovery cohorts also contributed GWAS results to the Estrada et al analysis(13); the Discovery cohorts for our study (except the Indiana Sister sample) represent subsets of larger samples also containing older individuals of both sexes. To obtain a sample of female subjects yet to reach menopause and as near to their peak BMD level as possible, the age range was limited to subjects between 20 and 45 years of age at the time BMD was obtained. When serial BMD measures within this range were available, the earliest measure was used. The precise age of menopause could not be uniformly determined in all participating cohorts; therefore, 45 years was chosen because it is the inflection point in the trend of BMD with age(19) and because population-based prospective data show this is where major bone loss begins.(20) Exclusion criteria for all studies included inability to have BMD measured because of obesity, irregular menses or a history of pregnancy or lactation within three months prior to BMD measurement. Women taking oral contraceptives were not excluded. Additional cohort-specific criteria for exclusion of peri- and post-menopausal women are detailed in the Supplemental Material.
Table 1.
Discovery and Replication Samples
| Cohort | Sample size | Age (years) |
Spine BMD (g/cm2) |
Femoral Neck BMD (g/cm2) |
|---|---|---|---|---|
| DISCOVERY SAMPLE | ||||
| TwinsUK | 1536 | 36.47± 8.87 | 1.03± 0.12 | 0.85± 0.12 |
| Indiana Sisters Study* | 1504 | 33.15 ± 7.21 | 1.28 ± 0.13 | 1.02 ± 0.12 |
| Framingham Heart Study | 841 | 36.29 ± 6.04 | 1.27 ± 0.15 | 1.01 ± 0.13 |
| Amish Family Osteoporosis Study | 180 | 38.50 ± 8.34 | 1.00 ± 0.11 | 0.89 ± 0.11 |
| TOTAL | 4,061 | |||
| REPLICATION SAMPLE | ||||
| Indiana Sisters Extended Study, (European American)* | 802 | 29.02 ± 7.25 | 1.25 ± 0.13 | 1.05 ± 0.12 |
| Indiana Sisters Extended Study, (African American)* | 1090 | 32.14 ± 6.77 | 1.33 ± 0.15 | 1.11 ± 0.14 |
| San Antonio Family Study | 349 | 34.14 ± 8.47 | 1.05 ± 0.15 | 0.88 ± 0.17 |
| Fels Longitudinal Study | 245 | 34.58 ± 8.67 | 1.06 ± 0.12 | 0.86 ± 0.12 |
| PEAK25 Swedish Study | 999 | 25.49 ± 0.20 | 1.22 ± 0.13 | 1.05 ± 0.12 |
| GEOS† | 996 | 31.62 ± 7.38 | 1.19 ± 0.13 | 0.98 ± 0.13 |
| CaMOS† | 263 | 32.01±8.45 | 1.04± 0.11 | 0.83 ± 0.11 |
| ALSPAC** | 853 | 43.04 ± 2.12 | NA | 1.01 ± 0.14 |
| TOTAL | 5,597 |
The Indiana study consists of a European-American sample with GWAS genotypes, and an extended sample of both European- and African-American subjects without GWAS
The ALSPAC study did not measure BMD at lumbar spine; the Replication Sample therefore consisted of 4,744 subjects for this phenotype
The premenopausal subset of these cohorts overlap (all of the CaMOS samples, 341 of the GEOS samples) with replication samples used in (13)
Genotyping was performed independently in each sample and results of the Discovery GWAS studies were previously reported.(7,8,21,22) Each study independently imputed their autosomal data to the CEU HapMap II release 22 SNP map; 2,543,887 genotyped and imputed SNPs were then available for analysis in each cohort. Association analyses of each SNP with the two BMD phenotypes were conducted in each cohort separately. Each study included appropriate covariates such as age, weight, and familial relationships, as needed (see Supplemental Material for details). All cohorts contributing to the meta-analysis had study approval from their appropriate institutional research ethics boards, and written informed consent was provided by all subjects.
Meta-analysis
Results from the different Discovery Sample datasets were combined using inverse variance fixed-effects meta-analysis as implemented in METAL.(23) The contribution of each study to the meta-analysis was weighted by the standard error of the SNP association parameter (beta of the SNP effect). Double genomic control correction was applied to account for possible inflation of association test statistics due to cryptic stratification among or between the Discovery cohorts.
Selection of SNPs for replication
SNPs with p-values < 5 × 10⁻⁵ were prioritized for further review and potential inclusion in the replication studies. All SNPs meeting this threshold were reviewed in detail to determine whether: 1) at least 3 of the 4 studies in the Discovery Sample supported the association (β in same direction); 2) there was at least 1 other SNP within the surrounding 100 kb region that supported the association (p<10−4); and 3) the MAF was >10%, so as to have sufficient power to replicate the association in the Replication Sample. We then pruned the set of SNPs in a chromosomal region to remove all SNPs in linkage disequilibrium (r2>0.3) with the SNP having the most significant p-value in the region. Using this approach, a total of 23 SNPs were selected for genotyping in an independent Replication Sample.
Replication Sample
For replication, we identified 7 additional studies that included premenopausal women for whom BMD measurements had been made at the femoral neck and lumbar spine sites. The majority of these samples were independent of those employed in the larger, more heterogeneous BMD study by Estrada(13) (Table 1 and Supplemental Methods). The primary inclusion and exclusion criteria for the Replication Sample were identical to those applied to the Discovery Sample (details of each Replication cohort are provided in the Supplemental Material). Each dataset included in the Replication Sample was analyzed separately, and summary results were then meta-analyzed in the same manner as for the Discovery Sample.
Replication and Joint meta-analyses
A total of 23 independent SNPs were evaluated for association in the Replication Sample. A joint analysis of the data from the Discovery and Replication Samples was conducted for the 23 SNPs on which data were available for all the contributing studies (termed the Joint Sample). The significance of these joint meta-analysis results was evaluated using a genome-wide threshold of 5 × 10⁻⁸. Due to the racial diversity of the Replication Sample, the Joint Analysis was also performed in only those cohorts that were Caucasian and non-Hispanic.
Conditional analysis
The GWAS meta-analyses revealed two regions (WNT16 and ESR1/C6orf97) for which multiple SNPs provided evidence of association with lumbar spine BMD. We performed conditional analyses to test whether there was evidence to support other independent association signals for BMD in these regions (see Supplemental Materials for details).
RESULTS
Discovery Sample – lumbar spine BMD
The Discovery sample consisted of 4,061 women with BMD measurements. Results from the GWAS meta-analysis of lumbar spine BMD are presented in Figure 1A. Following double genomic control, there was no evidence to suggest any inflation of the association results (genomic inflation factor = 1.001; Supplemental Figure 1A). Details of SNPs with evidence of association with lumbar spine BMD are provided in Table 2.
Figure 1. Genome-wide results from the meta-analysis of the Discovery Sample.
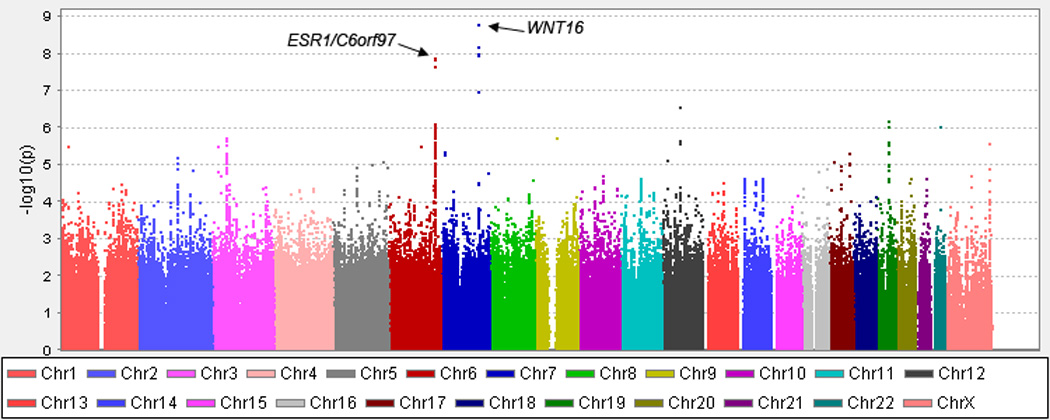
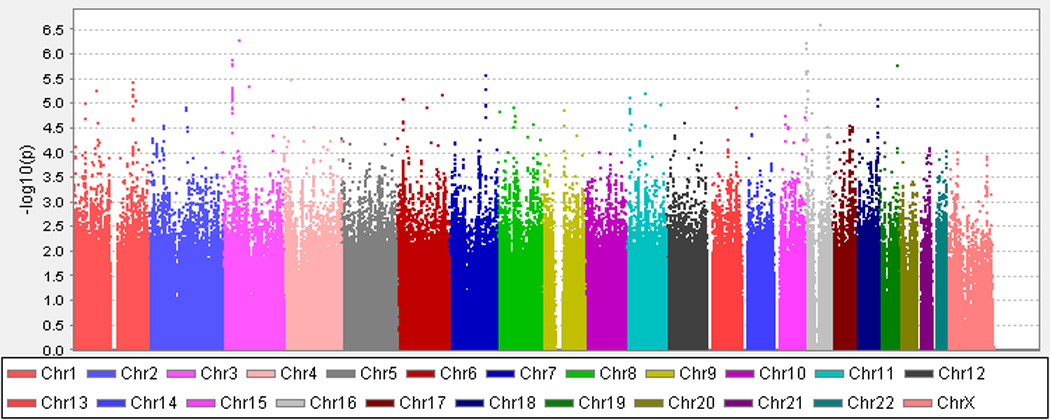
A. Lumbar Spine BMD. B. Femoral Neck BMD. The X axis indicates the chromosomal position of each SNP while the Y axis denotes the evidence of association shown as -log(p-value).
Table 2.
Results for Premenopausal Lumbar Spine BMD (Discovery sample p<5×10⁻⁵ for any BMD site)
| SNP | Chr | Positiona | MAFb | Gene | Discovery P-value |
Replication P-value |
Joint P-value |
Joint Effectc |
Effect Allele |
Effect directiond,e |
|---|---|---|---|---|---|---|---|---|---|---|
| rs3801387 | 7 | 120.97 | 0.28 | WNT16 | 1.69 × 10⁻⁹ | 2.18 × 10⁻⁴ | 1.30 × 10⁻¹¹ | −0.115 | T | −−−−−−−−−−−− |
| rs4870044 | 6 | 151.9 | 0.29 | C6orf97 | 1.32 × 10⁻⁸ | 5.17 × 10⁻⁴ | 1.40 × 10⁻¹⁰ | −0.107 | A | −−−−−−−−−+−− |
| rs6930633 | 6 | 151.96 | 0.33 | C6orf97 | 1.03 × 10⁻⁶ | 0.001 | 1.16 × 10⁻⁸ | 0.094 | A | +++++−+−++?+ |
| rs2982575 | 6 | 152.07 | 0.47 | ESR1 | 8.27 × 10⁻⁷ | 0.040 | 8.85 × 10⁻⁷ | −0.078 | T | −−−−−−−+−−+− |
| rs7258173 | 19 | 33.55 | 0.11 | RHPN2 | 6.93 × 10⁻⁷ | 0.028 | 9.94 × 10⁻⁷ | 0.118 | A | +++++++++??+ |
| rs11247864 | 1 | 26.52 | 0.33 | CATSPER4 | 3.11 × 10⁻⁶ | 0.502 | 6.04 × 10⁻⁵ | −0.076 | T | −−−−−?−??−+− |
| rs10784173 | 12 | 61.56 | 0.28 | PGBD3P1 | 2.80 × 10⁻⁷ | 0.731 | 1.47 × 10⁻⁴ | −0.076 | A | −−−−−?+??−?− |
| rs16912067 | 12 | 16.77 | 0.32 | LMO3 | 7.86 × 10⁻⁶ | 0.626 | 6.96 × 10⁻⁴ | 0.057 | T | ++++++−−++++ |
| rs8071899 | 17 | 67.93 | 0.06 | KCNJ16 | 5.12 × 10⁻⁶ | 0.512 | 0.001 | −0.090 | A | −−−−−++−−+−+ |
| rs12996362 | 2 | 130.23 | 0.23 | 6.71 × 10⁻⁶ | 0.784 | 0.004 | −0.055 | A | −−−−−+−+++?− | |
| rs7386 | 11 | 62.43 | 0.45 | C11orf48 | 0.009 | 0.165 | 0.005 | −0.047 | A | −−−+−−+−−−?− |
| rs7117858 | 11 | 15.69 | 0.21 | SOX6 | 0.002 | 0.406 | 0.008 | −0.049 | A | −−−−−+−−−+−+ |
| rs10158553 | 1 | 206.62 | 0.29 | SRGAP2 | 4.55 × 10⁻⁴ | 0.513 | 0.018 | −0.047 | T | −−−−−?+??+?− |
| rs6774742 | 3 | 46.17 | 0.35 | 1.95 × 10⁻⁶ | 0.222 | 0.022 | −0.036 | T | −−−−−−++−+−+ | |
| rs6725384 | 2 | 130.43 | 0.22 | 4.15 × 10⁻⁵ | 0.470 | 0.023 | 0.039 | A | −++++−++−++− | |
| rs17140337 | 16 | 6.52 | 0.12 | RBFOX1 | 0.012 | 0.486 | 0.024 | 0.056 | C | −++++++−−−?+ |
| rs11648832 | 16 | 7.78 | 0.33 | 0.001 | 0.720 | 0.060 | 0.032 | A | −++++−−++−?− | |
| rs12041939 | 1 | 198.46 | 0.04 | ATP6V1G3 | 0.002 | 0.649 | 0.231 | 0.037 | A | +++++−−+−+?− |
| rs10258526 | 7 | 11.23 | 0.13 | PHF14 | 4.70 × 10⁻⁶ | 0.302 | 0.233 | −0.031 | C | −−?−−−++++++ |
| rs1566045 | 16 | 51.02 | 0.21 | 0.021 | 0.521 | 0.264 | −0.023 | T | −−−−−−+−++−+ | |
| rs818215 | 3 | 85.37 | 0.46 | CADM2 | 0.305 | 0.976 | 0.475 | −0.011 | T | −−−+−+++−+−− |
| rs1992965 | 3 | 54.08 | 0.15 | CABYRP1 | 0.051 | 0.016 | 0.485 | 0.015 | T | −−−−−++++−++ |
| rs760825 | 6 | 18.55 | 0.36 | MIR548A | 0.143 | 0.060 | 0.774 | −0.005 | A | +++−+−−−−−?+ |
Chromosomal position (Mb) based on human genome build 19, dbSNP build 37
Minor allele frequency (MAF) estimated from the Discovery Samples
Standardized beta coefficient
Effect directions by study: AFOS, Framingham, Indiana GWAS, TUK1, TUK23, CAMOS, GEOS, Indiana African-American, Indiana European-American, Fels, SAFOS, PEAK25.
+ indicates increased BMD, − indicates decreased BMD, ? indicates the SNP was not available for analysis; effects in each individual study are not necessarily significant
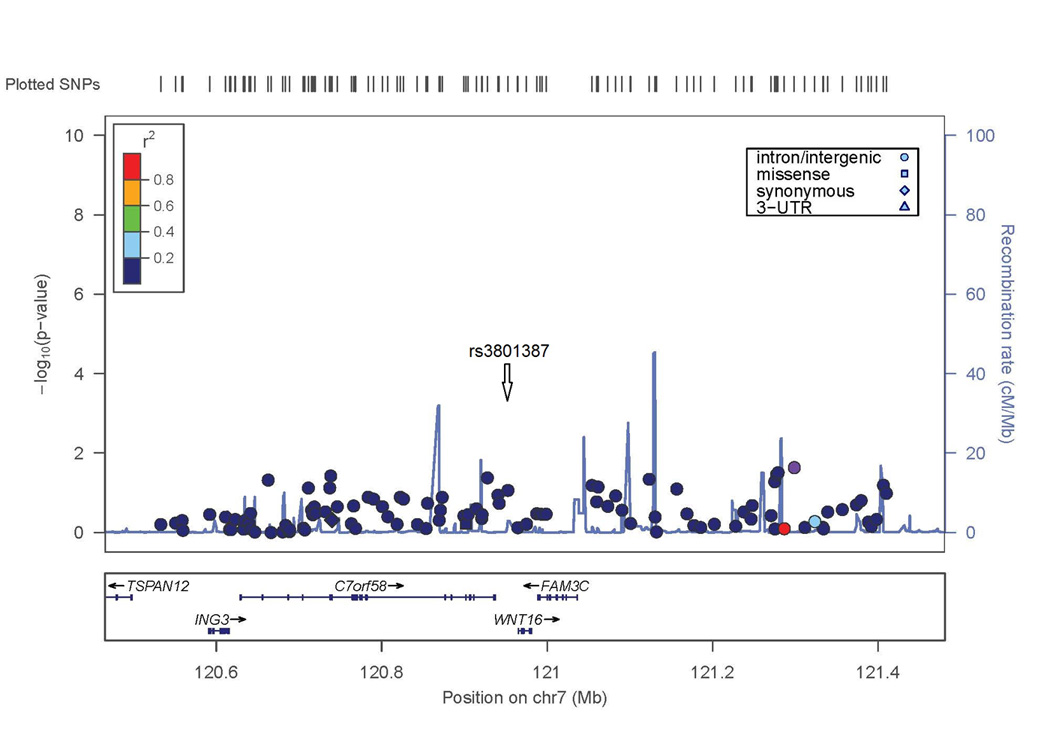
Two SNPs in the lumbar spine BMD GWAS exceeded conventional criteria for genome-wide significance (p<5 × 10⁻⁸). The most significant result was on chromosome 7 with a SNP in the last intron of WNT16 (rs3801387; p-value=1.7×10⁻⁹). The association extends to SNPs with similar minor allele frequency (MAF=0.26–0.29, p<10−7) across a linkage disequilibrium block containing WNT16 and the neighboring gene FAM3C (Figure 2A).
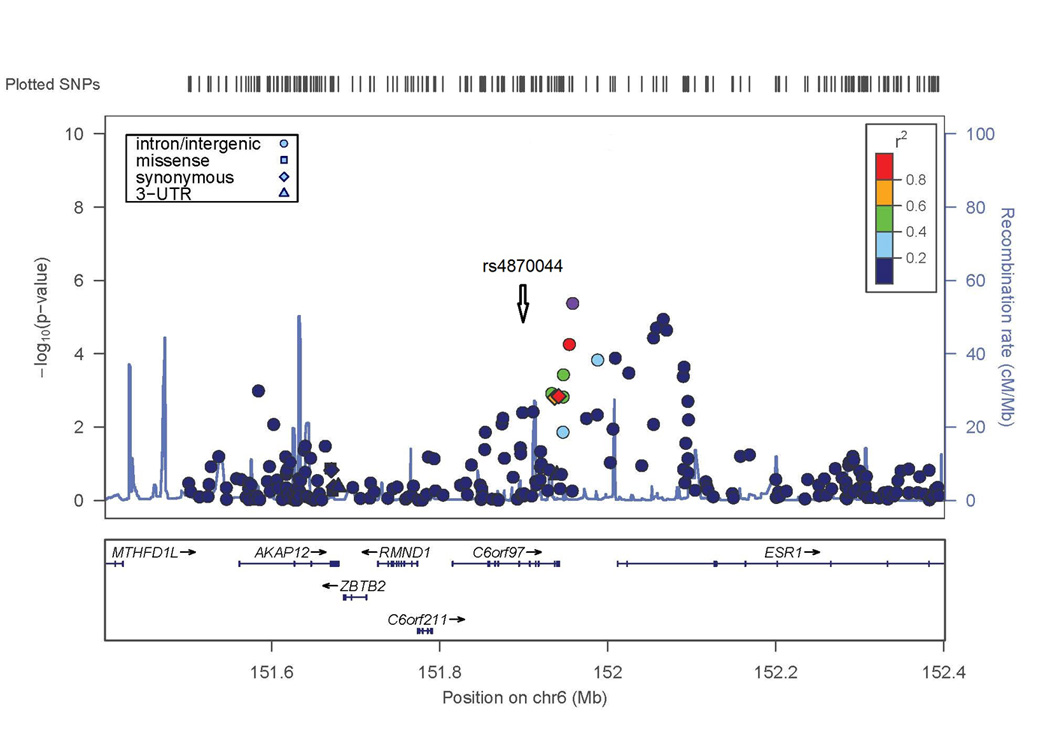
Figure 2. Evidence of association with lumbar spine BMD in WNT16/FAM3C and ESR1/C6orf97 chromosomal regions.
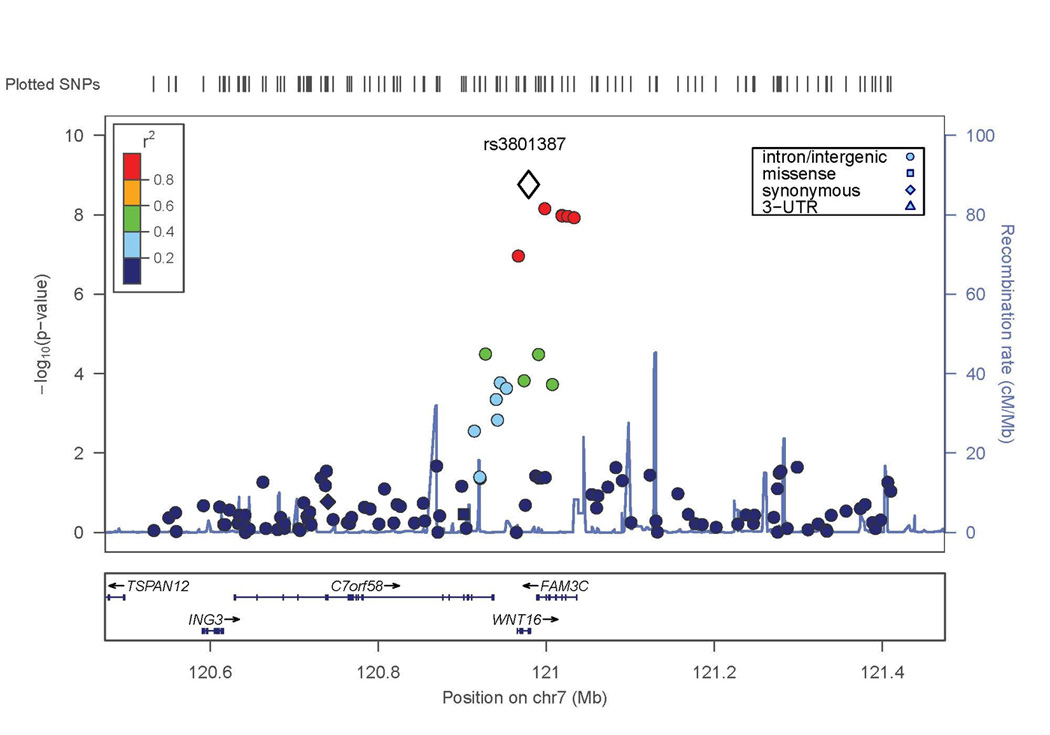
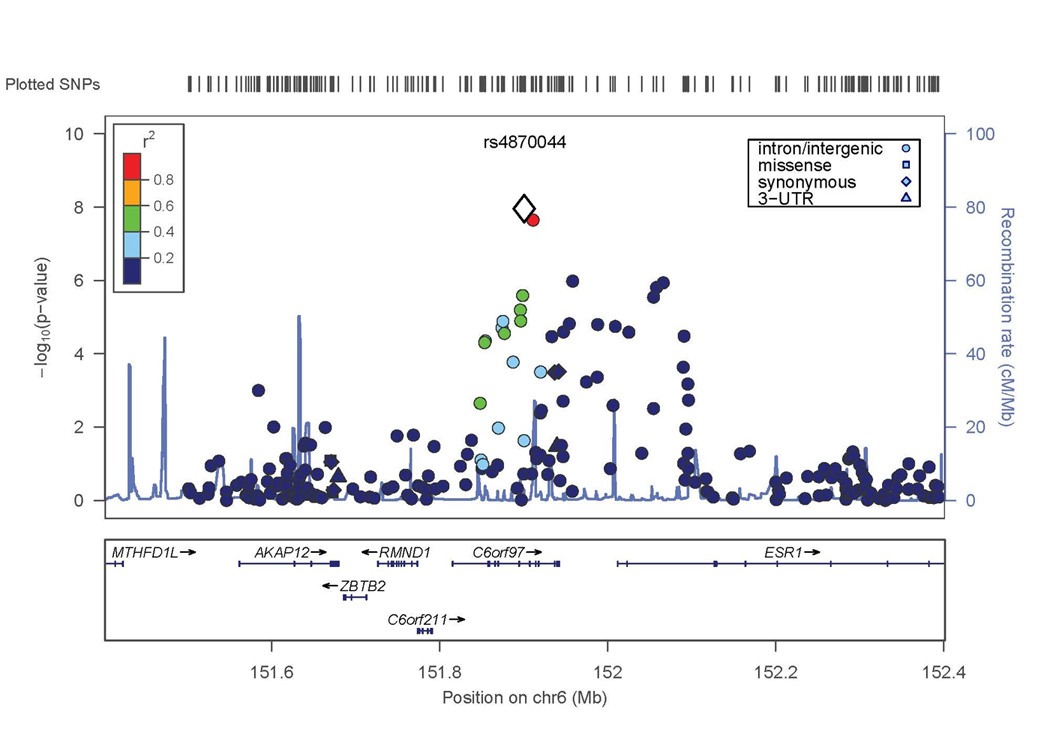
X axis is the physical position on the chromosome (Mb); Y-axis denotes the association test result as -log(p-value), with colored shading reflected degree of linkage disequilibrium with the top SNP in the region (white diamond symbol). A. SNP rs3801387 in the WNT16 region; B. SNP rs4870044 in the ESR1/C6orf97 region.
The second genome-wide significant result was obtained with a SNP on chromosome 6 in C6orf97 (rs4870044; p-value = 1.3 × 10⁻⁸). For the chromosome 6 region including ESR1 and C6orf97, the evidence for association extended to nearby SNPs with a range of MAF; these SNPs included rs6930633 (p=1.0 × 10⁻⁶; MAF=0.33) and rs2982575 (p=8.3 × 10⁻⁷; MAF=0.47, Figure 2B).
Several other SNPs associated with suggestive p-values of 5 × 10⁻⁵ or less were genotyped in the Replication Sample (Table 2). These included 2 additional SNPs in the ESR1/C6orf97 region, and 9 SNPs at genomic locations distinct from WNT16 and ESR1/C6orf97.
Discovery Sample – femoral neck BMD
Results from the GWAS meta-analysis of femoral neck BMD are presented in Figure 1B. Following double genomic control, there was no evidence of genomic inflation (genomic inflation factor = 1.003; Supplemental Figure 1B). Further details on SNPs with evidence of association are provided in Table 3. No SNPs in the femoral neck BMD GWAS exceeded conventional criteria for genome-wide significance.
Table 3.
Results for Premenopausal Femoral Neck BMD (Discovery Sample p<5×10⁻⁵ for any BMD site)
| SNP | Chr | Positiona | MAFb | Gene | Discovery P-value |
Replication P-value |
Joint P-value |
Joint Effectc |
Effect Allele |
Effect directiond,e |
|---|---|---|---|---|---|---|---|---|---|---|
| rs1566045 | 16 | 51.02 | 0.21 | 2.57 × 10⁻⁷ | 0.024 | 3.51 × 10⁻⁷ | −0.099 | T | −−−−−−−−−−−++ | |
| rs1992965 | 3 | 54.08 | 0.15 | CABYRP1 | 5.22 × 10⁻⁷ | 0.020 | 0.226 | −0.026 | T | −−−−−++−+++++ |
| rs17140337 | 16 | 6.52 | 0.12 | RBFOX1 | 6.04 × 10⁻⁷ | 0.316 | 5.24 × 10⁻⁵ | 0.093 | C | −++++++++−+?− |
| rs11648832 | 16 | 7.78 | 0.33 | RBFOX1 | 2.19 × 10⁻⁶ | 0.730 | 0.005 | 0.045 | A | −+++++−−++−?− |
| rs3801387 | 7 | 120.97 | 0.28 | WNT16 | 2.68 × 10⁻⁶ | 0.007 | 4.03 × 10⁻⁷ | −0.082 | T | −−−+−−−−+−−−− |
| rs12041939 | 1 | 198.46 | 0.04 | ATP6V1G3 | 3.63 × 10⁻⁶ | 0.653 | 0.007 | 0.082 | A | ++++++−−+++?− |
| rs818215 | 3 | 85.37 | 0.46 | CADM2 | 4.40 × 10⁻⁶ | 0.273 | 1.58 × 10⁻⁴ | −0.056 | T | −−−−−−+−+−−−− |
| rs7386 | 11 | 62.43 | 0.45 | C11orf48 | 6.12 × 10⁻⁶ | 0.035 | 4.93 × 10⁻⁶ | −0.072 | A | −−−−−−+−−−−?− |
| rs7117858 | 11 | 15.69 | 0.21 | SOX6 | 7.59 × 10⁻⁶ | 0.031 | 6.19 × 10⁻⁶ | −0.079 | A | −−−−−−−−+−−−+ |
| rs760825 | 6 | 18.55 | 0.36 | MIR548A1 | 8.21 × 10⁻⁶ | 0.468 | 0.013 | 0.039 | A | +++++−+−+−−?+ |
| rs10158553 | 1 | 206.62 | 0.29 | SRGAP2 | 8.77 × 10⁻⁶ | 0.318 | 0.009 | −0.048 | T | −−−−−+?+??+?− |
| rs10258526 | 7 | 11.23 | 0.13 | PHF14 | 3.24 × 10⁻⁵ | 0.500 | 0.323 | −0.025 | C | −−?−−−−+++−−+ |
| rs4870044 | 6 | 151.9 | 0.29 | C6orf97 | 4.11 × 10⁻⁴ | 0.006 | 1.02 × 10⁻⁵ | −0.070 | A | +−−−−−−−−−−−− |
| rs11247864 | 1 | 26.52 | 0.33 | CATSPER4 | 8.05 × 10⁻⁴ | 0.243 | 0.001 | −0.056 | T | −−−−−−?−??−+− |
| rs8071899 | 17 | 67.93 | 0.06 | KCNJ16 | 9.27 × 10⁻⁴ | 0.270 | 0.005 | −0.076 | A | −−−−−−++−−−−+ |
| rs6930633 | 6 | 151.96 | 0.33 | C6orf97 | 0.001 | 0.267 | 0.003 | 0.046 | A | ++++++−+−+−?+ |
| rs10784173 | 12 | 61.56 | 0.28 | PGBD3P1 | 0.002 | 0.832 | 0.036 | −0.039 | A | −−−−−−?+??−?+ |
| rs6774742 | 3 | 46.17 | 0.35 | 0.004 | 0.276 | 0.007 | −0.040 | T | −−−−−−+−+−−−+ | |
| rs16912067 | 12 | 16.77 | 0.32 | LMO3 | 0.007 | 0.471 | 0.229 | 0.019 | T | +++++++−−−++− |
| rs6725384 | 2 | 130.43 | 0.22 | 0.014 | 0.449 | 0.029 | 0.035 | A | −+++++−++−+−+ | |
| rs2982575 | 6 | 152.07 | 0.47 | ESR1 | 0.021 | 0.007 | 3.60 × 10⁻⁴ | −0.054 | T | −−−−−−−−−−+++ |
| rs12996362 | 2 | 130.23 | 0.23 | 0.034 | 0.043 | 0.003 | −0.053 | A | −−−−−−−−−++?− | |
| rs7258173 | 19 | 33.55 | 0.11 | RHPN2 | 0.056 | 0.010 | 0.001 | 0.075 | A | −++−++−+++??+ |
Chromosomal position (Mb) based on human genome build 19, dbSNP build 37
Minor allele frequency (MAF) estimated from the Discovery Samples
Standardized beta coefficient
Effect directions by study: AFOS, Framingham, Indiana GWAS, TUK1, TUK23, CAMOS, GEOS, Indiana African-American, Indiana European-American, Fels, SAFOS, PEAK25.
+ indicates increased BMD, − indicates decreased BMD, ? indicates the SNP was not available for analysis; effects in each individual study are not necessarily significant
Several SNPs had p-values making them eligible for consideration in the panel to be genotyped in the Replication Sample (p<5×10⁻⁵; Table 3). This included rs3801387 in WNT16 (p=2.68 × 10⁻⁶), which had already met our criteria for inclusion in the replication genotyping based on the results with the lumbar spine BMD phenotype (p=1.7×10⁻⁹). Several associations unique to the femoral neck BMD meta-analysis were also identified. These included rs1566045 on chromosome 16, 120 kb 5’ of LOC100652974 (p=2.57 × 10⁻⁷) and rs7386 on chromosome 11, 28 kb 5’ of METTL12 (p=6.12 × 10⁻⁶).
Replication and Joint Analysis
There were 5,597 women in the Replication Sample, of whom 4,158 were of European descent. Only femoral neck BMD was available for the ALSPAC cohort (Replication n=4,744 for lumbar spine BMD). A total of 23 SNPs in 20 distinct chromosomal regions were selected for genotyping in the Replication Sample. Results for the 23 SNPs are presented for lumbar spine BMD (Table 2) and femoral neck BMD (Table 3).
In the joint meta-analysis of both the Discovery and Replication Samples, the evidence for the lumbar BMD association with SNPs in WNT16 and ESR1/C6orf97 became more significant. In the WNT16 region, the p-value in the Joint Analysis for rs3801387 was 1.3 × 10⁻¹¹ (Table 2). In the ESR1/C6orf97 region, the p-value for rs4870044 improved to 1.4 × 10⁻¹⁰ and another SNP, rs6930633, now met genome-wide significance (p = 1.16 × 10⁻⁸; Table 2). For most other SNPs, the Joint Analysis did not substantially improve the evidence of association observed in the Discovery Sample. Plots of the effect size estimates for each of the cohorts and for the Joint Analysis as a whole are provided for WNT16 SNP rs3801387 (Figure 3A) and for the SNPs in the ESR1/C6orf97 region (Figure 3B).
Figure 3. Effect sizes for all studies contributing to the meta-analysis for lumbar spine BMD.
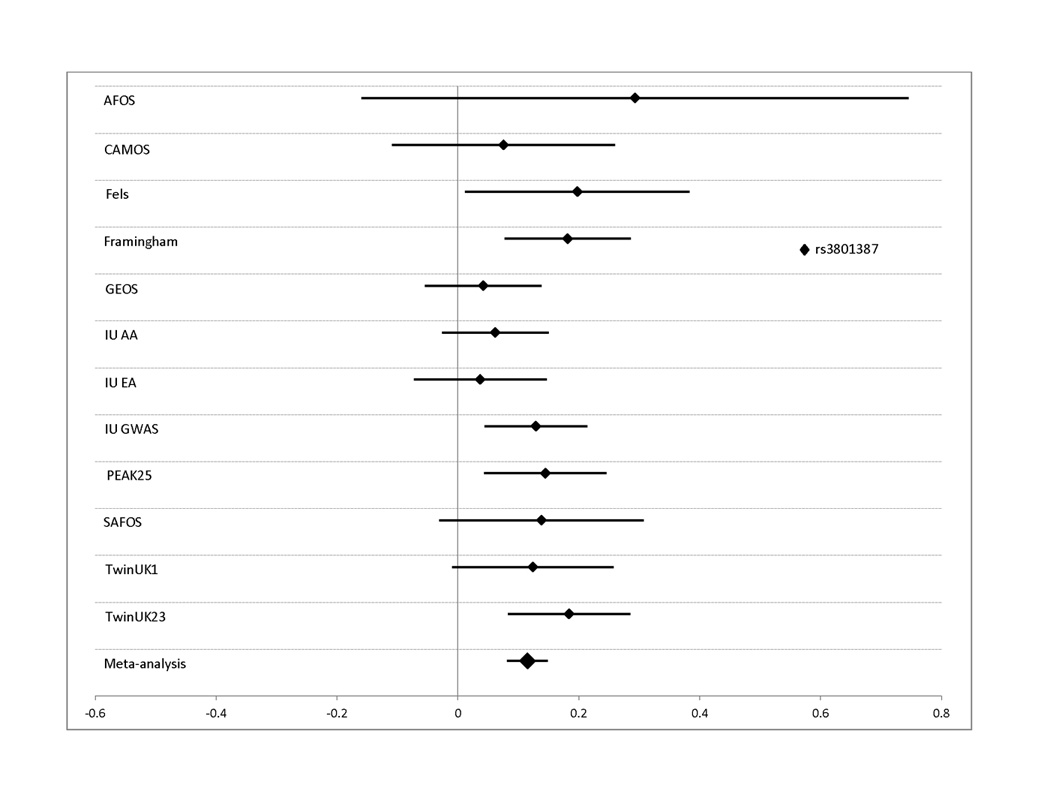
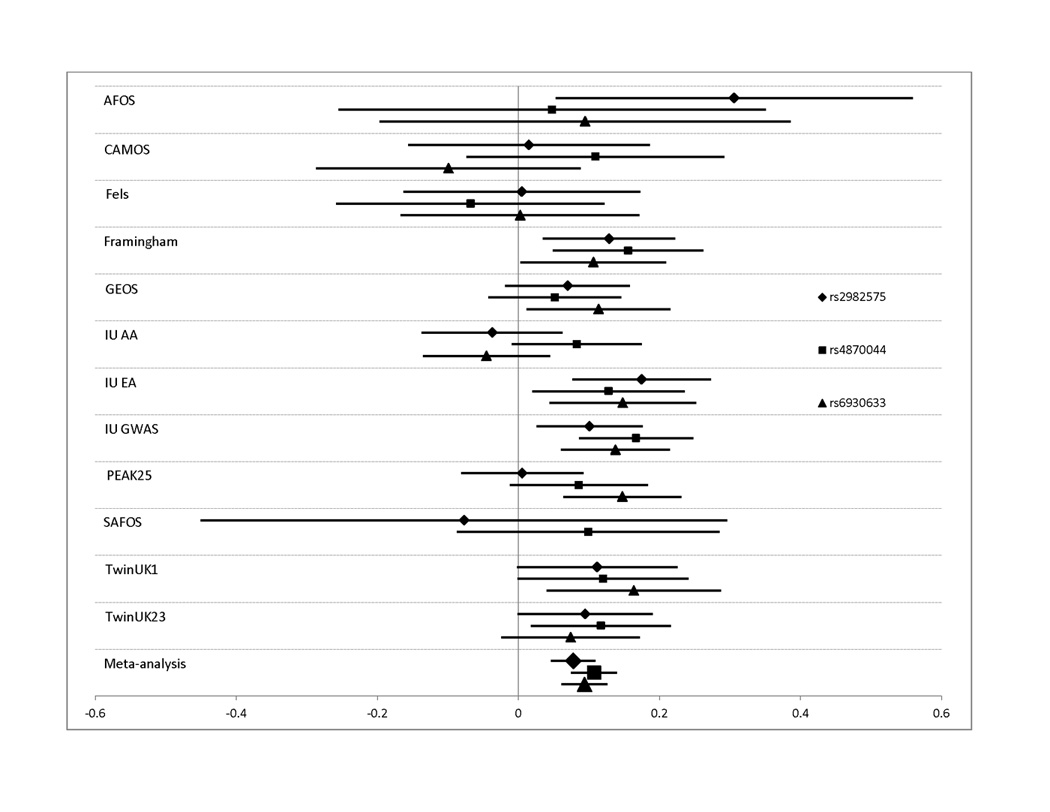
Effect sizes in standardized units (mean BMD=0, standard deviation=1) are shown along with their 95% confidence intervals for each individual study. The overall effect size estimate from the Joint meta-analysis is indicated in the bottom bar. Results are shown for SNPs: A. rs3801387 in WNT16; B. rs487004, rs6930633; and rs2982575 in the C6orf97/ESR1 region. In panel B, effect sizes are shown as positive quantities for ease of comparison.
The Joint Analysis of the femoral neck BMD phenotype (Table 3) did not result in any SNPs achieving genome-wide significance. However, for several SNPs (rs3801387 in WNT16 and rs4870044 in the ESR1/C6orf97 region) the evidence for association improved following the Joint Analysis (p = 4.3 × 10⁻⁷ and 1.0 × 10⁻⁵, respectively; Table 3).
The Replication Sample included an African American and a Hispanic cohort. Given the potential heterogeneity that could be introduced with their inclusion, we performed the Joint Analysis without these cohorts included. The sample now including 8,219 Caucasian and non-Hispanic subjects (85% of the original) yielded similar association results, although for a few SNPs, the evidence of association was substantially improved (ESR1, rs6930633: p = 8.9 × 10⁻¹¹ and rs2982575: p=4.6 × 10⁻⁸).
Conditional analysis
Conditional analyses were performed to determine whether the associations detected at the WNT16 or C6orf97 loci might be the result of multiple independent genetic factors in these regions. For WNT16, including the SNP (rs3801387) with the most significant lumbar spine BMD GWAS p-value as a covariate in association analysis resulted in nearly complete reduction of the association signal in this region (compare Figures 2A and 4A), suggesting that there is no evidence for a second, independent genetic factor in this region. In contrast, for the ESR1/C6orf97 region, the evidence of association with the other SNPs in the region was largely unaffected when conditioning on any of the 3 individual SNPs from this region included in the replication set (compare Figure 2B and Figures 4B–D). This supports the hypothesis that there is more than one genetic factor influencing peak BMD in the ESR1/C6orf97 region. Similar results were observed in the Replication Sample and Joint Analysis when the same 3 SNPs were analyzed (Table 4 and Supplemental Figure 2).
Figure 4. Results from conditional analysis of lumbar spine BMD with GWAS SNPs in the WNT16 and ESR1/C6orf97 regions.
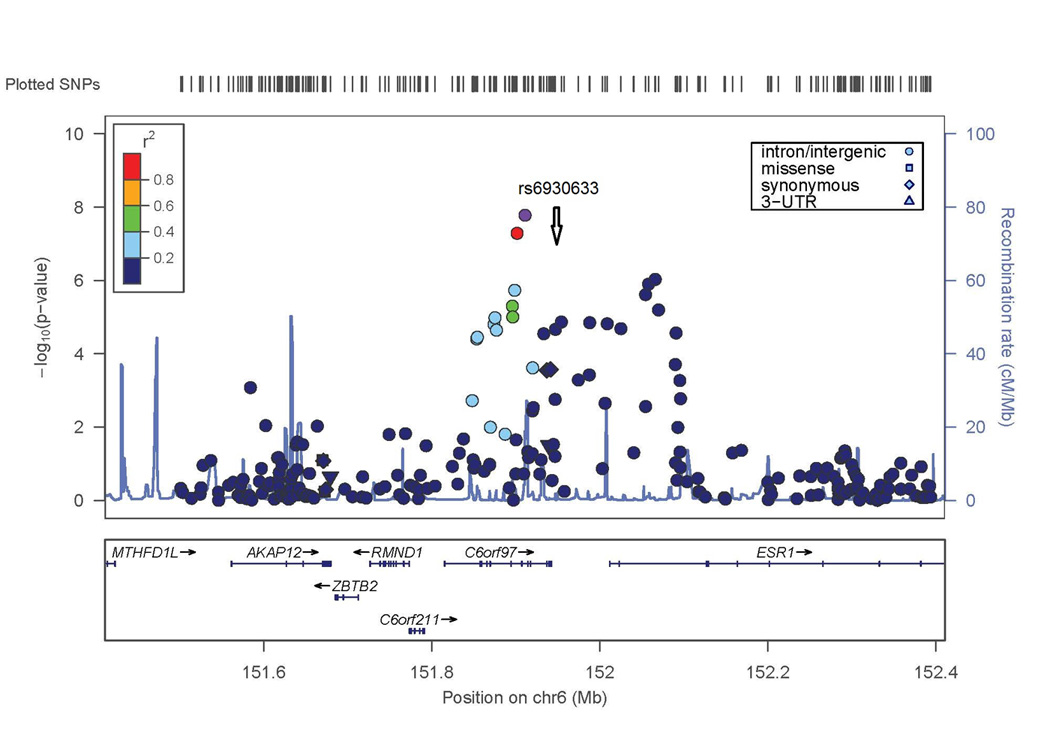
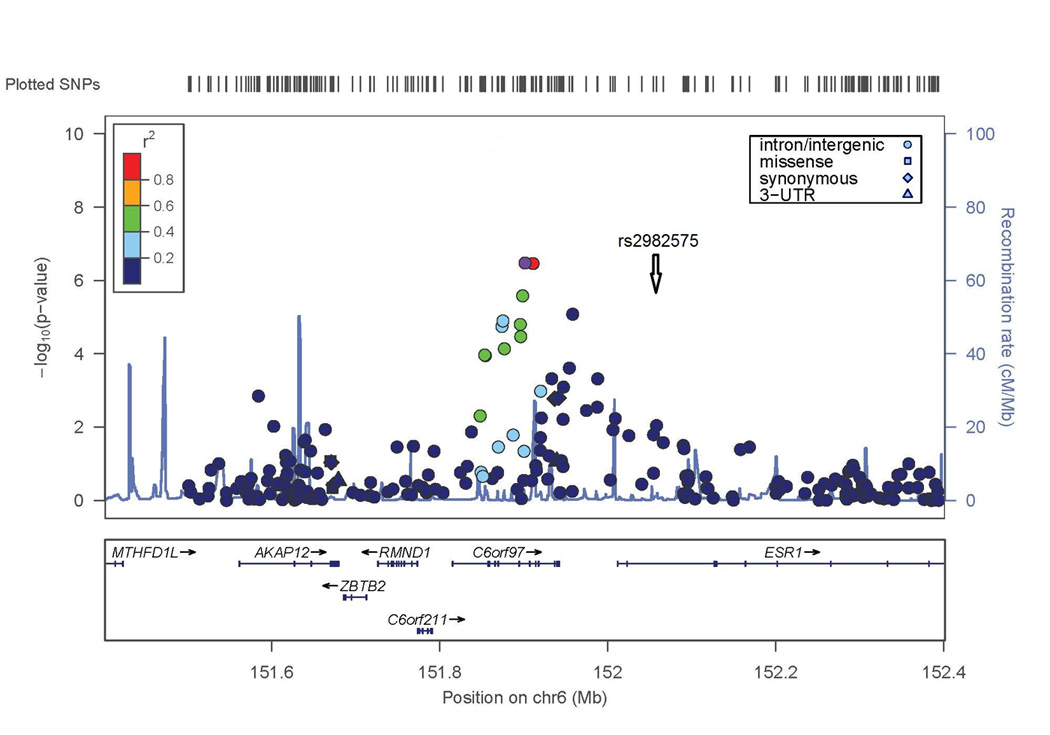
−log(p-value) is shown for SNPs in these regions. Degree of linkage disequilibrium with the SNP with highest remaining −log(p-value) after conditioning (indicated by white diamond symbol) is shown according to the color scale at top left or top right. A) SNPs in WNT16 region conditioned on SNP rs3801387 (compare to Figure 2A). B–D) SNPs in ESR1/C6orf97 region conditioned on SNPs rs487004, rs6930633; and rs2982575 respectively (compare to Figure 2B).
Table 4.
Conditional Analysis for lumbar spine BMD with SNPs in the ESR1/C6orf97 Region
| SNP | Analysis | Discovery Sample |
Replication Sample | Joint analysis |
|---|---|---|---|---|
| rs4870044 | Original P-valuea | 1.32 × 10⁻⁸ | 5.17 × 10⁻⁴ | 1.40 × 10⁻¹⁰ |
| Conditional P-valueb | 9.05 × 10⁻⁷ | 0.003 | 3.31 × 10⁻⁸ | |
| rs6930633 | Original P-value | 1.03 × 10⁻⁶ | 0.001 | 1.16 × 10⁻⁸ |
| Conditional P-value | 2.83 × 10⁻⁵ | 0.001 | 1.62 × 10⁻⁷ | |
| rs2982575 | Original P-value | 8.27 × 10⁻⁷ | 4.01 × 10⁻² | 8.85 × 10⁻⁷ |
| Conditional P-value | 1.33 × 10⁻⁴ | 0.19 | 3.07 × 10⁻⁴ |
Result from association analysis without additional SNP covariates
Result from analysis with genotypes for the other two ESR1/C6orf97 SNPs as covariates
Discussion
This is the first GWAS analysis of an exclusively premenopausal female sample to identify genes associated with peak BMD. The two-stage design included an initial Discovery stage consisting of genome-wide analysis of a sample of premenopausal women of European descent for lumbar spine and femoral neck BMD phenotypes. This was followed by a second-stage analysis of 23 SNPs in a Replication Sample using the same BMD phenotypes. The Replication Sample was more diverse and included women of European, Hispanic-American, and African-American descent. We identified SNP associations in the Discovery Sample that reached genome-wide significance. The joint analysis of the Discovery and Replication Samples resulted in greater evidence of association for three SNPs in two distinct regions (WNT16 and ESR1/C6orf97). For two SNPs in ESR1, the evidence of association improved substantially when the analysis was limited to only the Caucasian, non-Hispanic cohorts.
We found the greatest evidence for association in this study between lumbar spine BMD and the SNP rs3801387, in the last intron of the WNT16 gene. The evidence of association extended to SNPs in linkage disequilibrium with rs3801387 in the neighboring gene, FAM3C (Figure 2A), which encodes a less well-characterized interleukin-like molecule. Suggestive evidence of association to this region was also observed in analyses of femoral neck BMD, suggesting an effect on BMD at multiple skeletal sites.
WNT16 is a member of the Wnt-frizzled signaling pathway, and is believed to be a ligand for transmembrane receptors of the frizzled gene family.(13). Functionally, Wnt16 is involved in specification of the sclerotomal somite compartment, which houses vertebral and vascular smooth muscle cell precursors and has been proposed to signal via the non-canonical pathway(24), which is conserved in vertebrates. Wnt16 knockout mice have reduced bone strength and increased susceptibility to fracture(25). SNPs in the human WNT16/FAM3C region, and rs3801387 in particular, have been associated with BMD and bone phenotypes at other skeletal sites, including total body and skull BMD(26), as well as radial BMD, cortical thickness of the tibia as measured by pQCT and forearm fracture.(25) SNPs in WNT16 have also been associated with bone phenotypes across the human lifespan. Previous studies have shown an association with BMD in early childhood(26) and in heterogeneous samples primarily composed of elderly individuals of European descent.(13) The effect size observed for rs3801387 association in our Joint Analysis with lumbar spine BMD is larger than that observed for lumbar spine BMD in the large sample of primarily older women from the GEFOS consortium reported by Estrada et al(13). A similar trend is observed for estimated effect sizes of top SNPs from our study with those observed in the larger, more heterogeneous sample (Table 5). This suggests that earlier periods of life might be important with respect to which genetic variants in WNT16 and other BMD genes identified by the GWAS approach have a lasting effect.
Table 5.
Comparison of SNP effect sizes for BMD between this study and Estrada et al (2012)
| Lumbar spine BMD | Femur neck BMD | |||||||
|---|---|---|---|---|---|---|---|---|
| Premenopausal | GEFOS2a | Premenopausal | GEFOS2a | |||||
| SNP | Locus | Gene | P-value | Beta | Beta | P-value | Beta | Beta |
| rs3801387 | 7q31.31 | WNT16 | 1.69 × 10⁻⁹ | −0.16 | −0.11 | 2.68 × 10⁻⁶ | −0.12 | −0.08 |
| rs4869742 | 6q25.1 | C6orf97 | 1.37 × 10⁻⁸ | −0.14 | −0.07 | 3.81 × 10⁻⁴ | −0.09 | −0.05 |
| rs1566045 | 16q12.1 | SALL1 | 0.021 | −0.07 | −0.02 | 2.57 × 10⁻⁷ | −0.16 | −0.06 |
| rs7108738 | 11p15.2 | SOX6 | 0.002 | −0.09 | −0.03 | 1.32 × 10⁻⁵ | −0.13 | −0.08 |
| rs12821008 | 12q13.12 | DHH | 7.56 × 10⁻⁵ | .0.09 | .0.04 | 0.015 | .0.06 | .0.03 |
Effect size observed for this SNP and BMD site in joint (stage 1 + stage 2) analysis of females (Supplemental Tables 5A and 5B, Estrada et al, 2012)
Two recent studies(25,26) have detected multiple independent genetic factors at WNT16 contributing to BMD at skeletal sites not examined in our study, total body and radial BMD. In our conditional analyses, we did not detect evidence to support a second independent genetic factor in that region influencing peak spine BMD. However, our study was not sufficiently powered to exclude the presence of a second signal in this region.
We also detected significant evidence of association with lumbar spine BMD and SNPs in the chromosomal region encompassing the ESR1, estrogen receptor alpha gene. ESR1 has multiple isoforms and a distinct, non-overlapping open reading frame near its 5’ terminus, named C6orf97, whose biological role is poorly understood. The SNPs associated with lumbar spine BMD are located within the C6orf97 sequence or the non-coding region 5’ of the longer ESR1 isoforms. Other investigators have reported complex patterns of association with genetic variants at or near the ESR1 locus with bone-related phenotypes such as radial BMD and heel ultrasound parameters.(27) ESR1 encodes a nuclear transcription factor, with evidence suggesting a possible skeletal role in periosteal mechanosensitivity and expansion.(28,29)
Because the chromosome 6 SNPs associated with lumbar spine BMD had differing MAF (0.29, 0.33 and 0.49) and low levels of linkage disequilibrium between them, we performed conditional association analysis to test whether these SNPs represented independent genetic factors influencing peak BMD. Association results were unchanged when either of the two nearby ESR1/C6orf97 SNPs was included in the association model along with the SNP under consideration. This confirms the finding of the prior study on radius and heel BMD phenotypes(27) that there are multiple independent factors in this chromosomal region. These results are also consistent with the results from Estrada et al,(13) who detected a second association achieving genome-wide significance in the ESR1 region in a more heterogeneous sample of men and women with a wider age range. Investigators of common-variant associations with complex disease should continue to pursue detailed analyses of key findings using conditional analyses and other approaches to enable the most complete dissection possible of the role of common variants in complex diseases.
The association results were less significant for femoral neck than for lumbar spine BMD. This may be due to several factors. First, our analyses tended to identify smaller effect sizes for femoral neck BMD as compared with lumbar spine BMD for the same SNPs (Table 5), suggesting we have lower power to detect associations with femoral neck BMD. Second, there are higher measurement errors at the femoral neck skeletal site. Third, the age range of subjects in our analyses were further beyond the typical age of peak bone mass at the femoral neck than at the lumbar spine; peak lumbar spine bone mass occurs at 33- 40 years in women, while femoral neck peak bone mass occurs earlier (16–19 years).(15) This suggests that even though we included only premenopausal women, the femoral neck BMD may be influenced by both bone acquisition and bone loss. Fourth, the spine and femoral neck sites could be differentially affected by lifestyle factors such as weight-bearing or high-impact exercise. However, suggestive p-values for several SNPs were observed at both sites, notably for SNPs in the WNT16 and ESR1 regions, suggesting effects of variants at these loci across both BMD phenotypes.
We also compared our results with those obtained in the largest BMD GWAS meta-analysis published to date from the GEFOS consortium(13), which analyzed men and women across a wide age range. The two genes in which we identified SNPs with genome-wide evidence of association, WNT16 and C6orf97/ESR1, also contained SNPs associated with BMD in the GEFOS study. As shown in Table 5, we generally did not find strong evidence that the same SNPs in these genes were associated with BMD in the current study as in the GEFOS paper(13) ; and only 4 of the 56 loci detected in the joint female GEFOS analysis(13) were observed to have p-values below 5 × 10⁻⁵ in the present study for one or both BMD phenotypes (Supplemental Table 1). This may be due to several factors. One might be that some genes contribute to BMD variation primarily in premenopausal women. Another factor could be that because we limited our sample to premenopausal women, we had limited power to detect genetic factors of small effect. The Discovery Sample used in our study had 67% power at our inclusion threshold to detect associations of similar effect (standardized regression coefficient = 0.10) to the larger effects observed in the much larger meta-analysis of Estrada et al(13) for common SNPs (MAF=0.30–0.40). Thus, we were reasonably powered to detect SNP associations that were at least as large as those identified in the phenotypically more heterogeneous GEFOS study, but may not have been powered to detect these effects if they were smaller in our sample.
In conclusion, we identified SNPs in two genes that were significantly associated with BMD in premenopausal women, who are likely to be at or around peak BMD. These genes have been previously reported to affect BMD at the same skeletal sites in heterogeneous samples of older and younger subjects. Importantly, there is evidence in premenopausal women to support allelic heterogeneity in ESR1. Future studies will focus on the identification of the genetic variants that underlie these replicated associations.
Supplementary Material
Acknowledgements
Authors’ roles:
Study design: DLK, DK, MJE, BDM, JBR, DPK, TF
Study conduct: SG, SAC, ACC, FR, JHT, KA, MJE, BDM, JBR, DPK
Data collection: FM, SG, MP, SAC, NJT, DAL, BT, TDS, FR, JCP, MAC, JHT, KA, MJE, BDM, JBR, DPK
Data analysis: DLK, HFZ, LYA, CTL, FM, JPK, SG, DL, SAC, JB
Data interpretation: All
Drafting manuscript: DLK, TF
Revising manuscript content: All
Approving final version of manuscript: All
DLK and TF take responsibility for the integrity of the data analysis.
These studies were supported by R01AG041517, M01 RR-00750, R01AR/AG41398, R01R050066, N01-HC-25195, N02-HL-6-4278, R01AR043351, P01HL045522, R01MH078111, R01MH083824, R01HD012252, R01AR052147, R01DK064391, R01AR43351, R01AG18728, R01HL088119, R01AR046838, U01 HL084756, P30DK072488, and F32AR059469. Genotyping was provided by CIDR (HHSN268200782096C). Support was also provided by the Canadian Institutes of Health Research (CIHR); Merck Frosst Canada Ltd.; Eli Lilly Canada Inc.; Novartis Pharmaceuticals Inc.; The Alliance: Sanofi-Aventis & Procter and Gamble Pharmaceuticals Canada Inc.; Servier Canada Inc.; Amgen Canada Inc.; The Dairy Farmers of Canada; and The Arthritis Society. Drs. Richards and Zheng are supported by the CIHR, the Lady Davis Institute, Fonds de Rechercheen Santé du Québec, Ministere Développement Économique, Innovation et Exportation du Québec, the UK Medical Research Council (092731) and Wellcome Trust (092731; WT088806), British Heart Foundation (SP/07/008/24066), European Commission Framework (FP7/2007–2013), ENGAGE project HEALTH-F4-2007-201413, FP5 GenomEUtwin Project (QLG2-CT-2002-01254), Arthritis Research Campaign, Chronic Disease Research Foundation, and a gift from the AT&T Foundation, C06 RR017515. The National Institute for Health Research (NIHR) comprehensive Biomedical Research Centre award to Guy’s and St Thomas’ NHS Foundation Trust in partnership with King’s College London, and a Biotechnology and Biological Sciences Research Council project grant (G20234).
Footnotes
DISCLOSURE PAGE
All authors state that they have no conflicts of interest.
REFERENCES
- 1.Gass M, Dawson-Hughes B. Preventing osteoporosis-related fractures: an overview. Am J Med. 2006;119:S3–S11. doi: 10.1016/j.amjmed.2005.12.017. [DOI] [PubMed] [Google Scholar]
- 2.Brown LB, Streeten EA, Shapiro JR, McBride D, Shuldiner AR, Peyser PA, Mitchell BD. Genetic and environmental influences on bone mineral density in pre- and post-menopausal women. Osteoporos Int. 2005;16:1849–1856. doi: 10.1007/s00198-005-1948-7. [DOI] [PMC free article] [PubMed] [Google Scholar]
- 3.Christian JC, Yu PL, Slemenda CW, Johnston CC., Jr Heritability of bone mass: a longitudinal study in aging male twins. Am J Hum Genet. 1989;44:429–433. [PMC free article] [PubMed] [Google Scholar]
- 4.Kelly PJ, Nguyen T, Hopper J, Pocock N, Sambrook P, Eisman J. Changes in axial bone density with age: a twin study. J Bone Miner Res. 1993;8:11–17. doi: 10.1002/jbmr.5650080103. [DOI] [PubMed] [Google Scholar]
- 5.Cho YS, Go MJ, Kim YJ, Heo JY, Oh JH, Ban HJ, Yoon D, Lee MH, Kim DJ, Park M, Cha SH, Kim JW, Han BG, Min H, Ahn Y, Park MS, Han HR, Jang HY, Cho EY, Lee JE, Cho NH, Shin C, Park T, Park JW, Lee JK, Cardon L, Clarke G, McCarthy MI, Lee JY, Oh B, Kim HL. A large-scale genome-wide association study of Asian populations uncovers genetic factors influencing eight quantitative traits. Nat Genet. 2009;41:527–534. doi: 10.1038/ng.357. [DOI] [PubMed] [Google Scholar]
- 6.Duncan EL, Danoy P, Kemp JP, Leo PJ, McCloskey E, Nicholson GC, Eastell R, Prince RL, Eisman JA, Jones G, Sambrook PN, Reid IR, Dennison EM, Wark J, Richards JB, Uitterlinden AG, Spector TD, Esapa C, Cox RD, Brown SD, Thakker RV, Addison KA, Bradbury LA, Center JR, Cooper C, Cremin C, Estrada K, Felsenberg D, Gluer CC, Hadler J, Henry MJ, Hofman A, Kotowicz MA, Makovey J, Nguyen SC, Nguyen TV, Pasco JA, Pryce K, Reid DM, Rivadeneira F, Roux C, Stefansson K, Styrkarsdottir U, Thorleifsson G, Tichawangana R, Evans DM, Brown MA. Genome-wide association study using extreme truncate selection identifies novel genes affecting bone mineral density and fracture risk. PLoS Genet. 2011;7 doi: 10.1371/journal.pgen.1001372. e1001372. [DOI] [PMC free article] [PubMed] [Google Scholar]
- 7.Hsu YH, Zillikens MC, Wilson SG, Farber CR, Demissie S, Soranzo N, Bianchi EN, Grundberg E, Liang L, Richards JB, Estrada K, Zhou Y, van Nas A, Moffatt MF, Zhai G, Hofman A, van Meurs JB, Pols HA, Price RI, Nilsson O, Pastinen T, Cupples LA, Lusis AJ, Schadt EE, Ferrari S, Uitterlinden AG, Rivadeneira F, Spector TD, Karasik D, Kiel DP. An integration of genome-wide association study and gene expression profiling to prioritize the discovery of novel susceptibility Loci for osteoporosis-related traits. PLoS Genet. 2010;6 doi: 10.1371/journal.pgen.1000977. e1000977. [DOI] [PMC free article] [PubMed] [Google Scholar]
- 8.Richards JB, Rivadeneira F, Inouye M, Pastinen TM, Soranzo N, Wilson SG, Andrew T, Falchi M, Gwilliam R, Ahmadi KR, Valdes AM, Arp P, Whittaker P, Verlaan DJ, Jhamai M, Kumanduri V, Moorhouse M, van Meurs JB, Hofman A, Pols HA, Hart D, Zhai G, Kato BS, Mullin BH, Zhang F, Deloukas P, Uitterlinden AG, Spector TD. Bone mineral density, osteoporosis, and osteoporotic fractures: a genome-wide association study. Lancet. 2008;371:1505–1512. doi: 10.1016/S0140-6736(08)60599-1. [DOI] [PMC free article] [PubMed] [Google Scholar]
- 9.Styrkarsdottir U, Halldorsson BV, Gretarsdottir S, Gudbjartsson DF, Walters GB, Ingvarsson T, Jonsdottir T, Saemundsdottir J, Center JR, Nguyen TV, Bagger Y, Gulcher JR, Eisman JA, Christiansen C, Sigurdsson G, Kong A, Thorsteinsdottir U, Stefansson K. Multiple genetic loci for bone mineral density and fractures. N Engl J Med. 2008;358:2355–2365. doi: 10.1056/NEJMoa0801197. [DOI] [PubMed] [Google Scholar]
- 10.Styrkarsdottir U, Halldorsson BV, Gretarsdottir S, Gudbjartsson DF, Walters GB, Ingvarsson T, Jonsdottir T, Saemundsdottir J, Snorradottir S, Center JR, Nguyen TV, Alexandersen P, Gulcher JR, Eisman JA, Christiansen C, Sigurdsson G, Kong A, Thorsteinsdottir U, Stefansson K. New sequence variants associated with bone mineral density. Nat Genet. 2009;41:15–17. doi: 10.1038/ng.284. [DOI] [PubMed] [Google Scholar]
- 11.Timpson NJ, Tobias JH, Richards JB, Soranzo N, Duncan EL, Sims AM, Whittaker P, Kumanduri V, Zhai G, Glaser B, Eisman J, Jones G, Nicholson G, Prince R, Seeman E, Spector TD, Brown MA, Peltonen L, Smith GD, Deloukas P, Evans DM. Common variants in the region around Osterix are associated with bone mineral density and growth in childhood. Hum Mol Genet. 2009;18:1510–1517. doi: 10.1093/hmg/ddp052. [DOI] [PMC free article] [PubMed] [Google Scholar]
- 12.Xiong DH, Liu XG, Guo YF, Tan LJ, Wang L, Sha BY, Tang ZH, Pan F, Yang TL, Chen XD, Lei SF, Yerges LM, Zhu XZ, Wheeler VW, Patrick AL, Bunker CH, Guo Y, Yan H, Pei YF, Zhang YP, Levy S, Papasian CJ, Xiao P, Lundberg YW, Recker RR, Liu YZ, Liu YJ, Zmuda JM, Deng HW. Genome-wide association and follow-up replication studies identified ADAMTS18 and TGFBR3 as bone mass candidate genes in different ethnic groups. Am J Hum Genet. 2009;84:388–398. doi: 10.1016/j.ajhg.2009.01.025. [DOI] [PMC free article] [PubMed] [Google Scholar]
- 13.Estrada K, Styrkarsdottir U, Evangelou E, Hsu YH, Duncan EL, Ntzani EE, Oei L, Albagha OM, Amin N, Kemp JP, Koller DL, Li G, Liu CT, Minster RL, Moayyeri A, Vandenput L, Willner D, Xiao SM, Yerges-Armstrong LM, Zheng HF, Alonso N, Eriksson J, Kammerer CM, Kaptoge SK, Leo PJ, Thorleifsson G, Wilson SG, Wilson JF, Aalto V, Alen M, Aragaki AK, Aspelund T, Center JR, Dailiana Z, Duggan DJ, Garcia M, Garcia-Giralt N, Giroux S, Hallmans G, Hocking LJ, Husted LB, Jameson KA, Khusainova R, Kim GS, Kooperberg C, Koromila T, Kruk M, Laaksonen M, Lacroix AZ, Lee SH, Leung PC, Lewis JR, Masi L, Mencej-Bedrac S, Nguyen TV, Nogues X, Patel MS, Prezelj J, Rose LM, Scollen S, Siggeirsdottir K, Smith AV, Svensson O, Trompet S, Trummer O, van Schoor NM, Woo J, Zhu K, Balcells S, Brandi ML, Buckley BM, Cheng S, Christiansen C, Cooper C, Dedoussis G, Ford I, Frost M, Goltzman D, Gonzalez-Macias J, Kahonen M, Karlsson M, Khusnutdinova E, Koh JM, Kollia P, Langdahl BL, Leslie WD, Lips P, Ljunggren O, Lorenc RS, Marc J, Mellstrom D, Obermayer-Pietsch B, Olmos JM, Pettersson-Kymmer U, Reid DM, Riancho JA, Ridker PM, Rousseau F, Lagboom PE, Tang NL, et al. Genome-wide meta-analysis identifies 56 bone mineral density loci and reveals 14 loci associated with risk of fracture. Nat Genet. 2012;44:491–501. doi: 10.1038/ng.2249. [DOI] [PMC free article] [PubMed] [Google Scholar]
- 14.Rivadeneira F, Styrkarsdottir U, Estrada K, Halldorsson BV, Hsu YH, Richards JB, Zillikens MC, Kavvoura FK, Amin N, Aulchenko YS, Cupples LA, Deloukas P, Demissie S, Grundberg E, Hofman A, Kong A, Karasik D, van Meurs JB, Oostra B, Pastinen T, Pols HA, Sigurdsson G, Soranzo N, Thorleifsson G, Thorsteinsdottir U, Williams FM, Wilson SG, Zhou Y, Ralston SH, van Duijn CM, Spector T, Kiel DP, Stefansson K, Ioannidis JP, Uitterlinden AG. Twenty bone-mineral-density loci identified by large-scale meta-analysis of genome-wide association studies. Nat Genet. 2009;41:1199–1206. doi: 10.1038/ng.446. [DOI] [PMC free article] [PubMed] [Google Scholar]
- 15.Berger C, Goltzman D, Langsetmo L, Joseph L, Jackson S, Kreiger N, Tenenhouse A, Davison KS, Josse RG, Prior JC, Hanley DA. Peak bone mass from longitudinal data: implications for the prevalence, pathophysiology, and diagnosis of osteoporosis. J Bone Miner Res. 2010;25:1948–1957. doi: 10.1002/jbmr.95. [DOI] [PMC free article] [PubMed] [Google Scholar]
- 16.Prior JC, Vigna YM, Schechter MT, Burgess AE. Spinal bone loss and ovulatory disturbances. N Engl J Med. 1990;323:1221–1227. doi: 10.1056/NEJM199011013231801. [DOI] [PubMed] [Google Scholar]
- 17.Riggs BL, Wahner HW, Melton LJ, 3rd, Richelson LS, Judd HL, Offord KP. Rates of bone loss in the appendicular, axial skeletons of women. Evidence of substantial vertebral bone loss before menopause. J Clin Invest. 1986;77:1487–1491. doi: 10.1172/JCI112462. [DOI] [PMC free article] [PubMed] [Google Scholar]
- 18.Murad MH, Drake MT, Mullan RJ, Mauck KF, Stuart LM, Lane MA, Abu Elnour NO, Erwin PJ, Hazem A, Puhan MA, Li T, Montori VM. Comparative Effectiveness of Drug Treatments to Prevent Fragility Fractures: A Systematic Review and Network Meta-Analysis. J Clin Endocrinol Metab. 2012 Mar 30; doi: 10.1210/jc.2011-3060. [Epub ahead of print] [DOI] [PubMed] [Google Scholar]
- 19.Malkin I, Karasik D, Livshits G, Kobyliansky E. Modelling of age-related bone loss using cross-sectional data. Ann Hum Biol. 2002;29:256–270. doi: 10.1080/03014460110075729. [DOI] [PubMed] [Google Scholar]
- 20.Berger C, Langsetmo L, Joseph L, Hanley DA, Davison KS, Josse R, Kreiger N, Tenenhouse A, Goltzman D. Change in bone mineral density as a function of age in women and men and association with the use of antiresorptive agents. CMAJ. 2008;178:1660–1668. doi: 10.1503/cmaj.071416. [DOI] [PMC free article] [PubMed] [Google Scholar]
- 21.Koller DL, Ichikawa S, Lai D, Padgett LR, Doheny KF, Pugh E, Paschall J, Hui SL, Edenberg HJ, Xuei X, Peacock M, Econs MJ, Foroud T. Genome-wide association study of bone mineral density in premenopausal European-American women and replication in African-American women. J Clin Endocrinol Metab. 2010;95:1802–1809. doi: 10.1210/jc.2009-1903. [DOI] [PMC free article] [PubMed] [Google Scholar]
- 22.Streeten EA, Beck TJ, O'Connell JR, Rampersand E, McBride DJ, Takala SL, Pollin TI, Uusi-Rasi K, Mitchell BD, Shuldiner AR. Autosome-wide linkage analysis of hip structural phenotypes in the Old Order Amish. Bone. 2008;43:607–612. doi: 10.1016/j.bone.2008.04.005. [DOI] [PMC free article] [PubMed] [Google Scholar]
- 23.Willer CJ, Li Y, Abecasis GR. METAL: fast and efficient meta-analysis of genomewide association scans. Bioinformatics. 2010;26:2190–2191. doi: 10.1093/bioinformatics/btq340. [DOI] [PMC free article] [PubMed] [Google Scholar]
- 24.Clements WK, Kim AD, Ong KG, Moore JC, Lawson ND, Traver D. A somitic Wnt16/Notch pathway specifies haematopoietic stem cells. Nature. 2011;474:220–224. doi: 10.1038/nature10107. [DOI] [PMC free article] [PubMed] [Google Scholar]
- 25.Zheng H-F, Tobias JH, Duncan EL, Evans DM, Eriksson J, Patermoster L, Yerges-Armstrong LM, Lehtimaki T, Bergstrom U, Kahonen M, Leo PJ, Raitakari O, Laaksonen M, Nicholson GC, Viikari J, Ladouceur M, Lyytikainen L-P, Medina-Gomez C, Rivadeneira F, Prince RL, Sievanen H, Leslie WD, Mellstrom D, Eisman JA, Moverare-Skrtic S, Goltzman D, Jones G, St Pourcain B, Xiao Y, Timpson NJ, Smith GD, Reid IR, Ring SM, Sambrook PN, Karlsson M, Dennison EM, Kemp JP, Danoy P, Sayers A, Wilson SG, Nethander M, McCloskey E, Vandenput L, Eastell R, Liu J, Spector T, Mitchell BD, Streeten EA, Brommage R, Pettersson-Kymmer U, Brown MA, Ohlsson C, Richards JB, Lorentzon M. WNT16 influences bone mineral density, cortical bone thickness, bone strength, and osteoporotic fracture risk. PLoS Genetics. 2012;8 doi: 10.1371/journal.pgen.1002745. e1002745. [DOI] [PMC free article] [PubMed] [Google Scholar]
- 26.Medina-Gomez C, Kemp JP, Estrada K, Eriksson J, Liu J, Reppe S, Evans DM, Heppe D, Vanderschueren D, Herrera L, Ring SM, Kruithof C, Timpson NJ, Zillikens MC, Olstad OK, Zheng HF, Richards JB, Pourcain B, Hofman A, Jaddoe VW, Smith GD, Lorentzon M, Gautvik KM, Uitterlinden AG, Brommage R, Ohlsson C, Tobias JH, Rivadeneira F. Meta-analysis of Genome-Wide Scans for Total Body BMD in Children and Adults Reveals Allelic Heterogeneity and Age-Specific Effects at the WNT16 Locus. PLoS Genetics. 2012;8 doi: 10.1371/journal.pgen.1002718. e1002718. [DOI] [PMC free article] [PubMed] [Google Scholar]
- 27.Holliday KL, Pye SR, Thomson W, Boonen S, Borghs H, Vanderschueren D, Gielen E, Huhtaniemi IT, Adams JE, Ward KA, Bartfai G, Casanueva F, Finn JD, Forti G, Giwercman A, Han TS, Kula K, Labrie F, Lean ME, Pendleton N, Punab M, Wu FC, O'Neill TW. The ESR1 (6q25) locus is associated with calcaneal ultrasound parameters and radial volumetric bone mineral density in European men. PLoS One. 2011;6 doi: 10.1371/journal.pone.0022037. e22037. [DOI] [PMC free article] [PubMed] [Google Scholar]
- 28.Vico L, Vanacker JM. Sex hormones and their receptors in bone homeostasis: insights from genetically modified mouse models. Osteoporos Int. 2010;21:365–372. doi: 10.1007/s00198-009-0963-5. [DOI] [PubMed] [Google Scholar]
- 29.Windahl SH, Andersson G, Gustafsson JA. Elucidation of estrogen receptor function in bone with the use of mouse models. Trends Endocrinol Metab. 2002;13:195–200. doi: 10.1016/s1043-2760(02)00594-5. [DOI] [PubMed] [Google Scholar]
Associated Data
This section collects any data citations, data availability statements, or supplementary materials included in this article.