Abstract
Recently, lymphoblastoid cell lines (LCLs) have emerged as an innovative model system for mapping gene variants that predict dose response to chemotherapy drugs. In the current study, this strategy was expanded to the in vitro genome-wide association approach, using 516 LCLs derived from a Caucasian cohort to assess cytotoxic response to temozolomide. Genome-wide association analysis using approximately 2.1 million quality controlled single-nucleotide polymorphisms (SNPs) identified a statistically significant association (p < 10−8) with SNPs in the O6-methylguanine–DNA methyltransferase (MGMT) gene. We also demonstrate that the primary SNP in this region is significantly associated with differential gene expression of MGMT (p< 10−26) in LCLs, and differential methylation in glioblastoma samples from The Cancer Genome Atlas. The previously documented clinical and functional relationships between MGMT and temozolomide response highlight the potential of well-powered GWAS of the LCL model system to identify meaningful genetic associations.
Keywords: lymphoblastoid cell lines, temozolomide, GWAS, MGMT, pharmacogenetics
Introduction
Genome-wide association studies (GWAS) have become a standard approach for association mapping of complex traits towards the identification of genetic variation that explains statistically significant portions of phenotypic variation. As the field has gained a better understanding of realistic effect sizes for genetic models that predict trait variability, there is a growing appreciation for the large sample sizes required for reasonable power to perform mapping at the genome-wide level. This has been particularly problematic in the field of pharmacogenomics, where samples are often derived from clinical trials, and thus may be too limited in regards to the sample size available for well-powered GWAS. In response to these challenges, the use of lymphoblastoid cell lines (LCLs) as an in vitro model of chemotherapy response has emerged as a promising new approach for assessing the heritability of dose response traits, and performing genetic mapping in cancer pharmacogenomics [1-3].
Recently, we interrogated the heritability of response to a large number of cytotoxic drugs in the LCL model system, and demonstrated that the responses to many of these drugs are highly heritable [4]. Temozolomide response had the highest heritability (correcting for growth rate) of the 29 FDA-approved drugs assayed, with an estimated heritability of ~63% [4]. On this basis, we performed GWAS in 516 LCLs derived from Caucasian participants of the Cholesterol and Pharmacogenetics (CAP) clinical trial [5] to map loci associated with differential response to this drug. In addition, we used gene expression measurements from the same CAP LCLs to determine if GWAS identified SNPs are cis-expression quantitative trait loci (cis-eQTL), providing functional evidence for the identified region. Finally, we used glioblastoma methylation profiling data obtained from The Cancer Genome Atlas project to test if the identified SNPs were associated with differential methylation profiles.
Methods
Lymphoblastoid Cell Lines
516 Epstein-Barr virus immortalized LCLs derived from Caucasian subjects of the Cholesterol and Pharmacogenetics trial were used for cytotoxicity assays (described in detail in [6]). LCLs were cultured in RPMI medium 1640 containing 2 mM L-glutamine (Gibco) and 15% fetal bovine serum (Sigma) at 37°C, 5% CO2. No media antibiotics were used. 4000 cells/well were seeded in 384-well plates (Corning) containing quadruplicate wells of temozolomide (0.10, 0.25, 0.50, 1.0, 2.0, 2.5 mM). Liquid handing was performed using a Tecan EVO150 (Tecan Group Ltd) with a 96 head MCA. After 72hr incubation, Alamar Blue (Biosource International) was added and then incubated 24hr. Fluorescence intensity measurements at EX535nm and EM595nm were quantified on an Infinite F200 microplate reader with Connect Stacker (Tecan Group Ltd) using iControl software (Version 1.6). Temozolomide was obtained from LKT laboratories (MN, USA).
Genome-Wide SNP Data
Genome-wide single nucleotide polymorphism (SNP) data for approximately 300K SNPs and CNVs (from the Illumina HumanCytoSNP-350 (http://www.illumina.com/)) was previously generated for individuals from whom the CAP LCLs were derived [6, 7]. MACH [8] was used to impute 2.5 million HapMap Release22 SNPs using the CEPH population as the reference population.
Gene Expression Data
The 529 LCLs derived from the CAP cohort were incubated under standardized conditions for 24hr, after which MGMT transcript levels were quantified using the Illumina H8v3 beadarray (Illumina probe ILMN_1795639). Arrays were quantile transformed to the overall average empirical distribution across all arrays, and MGMT expression values quantile normalized. Data were adjusted for known covariates (age, gender, BMI, smoking status, LCL batch, cell growth rate, RNA labeling batch, and beadarray hybridization batch) by quantile normalizing the residuals from a linear model.
Methylation Data
Level 3 methylation data for 91 glioblastoma samples were downloaded from the TCGA data portal (https://tcga-data.nci.nih.gov). Briefly, DNA from samples received were bisulfite converted and the methylation profile of the samples were evaluated using the Illumina Infinium Human DNA Methylation27 platform. Level 3 methylation data contains beta value calculations, gene IDs and genomic coordinates from each probe on the array. Beta values range from 0-1, with values approaching 1 meaning highly methylated and values approaching 0 meaning very little methylation. Level 3 genotype data for the same 300 samples were downloaded from the TCGA data portal. The genotype data, derived from the Affymetrix Genome Wide 6.0 SNP chip, were the genotype calls produced by the Birdseed algorithm from the probesets’ intensity values normalized by the Invariant Set Median-Polish algorithm (https://tcga-data.nci.nih.gov).
Quality Control
Quality control (QC) filtering of the genotype data was performed using PLINK [9]. SNPs whose genotypes significantly deviated from Hardy Weinberg proportions [10] (p-values from χ-square tests <0.00001), whose genotyping rate was <90%. In addition, SNPs with minor allele frequency (MAF) <0.05 were filtered out because the association methods are based on a previous study, and have never been validated for lower minor allele frequencies with these sample sizes [11]. The remaining 2,074,734 SNPs were used in all subsequent analyses.
The cytotoxicity data was QCed with a seven-stage QC pipeline that has previously been described in detail [11]. The first four QC stages include removal of plates containing mostly dead cells, imputation of grossly errant raw fluorescence units (RFUs) in individual wells, QC for the negative control RFUs (10% dimethyl sulfoxide (DMSO)) and QC for drug vehicle RFUs (2% DMSO). Percent viability was calculated using the equation:
where Yijkl, Raw is the RFU of the jth cell line from the ith genotype, exposed to the kth drug concentration for the lth quadruplicate replication and Yijkl is the corresponding estimated percent viability. Vij,10%DMSO and Vij,0.2%DMSO are the average RFUs for the negative control and vehicle wells, respectively. The last three QC steps operated on percent viabilities and checked that the dose-response curve from each assay was monotonic, scaled each dose-response so that the mean viability at the lowest drug concentration was 1.0, and removed assays containing viabilities above 1.3 or below −0.05. These QC steps resulted in 0.5 – 1.5% of data being cleaned.
Correction for the first two principal components was used to account for hidden population substructure. First, PLINK was used to prune SNPs in high linkage disequilibrium [9]. Specifically, a window of 50 SNPs, a step 35 size of 5 SNPs and a pairwise r2 threshold of 0.7, resulted in 75.2% of the SNPs being removed for the principal components analysis (PCA). PCA was performed on the remaining SNPs using EIGENSTRAT [12]. Eleven outliers, clearly indicated on a scatter plot of the first two components were removed. The first two components of the remaining individuals were recalculated and used as covariates. Only the first PC was significantly (p < 0.02) associated with half-maximal inhibitory concentration (IC50) values, but the top two components explained high amounts of variation. Additionally, in a separate analysis on 28 other anticancer agents the second PC is significantly (p < 0.05) associated with phenotype for 7 drugs (and none for the third PC). For this reason, the second PC was also included in the model, in case some weak, undetected effects for this PC on temozolomide also exist. IC50 values were estimated from hill slope fits to each dose response curve with least squares, using a previously reported algorithm [13].
Association Analysis
Association between viability and genotype was tested as the combined significance of the genotype (Gi) and the genotype-concentration interaction ((GXC)ik) effects in an analysis of covariance (ANCOVA) model:
| (1) |
where Ck is the drug concentration, Gi is the genotype, and PC1ij and PC2ij are the first and second principal components for viability Yijkl. A previous simulation study has shown this method to be powerful at detecting differences in families of doseresponse curves between genotypes [13]. Because of the scaling of viabilities during QC, only data from the highest five drug concentrations were used. Here, test statistics are calculated by comparing the full model in Equation 1 to the reduced model Yijkl = Ck + PC1ij + PC2ij + eijkl. The corresponding F-statistic is:
| (2) |
where SSER, SSEF , dfR, dfF, are the sums of squared errors, and degrees of freedom for the full and reduced models. Because the error terms are not independent, the constructed F-statistics from Equation 2 do not follow the typical F-distribution. Therefore, p-values were approximated with permutation testing as previously described [14]. This analysis and permutation testing approach have been previously evaluated using a broad range of simulations described in detail in [14].
For the expression data, association between adjusted expression levels and genotype for rs531572 was made using ANOVA. Additionally, association between the adjusted expression values and the half-maximal inhibitory concentrations (IC50) for each dose-response curve were tested using linear regression.
Methylation beta values were assessed for 20 different probes that are associated with MGMT (chr10: 131155063 – 131302958). We then assessed whether SNPs of interest altered methylation beta values for the probes assigned to MGMT using analysis of variance.
Results
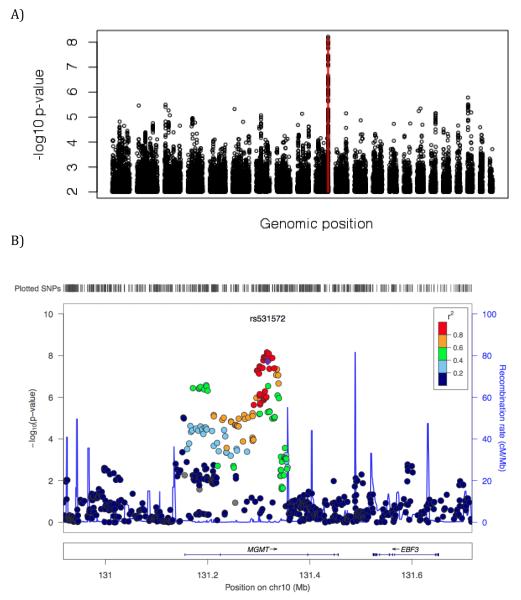
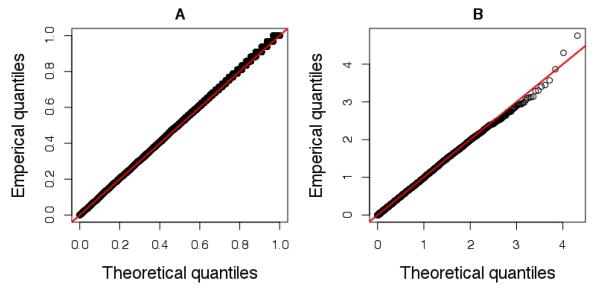
Genome-wide -log10 p-values greater than 2.0 are plotted against genomic order in Figure 1A. At a genome-wide significance level of approximately p<10−8 (based on the number of informative markers in the genome) [15] there was a single significant region on chromosome 10. Rs477692 was associated with differential response (p<10−8.15). By defining a region of association with p-values less than 10−5.5, there were a total of 20 SNPs in a region of high linkage disequilibrium (LD) (r2 >0.64 for all pair-wise contrasts, average r2 >0.90). These SNPs were contained within the O-6-methylguanine-DNA methyltransferase (MGMT) gene. Annotation of the MGMT gene along with the LD structure in our dataset is shown in Figure 1B, using LocusZoom [16]. A Q-Q plot of the overall results is shown in Figure 2.
Figure 1.
(A) Whole genome Manhattan plot of temozolomide for all SNPs with NLPVs above 2.0. Negative log10 p-values greater than 5.5 are indicated with red vertical lines. Locus View LD structure for SNPs nearby rs531572 are shown in (B).
Figure 2.
Quantile-quantile plot for a random sample of over 20k empirical p-values from association testing. Any loci near MGMT were removed. Panel (A) is of untransformed p-values and (B) is of negative log10 p-values.
To determine if these SNPs are potentially functionally relevant, we next sought to test for association with MGMT transcript levels and examined how these genotypes are related to differential dose response. Within this region, only one SNP was specifically genotyped, rs531572, while the others were imputed. Thus, given the high degree of LD within this block, we focused our functional assessment on this one SNP.
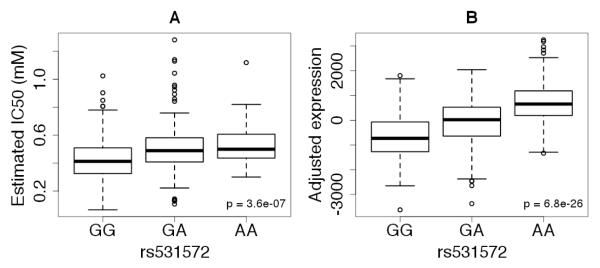
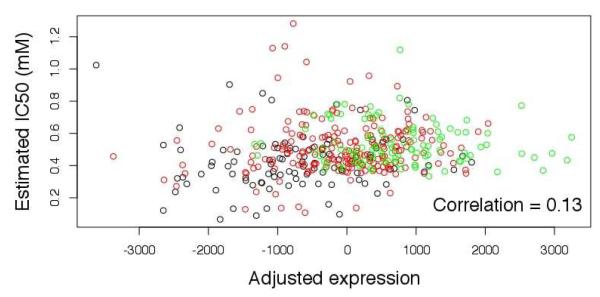
Rs531572 was highly significantly associated with both IC50 values (p<10−6,4, Figure 3A) and MGMT transcript levels (p<10−25, Figure 3B) with the A allele associated with that higher IC50 values and greater MGMT transcript levels. There was a direct correlation between MGMT transcript levels and temozolomide response with greater endogenous MGMT transcript levels associated with IC50 (p<0.006, Figure 4). However, inter-individual variation in MGMT transcript levels only explained 1.8% of the variation in IC50. These results are illustrated further in a Figure 4, with a scatter plot between IC50 and adjusted expression values.
Figure 3.
(A) Box plots for the estimated IC50 for temozolomide by genotype for rs531572. (B) Boxplots of MGMT transcript levels differ by rs531572 genotype. For each boxplot, outliers were noted as those values that are above or below 1.5 times the interquartile range from the median.
Figure 4.
Scatter plot of estimated IC50 values and adjusted expression levels. Genotypes are color coded, where black, red and green are for GG, GA and AA, respectively.
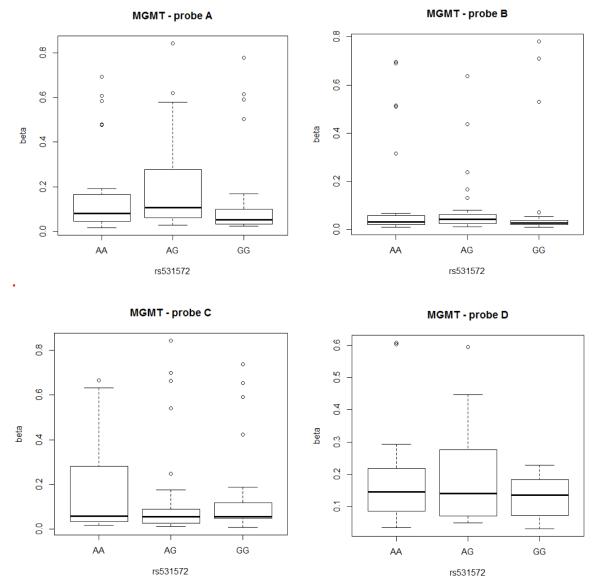
Additionally, we tested this SNP for association with differential methylation in the Cancer Genome Atlas Data. The Illumina Infinium Human DNA Methylation27 platform contains 20 different probes that are associated with MGMT. The first 4 methylation probes associated with MGMT (situated within the promoter region of the gene and most likely to influence expression levels) have median beta values < 2.0, indicating little methylation, while the probes situated on the latter part of the gene have median beta values > 0.8, indicating they are highly methylation. Association of the rs531572 SNP with the beta values over the first 4 methylation probes (A-D) indicate that this SNP is not associated with alteration of methylation in the promoter region of MGMT (p>0.05). The methylation data is shown in Figure 5.
Figure 5.
Boxplots of MGMT methylation beta values for the 4 probes in the promoter region. Probe A is located at Chr10: 131155063, Probe B at Chr10: 131155199, Probe C at Chr10: 131155565 and Probe D at Chr10: 131155686
Discussion
Temozolomide was approved in 2005 for the treatment of adult patients with newly diagnosed glioblastoma multiforme [17]. Temozolomide is a DNA alkylator agent, which interacts with several components of the DNA repair machinery [18]. Cellular studies identified O6-methylguanine methyltransferase (MGMT) as a key enzyme for the repair of DNA adducts produced by temozolomide [19]. Endogenous MGMT activity is associated with cytotoxicity of a number of alkylator agents in preclinical studies, including temozolomide. MGMT catalytic activity has high interpatient variation in both peripheral blood mononuclear cells and tumor tissue [20]. While the impact of SNPs has not been thoroughly examined, altered MGMT expression via promoter silencing has been observed. Methylation of CpG islands in MGMT has been associated with reduced DNA repair capacity. Activity of temozolomide in combination with radiotherapy has been also been associated with MGMT promoter methylation, with significantly better patient survival when MGMT activity was suppressed [21, 22]. Other mechanisms of mediating temozolomide activity via MGMT have not been well established.
In the current study, an unbiased GWAS detected a significant association with SNP(s) in the MGMT gene and cellular sensitivity to temozolomide. An eQTL analysis found these SNPs to have a cis effect on mRNA levels. This SNP has been shown to be an eQTL in previous studies. Based on the series of publications describing studies characterizing eQTLs in cell lines from HapMap CEU (Ceph) and YRI (Yoruban) samples for which transcript levels had been assayed using the Affymetrix Human Exon 1.0 ST Array that are included in the SCAN database, rs531572 has been shown to be an eQTL in the CEU population (p<1e-05) [23-26]. Additionally, a recent paper demonstrated that the SNP was an eQTL in liver samples [27]. While these SNPs are not found in known MGMT promoter regions, these variants may be tagging a variant with direct functional effect on MGMT mRNA expression. Conversely, the SNPs could alter methylation of MGMT in the promoter region, thereby indirectly influencing mRNA expression though methylation-mediated inhibition of expression. However, when examined in a set of glioblastoma samples made available through the TCGA project, we found no association with SNP genotype and methylation of the promoter region of MGMT, thus providing further evidence that the variant tagged by these SNPs has a direct functional effect on MGMT expression. This is an important novel finding, that this SNP and corresponding differences in expression may provide insight into the overall mechanisms of the relationship between temozolomide response and MGMT.
Previous LCL pharmacogenomics studies were either performed in the context of large multigeneration families [4] or with sample cohorts ≤90 unrelated individuals [1-3] . These studies supported the impact of an LCL-based discovery system, but statistical concerns existed on the validity of the results. The identification of a gene with known function in drug effect is rewarding and demonstrates the pharmacologic context of this in vitro gene discovery approach. However, there is still a need to perform in vivo validation studies to assess the impact of these MGMT SNPs on toxicity and antitumor activity of temozolomide in patients with cancer.
Acknowledgments
Source of Funding: This work was supported by NCI R01 CA161608, NHLBI U19 HL69757-10 and U01 GM63340 and T32GM081057 from the National Institute of General Medical Sciences and the National Institute of Health.
References
- 1.Bleibel WK, et al. Identification of genomic regions contributing to etoposide-induced cytotoxicity. Hum Genet. 2009;125(2):173–80. doi: 10.1007/s00439-008-0607-4. [DOI] [PMC free article] [PubMed] [Google Scholar]
- 2.Welsh M, et al. Pharmacogenomic discovery using cell-based models. Pharmacol Rev. 2009;61(4):413–29. doi: 10.1124/pr.109.001461. [DOI] [PMC free article] [PubMed] [Google Scholar]
- 3.Watters JW, et al. Genome-wide discovery of loci influencing chemotherapy cytotoxicity. Proc Natl Acad Sci U S A. 2004;101(32):11809–14. doi: 10.1073/pnas.0404580101. [DOI] [PMC free article] [PubMed] [Google Scholar]
- 4.Peters EJ, et al. Pharmacogenomic characterization of US FDA-approved cytotoxic drugs. Pharmacogenomics. 2011;12(10):1407–15. doi: 10.2217/pgs.11.92. [DOI] [PMC free article] [PubMed] [Google Scholar]
- 5.Simon JA, et al. Phenotypic predictors of response to simvastatin therapy among African-Americans and Caucasians: the Cholesterol and Pharmacogenetics (CAP) Study. Am J Cardiol. 2006;97(6):843–50. doi: 10.1016/j.amjcard.2005.09.134. [DOI] [PubMed] [Google Scholar]
- 6.Medina MW, et al. Alternative splicing of 3-hydroxy-3-methylglutaryl coenzyme A reductase is associated with plasma low-density lipoprotein cholesterol response to simvastatin. Circulation. 2008;118(4):355–62. doi: 10.1161/CIRCULATIONAHA.108.773267. [DOI] [PMC free article] [PubMed] [Google Scholar]
- 7.Barber M, et al. Genome-wide association of lipid-lowering response to statins in combined study populations. Plos One. 2010 Mar 22;5(3):e9763. doi: 10.1371/journal.pone.0009763. [DOI] [PMC free article] [PubMed] [Google Scholar]
- 8.Li Y, et al. Genotype imputation. Annu Rev Genomics Hum Genet. 2009;10:387–406. doi: 10.1146/annurev.genom.9.081307.164242. [DOI] [PMC free article] [PubMed] [Google Scholar]
- 9.Purcell S, et al. PLINK: a tool set for whole-genome association and population-based linkage analyses. Am J Hum Genet. 2007;81(3):559–75. doi: 10.1086/519795. [DOI] [PMC free article] [PubMed] [Google Scholar]
- 10.Hardy GH. Mendelian Proportions in a Mixed Population. Science. 1908;28(706):49–50. doi: 10.1126/science.28.706.49. [DOI] [PubMed] [Google Scholar]
- 11.Motsinger-Reif A, et al. Ex-vivo Modeling for Heritability Assessment and Genetic Mapping in Pharmacogenomics. Joint Statistical Meeting; Miami, FL. 2011. [PMC free article] [PubMed] [Google Scholar]
- 12.Price AL, et al. Principal components analysis corrects for stratification in genome-wide association studies. Nat Genet. 2006;38(8):904–9. doi: 10.1038/ng1847. [DOI] [PubMed] [Google Scholar]
- 13.Brown C, et al. A comparison of association methods for cytotoxicity mapping in pharmacogenomics. Front Genet. 2011;2:86. doi: 10.3389/fgene.2011.00086. [DOI] [PMC free article] [PubMed] [Google Scholar]
- 14.Besag J, Clifford P. Sequential Monte-Carlo p-values. Biometrika. 1991;78(2):3. [Google Scholar]
- 15.Johnson RC, et al. Accounting for multiple comparisons in a genome-wide association study (GWAS) BMC Genomics. 2010;11:724. doi: 10.1186/1471-2164-11-724. [DOI] [PMC free article] [PubMed] [Google Scholar]
- 16.Pruim RJ, et al. LocusZoom: regional visualization of genome-wide association scan results. Bioinformatics. 2010;26(18):2336–7. doi: 10.1093/bioinformatics/btq419. [DOI] [PMC free article] [PubMed] [Google Scholar]
- 17.Stupp R, et al. Radiotherapy plus concomitant and adjuvant temozolomide for glioblastoma. N Engl J Med. 2005;352(10):987–96. doi: 10.1056/NEJMoa043330. [DOI] [PubMed] [Google Scholar]
- 18.Zhang J, Stevens MF, Bradshaw TD. Temozolomide: Mechanisms of Action, Repair and Resistance. Curr Mol Pharmacol. 2011 doi: 10.2174/1874467211205010102. [DOI] [PubMed] [Google Scholar]
- 19.Sharma S, et al. Role of MGMT in tumor development, progression, diagnosis, treatment and prognosis. Anticancer Res. 2009;29(10):3759–68. [PubMed] [Google Scholar]
- 20.Margison GP, et al. Quantitative trait locus analysis reveals two intragenic sites that influence O6-alkylguanine-DNA alkyltransferase activity in peripheral blood mononuclear cells. Carcinogenesis. 2005;26(8):1473–80. doi: 10.1093/carcin/bgi087. [DOI] [PubMed] [Google Scholar]
- 21.Hegi ME, et al. Correlation of O6-methylguanine methyltransferase (MGMT) promoter methylation with clinical outcomes in glioblastoma and clinical strategies to modulate MGMT activity. J Clin Oncol. 2008;26(25):4189–99. doi: 10.1200/JCO.2007.11.5964. [DOI] [PubMed] [Google Scholar]
- 22.Hegi ME, et al. MGMT gene silencing and benefit from temozolomide in glioblastoma. N Engl J Med. 2005;352(10):997–1003. doi: 10.1056/NEJMoa043331. [DOI] [PubMed] [Google Scholar]
- 23.Nicolae DL, et al. Trait-associated SNPs are more likely to be eQTLs: annotation to enhance discovery from GWAS. PLoS Genet. 2010;6(4):e1000888. doi: 10.1371/journal.pgen.1000888. [DOI] [PMC free article] [PubMed] [Google Scholar]
- 24.Gamazon ER, et al. SCAN: SNP and copy number annotation. Bioinformatics. 2010;26(2):259–62. doi: 10.1093/bioinformatics/btp644. [DOI] [PMC free article] [PubMed] [Google Scholar]
- 25.Duan S, et al. SNPinProbe_1.0: a database for filtering out probes in the Affymetrix GeneChip human exon 1.0 ST array potentially affected by SNPs. Bioinformation. 2008;2(10):469–70. doi: 10.6026/97320630002469. [DOI] [PMC free article] [PubMed] [Google Scholar]
- 26.Zhang W, et al. Evaluation of genetic variation contributing to differences in gene expression between populations. Am J Hum Genet. 2008;82(3):631–40. doi: 10.1016/j.ajhg.2007.12.015. [DOI] [PMC free article] [PubMed] [Google Scholar]
- 27.Schroder A, et al. Genomics of ADME gene expression: mapping expression quantitative trait loci relevant for absorption, distribution, metabolism and excretion of drugs in human liver. Pharmacogenomics J. 2011 doi: 10.1038/tpj.2011.44. [DOI] [PMC free article] [PubMed] [Google Scholar]


