Abstract
Introduction
The purpose was to examine relations among spasticity, weakness, force variability, and sustained spontaneous motor unit discharges in spastic-paretic biceps brachii muscles in chronic stroke.
Methods
Ten chronic stroke subjects produced submaximal isometric elbow flexion force on impaired and non-impaired sides. Intramuscular EMG (iEMG) was recorded from biceps and triceps brachii muscles.
Results
We observed sustained spontaneous motor unit discharges in the resting biceps on iEMG. Spontaneous discharges increased after voluntary activation only on the impaired side. The impaired side had greater matching errors and greater fluctuations in isometric force. Spontaneous discharges were not functionally related to spasticity, force variability, or weakness. However, greater strength on the impaired side correlated with less force variability.
Conclusion
Weakness rather than spasticity is a main factor interfering with voluntary force control in paretic-spastic biceps brachii muscles in chronic stroke.
Keywords: stroke, electromyography (EMG), force, sustained motor unit spontaneous discharges, variability, spasticity, hemiparesis
INTRODUCTION
Stroke survivors often have spastic and paretic muscles on the impaired side as a result of the cerebrovascular accident, accompanied by impaired voluntary control of these muscles. 1–5 Weakness, among other symptoms, is the primary contributor to the overall impairment of hand function. 6 Weakness has been considered to be primarily attributable to the loss of descending corticospinal pathway activation to spinal motoneurons.6 In addition to weakness, observation of abnormal EMG-force relations 7–10 suggests that stroke subjects need to recruit more motor units in paretic muscles to produce the same magnitude of force/torque as on the non-impaired side. Furthermore, stroke survivors have difficulty maintaining a steady force output during voluntary contraction of paretic muscles, resulting in increased force variability. 11 Underlying mechanisms remain unknown, however, it could be related to recently reported findings of spontaneous motor unit discharges in stroke.3,4
Previous studies have demonstrated increased background activity at rest.12,13 Recent studies using intramuscular EMG (iEMG)3,4 and high-density surface EMG 3,14 successfully recorded spontaneous motor unit discharges in resting spastic-paretic muscles in stroke subjects. A recent study 4 further reported that the firing rate of spontaneously firing motor units increased in concert with increasing force during voluntary contraction. The increased resting background activity in the spastic-paretic muscles has been shown to affect passive movement control.13 When the biceps brachii on the non-impaired side was pre-activated to carefully match the same level of background muscle activity on the non-impaired side of stroke patients, the torque-angle relations during passive stretching were comparable between the sides.13 Therefore, it is plausible that sustained spontaneous motor unit discharges in resting biceps brachii muscles in chronic stroke 3,4 could be related to hypertonia of the muscles. Furthermore, spontaneous discharges which are not voluntarily suppressed at rest and increase with voluntary force production 4 could be hypothesized to be “noise”, resulting in greater force variability. The relationship between spontaneous motor unit discharges and spasticity, weakness, and voluntary force control remains unknown.
In this study we investigated the significance of resting background activity of spastic-paretic muscles during isometric elbow flexion using iEMG recordings in chronic stroke. According to the “noise” hypothesis, these spontaneous discharges could be related to spasticity and impaired voluntary force control in these muscles. Impaired force control could be manifested by abnormal EMG-force relations, greater isometric force fluctuations, and greater errors in matching a preset target on the impaired side than on the non-impaired side.
METHODS
Participants
Ten chronic stroke subjects (age: 36–73 years; height: 1.52 – 1.85 m; weight: 47.7 – 130.3 kg; 5 right hemiplegia and 5 left hemiplegia) recruited from the outpatient clinic (see table 1) participated in the study. Inclusion criteria were: 1) hemiplegia secondary to an ischemic or hemorrhage stroke; 2) at least 6 months post-stroke; 3) residual voluntary elbow flexion force; 4) full passive range of motion in the impaired shoulder and elbow joints; 5) spastic hypertonia in elbow flexors of the impaired side, rated as Modified Ashworth Scale (MAS) less than 3; and 6) able to understand and follow instructions related to the experiment. Exclusion criteria included: 1) a history of multiple strokes or bilateral involvement; 2) presence of contracture that would limit full elbow range of motion on the impaired side; 3) neglect; and 4) elbow flexor MAS score of 3 or 4 in the impaired shoulder side. Subjects were asked to not change the total daily dose of any antispasticity medications for at least 2 weeks before participation. Subjects had to wait at least 2 weeks after last botulinum toxin injection prior to participation in order to minimize the local effect of botulinum toxin injection solution on iEMG recordings. Three subjects received botulinum toxin injection to the biceps. Among them, 1 participated in the experiment at 6 weeks post-injection during the follow up visit. The other 2 were studied at more than 3 months post-injection. All subjects gave informed consent prior to participation. This study was approved by the Committee for the Protection of Human Subjects at the University of Texas Health Science Center at Houston and TIRR Memorial Hermann Hospital.
Table 1.
Subject characteristics
| ID | Sex | Post injury (mo) | MAS | * Biceps strength (%) | Sustained discharge Incidence (%)
|
|||
|---|---|---|---|---|---|---|---|---|
| Impaired | Non-impaired | |||||||
|
| ||||||||
| Pre | Post | Pre | Post | |||||
| 1 | F | 42 | 1 | 57.2 | 100.0 | 100.0 | 16.7 | 8.3 |
| 2 | M | 11 | 1 | 46.3 | 8.3 | 75.0 | 25.0 | 66.7 |
| 3 | M | 120 | 1 | 32.0 | 0.0 | 0.0 | 0.0 | 0.0 |
| 4 | M | 96 | 1 | 42.8 | 58.3 | 100.0 | 0.0 | 0.0 |
| 5 | F | 34 | 1+ | 26.9 | 0.0 | 0.0 | 0.0 | 0.0 |
| 6 | M | 79 | 1+ | 23.3 | 100.0 | 100.0 | 0.0 | 0.0 |
| 7 | M | 48 | 0 | 177.9 | 58.3 | 41.7 | 0.0 | 0.0 |
| 8 | F | 32 | 1+ | 52.3 | 0.0 | 0.0 | 50.0 | 50.0 |
| 9 | F | 105 | 1 | 35.3 | 100.0 | 100.0 | 75.0 | 50.0 |
| 10 | F | 276 | 2 | 27.6 | 100.0 | 100.0 | 41. 7 | 33.3 |
| Mean (SD) | 84.3 (76.3) | 52.2 (45.6) | 52.5 (46.3) | 61.7 (46.4) | 20.8 (26.7) | 20.8 (26.4) | ||
Biceps strength: impaired MVC/non-impaired MVC; Incidence (%) was defined as the number of trials with spontaneous discharge divided by the total of 12 trials (3 trials each for 4 force levels, MAS: modified Ashworth scale; y/o: year of age; m: meter, Kg: kilogram, mo: month, MVC: maximal voluntary contraction, SD: standard deviation.)
Electromyogram and Force Recordings
All subjects were right-handed according to premorbid use for eating and writing. Subjects were seated on a height-adjustable chair with upper arm support. The shoulder was slightly flexed and abducted to 45°, the elbow flexed to 90°, and the forearm in a neutral position on the table. Additional trunk stabilization was provided by shoulder straps. The tested arm and wrist were secured firmly on a customized apparatus. A load cell (Model 208C02, PCB Piezotronics, Depew, NY) was placed perpendicular to the distal end of the forearm (about 2 cm proximal to the wrist joint) to measure isometric elbow flexion force. The skin was cleaned with an alcohol swab. A sterile needle with fine wire electrodes (VIASYS Healthcare, Madison WI) was inserted into the middle of muscle bellies (Biceps brachii and lateral head of triceps) to the depth where clearly detectable motor unit activities occurred with minimal voluntary contraction, then slowly withdrawn, leaving only the fine wires within the muscle. The fine wires were secured to the skin with paper tape.
After a few practice trials, subjects were asked to perform a series of 3 maximal voluntary isometric contractions (MVC) with at least 1 min rest in between. The maximum force of 3 trials was taken to pre-set a force target at 20%, 40%, 60% and 80% MVC. On each side, all subjects produced different force levels (20% – 80%MVC) randomly. In each of the 20-second trial, subjects were asked to rest for the first 5 s and then contract the biceps to match the target force displayed on the screen as accurately as possible for 10 s and then rest for 5s. Audible tones were used to signal subjects when to contract or relax the biceps. A real-time force curve was displayed to provide visual feedback. Three trials were recorded for each target force. The interval between 2 consecutive trials was at least 1 minute or longer at the subject’s request. All subjects completed the experiment without any difficulty or fatigue. All EMG signals were recorded using Delsys EMG system (Delsys, Boston, MA) with a sample rate of 5000 Hz. Data were recorded using custom LabView software (National Instrument, Austin, TX).
Data Analysis
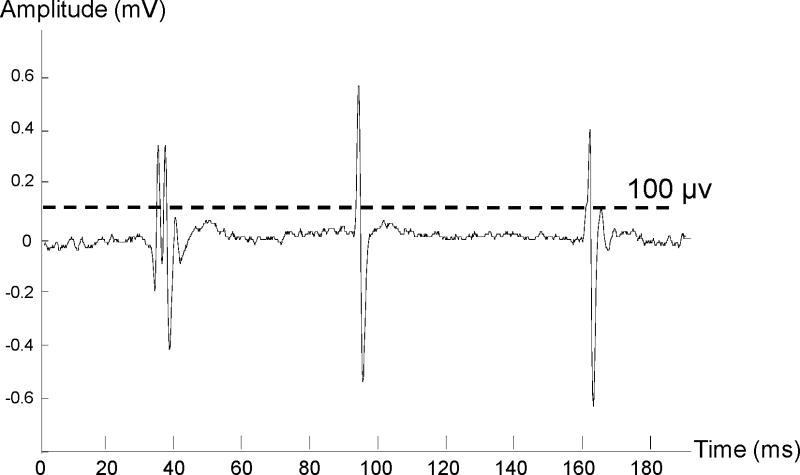
Force and EMG signals were analyzed offline using a custom MATLAB program. Spontaneous motor unit discharges were identified when the following criteria were met: 1) the peak amplitude of the action potential spikes from raw EMG signals was greater than 100 μV (Figure 1) 15,16 and 2) spontaneous discharges lasted for the entire 5-s before or after muscle contraction until the end of the trial (pre- and post- activation). Frequency of spontaneous discharges was defined as spikes/s averaged over the first 5 seconds for the pre-activation period and the last several seconds (range from 3–5s) from the end of voluntary activation to the end of the trial for the post-activation period. The averaged amplitude of these identified spikes was also calculated for both pre- and post-activation periods. Decompositions of spontaneous discharges for motor unit analysis were beyond the scope of this study.
Figure 1.
A sample trace of spontaneous motor unit discharges. A threshold of 100 μV was used to detected spontaneous motor unit spikes.
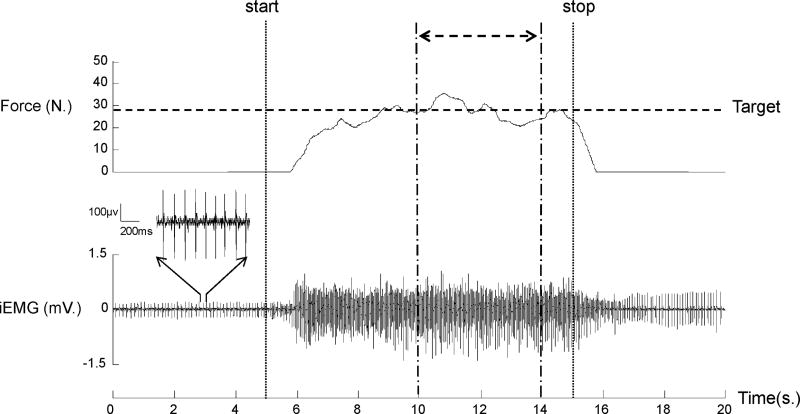
Since it usually took subjects a few seconds to reach a relatively steady force output (Figure 2), a 4-s segment of EMG-force signals in the middle of each trial was used to standardize the analysis. Root-mean-square (RMS) iEMG values were calculated for biceps and triceps. RMS iEMG values of submaximal force levels were further normalized to corresponding MVC trials. A 5-s window of the pre-activation resting period was used to calculate the absolute value of RMS for iEMG at rest.
Figure 2.
A representative trial. The subject performed an isometric elbow flexion after the start signals (vertical dash line) to generate a submaximal force to match the pre-set target level (80% MVC, horizontal dotted line) as accurately as possible for 10s. The subject was asked to relax the muscle after the stop signal (vertical dotted line). In this trial, sustained spontaneous motor unit discharges were observed both before and after activation. Variables of EMG and force control were calculated in the 4-s period (double head arrow) during the steady force generation. The magnified motor unit activities in 1-s baseline (3rd – 4ths) are displayed. iEMG: intramuscular EMG.
Average force in this segment was computed and normalized to its MVC. Accuracy of the force was calibrated by measuring absolute error (AE), i.e., the absolute difference between the average force and the target force divided by the target force. Force variability was estimated by coefficient of variation (CV). CV was defined by standard deviation/mean force.11
Statistical Analysis
Statistical analyses were performed using SAS 9.2 (Cary, NC). Linear regression analyses were used to evaluate normalized force-EMG relation data from 20% to 80% MVC. Paired t-tests were used to compare slope and intercept estimations between impaired and non-impaired sides. Repeated measures ANOVA tests were used to examine raw and normalized RMS. Factors included SIDE (2 levels, impaired (P) vs. non-impaired (NP)) and FORCELEVEL (4 levels, 20%, 40%, 60%, 80% MVC). To investigate the ability of force control, repeated measures ANOVA tests were used to examine AE and CV with a factor of SIDE and FORCE LEVEL. Post hoc Tukey honestly significant difference (HSD) tests were performed when there was a significant effect. Paired Student t-tests were used to compare the effect of activation of frequency and amplitudes of spontaneous discharges between the impaired and non-impaired sides. Correlation coefficient and linear regression analyses were applied to examine the correlation between the incidence of spontaneous discharge at baseline, force, AE, and CV. The alpha level required for statistical significance was set at .05. Data are reported as means ± SD within the text and displayed as means ± SE in the figures.
RESULTS
Spontaneous motor unit discharges (Figure 1) were evident on iEMG recordings. Figure 2 shows a representative trial of raw signals of iEMG and force at 80% MVC in the impaired biceps. Across all subjects (n=10), sustained discharges were observed in resting impaired biceps in both pre- and post-activation on iEMG recordings in 7 out of 10 subjects (see Table 1). Among these 7 subjects, 4 showed sustained discharges during pre- and post-activation in all trials at all force levels, and they lasted at least 5 seconds (the end of the trial) after contraction was terminated; the other 3 subjects showed sustained discharge in some trials at pre-activation (8.3 – 58.3% trials) and increased (41.7–100% trials) post-activation. In the non-impaired biceps, spontaneous discharges were observed in 5 subjects at pre-activation (16.67% –75.0% trials) and post-activation (8.3%–66.67% trials) and no sustained discharges at all in the other 5 subjects.
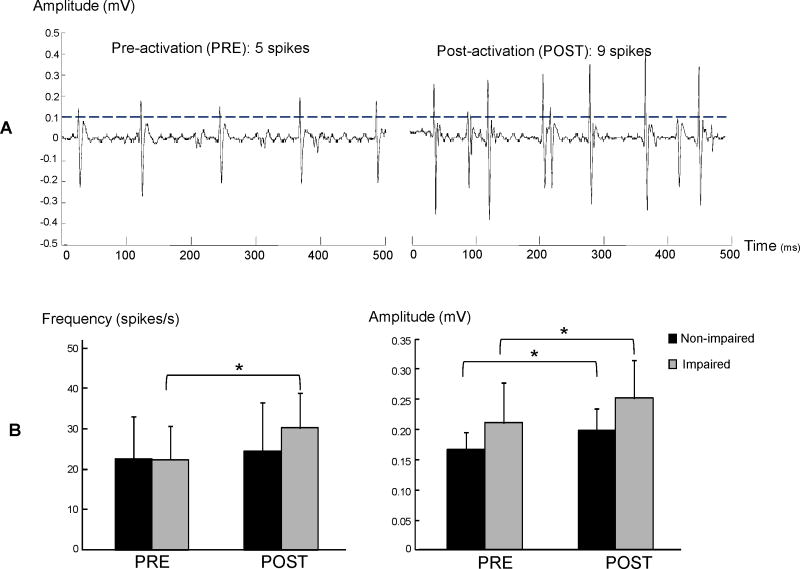
Spontaneous discharges were more frequent and greater in amplitude during post-activation than pre-activation on the impaired side but only showed increased amplitude on the non-impaired side (Figure 3). On the impaired side, the frequency of spontaneous discharges increased after voluntary contraction (pre vs post: 22.3 ± 21.8 vs 30.1± 23.1 spikes/s, t6=2.17, p=0.037). The amplitude also increased after voluntary contraction (pre vs post: 0.21± 0.17 vs 0.25± 0.17 mV, t6=2.94, P=0.010). On the non-impaired limb, the frequency did not increase after voluntary contraction (pre vs post: 22.5±25.8 vs 24.4± 30.0 spikes/s, t5=0.61, P=0.285), but the amplitude increased after voluntary contraction (pre vs post: 0.17± 0.07 vs 0.20± 0.09 mV, t5=2.42, P=0.024).
Figure 3.
Effect of voluntary contraction on spontaneous motor unit discharges. The number of spikes and amplitudes of spontaneous discharges increased on the impaired side in a typical trial (panel A). The averaged results (panel B) showed increased frequency and amplitude of spontaneous discharges after voluntary contraction on the impaired side, while only amplitude increased after voluntary contraction on the non-impaired side. Asterisk indicates p<0.05.
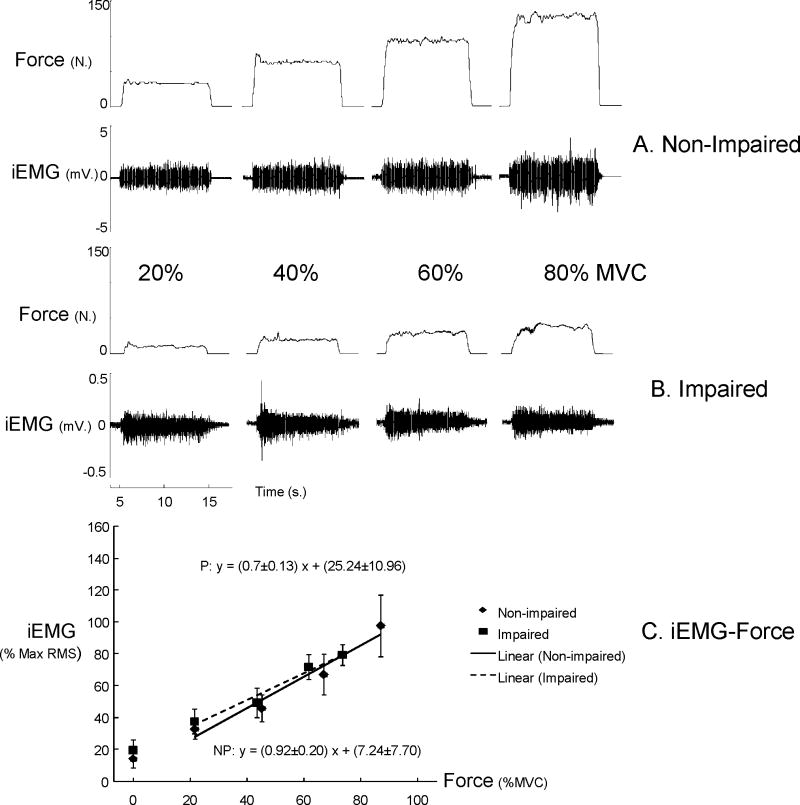
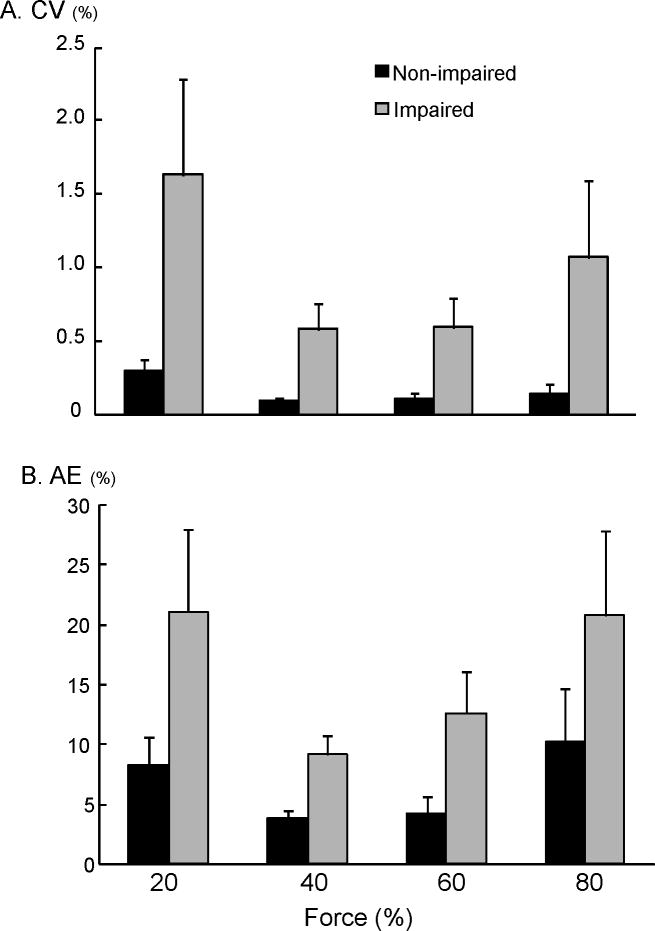
Average MVC was significantly less in impaired (38.3 ± 21.6 N) than non-impaired biceps (85.1 ± 31.5 N) (P= 0.002). Figure 4A and B shows representative raw EMG and force signals at 4 levels of submaximal force from both sides in a stroke subject. iEMG demonstrated high linear relations with elbow flexion force (R2 range: 0.90 to 0.99) for both impaired and non-impaired sides. The slope of EMG-force relations was not significantly different between impaired and non-impaired sides (NP vs. P: 0.92±0.2 vs. 0.70±0.13). The intercept was slightly larger on the impaired side (25.24±10.96 %), but not significantly different from the non-impaired side (7.24±7.70%) (Fig 4C). Resting absolute RMS values, however, did not differ between non-impaired and impaired sides in iEMG recordings (t9=0.80, p=0.22). During isometric contraction, co-contraction from triceps was not seen in the non-impaired side. Co-contraction was not observed in the impaired side at 20 to 60% MVC but was detected in 5 of 30 trials at 80% MVC (16.7% trials). Force variability (coefficient of variation, CV) and matching errors (absolute error, AE) were both greater on the impaired side than the non-impaired side (CV: F[1,9]=14.82, P=0.0039 and AE: F[1,9]=12.74, P=0.006) (Figure 5). No main effects of FORCE LEVEL and interactions between SIDE and FORCE LEVEL were found for both CV and AE.
Figure 4.
Representative raw EMG and force signals during submaximal force production from a typical subject (A and B). Raw EMG amplitudes were higher in the non-impaired side in comparison to the impaired side Raw EMGs increased with increasing force in both biceps. Average normalized EMG-force relations (C) The normalized iEMG amplitudes at rest (no force generated) were shown but not included in estimation of EMG-force relations. iEMG: intramuscular EMG.
Figure 5.
Impaired voluntary force control. The spastic-paretic biceps has greater fluctuation and greater matching errors as compared to the non-impaired side across all force levels. NP: non-impaired; P: impaired.
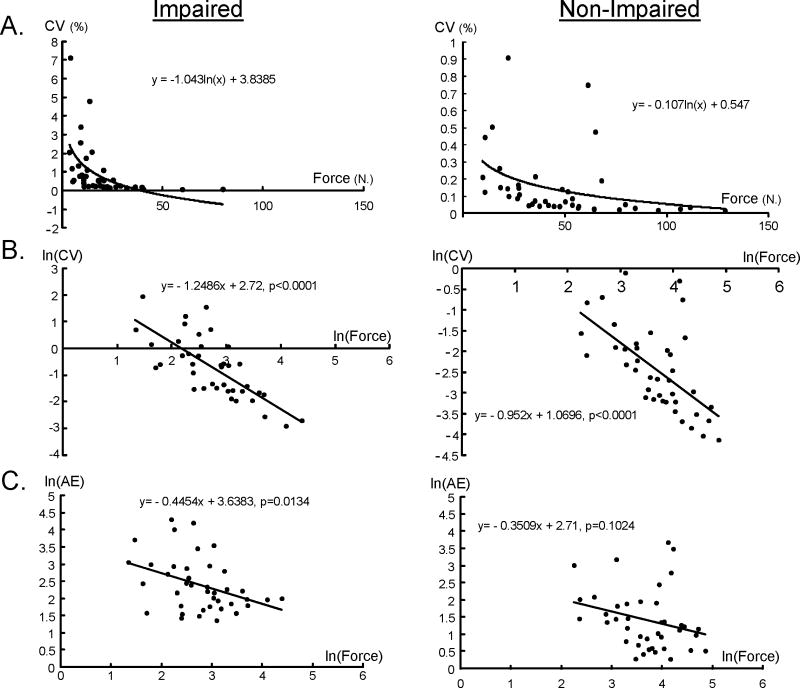
We examined the relationship between incidence of spontaneous discharges at rest and CV, AE, and maximal force amplitude. The results revealed that the biceps that could generate greater force tended to have less CV(r=−0.4739, P=0.0348) and AE (r=−0.459, P=0.0418). The results from linear regression of each limb further showed the non-linear relationship between force and CV. Significant negative linear regression on the natural log (ln) of the strength and CV were found on both non-impaired (P<.0001) and impaired limbs (P<.0001) (Figure 6B). Significant negative linear regression on the natural log (ln) of the strength and AE were found on the impaired limb (P=0.0134) (Figure 6C). We found greater CV on the impaired side with higher incidence of spontaneous discharge at rest, but the results did not reach significance level (r=0.2513, P=0.2851). We did not find any correlation between AE and incidence of spontaneous discharge at baseline (r=0.0209, P=0.9305).
Figure 6.
The relationship between force and CV and AE in non-impaired and impaired limbs. The data are plotted on a linear axis in (A), and the natural log of the same data is plotted in (B). The natural log of the force and AE is plotted in (C).
DISCUSSION
In this study we compared isometric elbow flexion force production between the impaired and non-impaired sides of chronic stroke patients at submaximal levels. Our primary findings confirmed observations of sustained spontaneous discharges in both impaired and non-impaired muscles,3,4 the abnormal EMG-force relations in the impaired muscle using iEMG recordings,7–10 and greater force variability (CV and AE) on the impaired side.11 The novel findings included: 1) sustained spontaneous motor unit discharges were not related to spasticity, strength, or force variability, and 2) higher MVC (i.e., better residual strength) on the impaired side was correlated with less force variability. These findings tentatively refute the “noise” hypothesis of spontaneous discharge that sustained spontaneous motor unit discharges at rest are likely related to spasticity, strength, and force variability.
Sustained Spontaneous Discharges Pre- and Post-activation
Observation of sustained spontaneous discharges on spastic-paretic and non-impaired biceps at rest confirmed earlier findings.3,4 Compared to previous results,4 our observation of slightly lower incidence (61.7% vs. 83.2 % of tested trials) and more frequent (20.8% vs. 14.1%) in the resting biceps muscles on the non-impaired side was likely due to variations among stroke patients. We further compared spontaneous motor unit discharges pre- and post-voluntary activation. Post-activation spontaneous discharges on the impaired side were more frequent (pre- vs. post-: 52.5% vs. 61.7% of tested trials); there was no such change on the non-impaired side (20.8% vs. 20.8%). These results (Figure 3) extended previous reports 4 and could be attributed to the fact that firing rates of the spontaneous units increased in concert with increases in voluntary force, 4 and the spontaneous firings continued post-activation. We did not observe any relationship between incidence of sustained motor unit discharges and amplitudes of force output or severity of spasticity as estimated by MAS (see Table 1). Ironically, subject 7 who had excellent recovery with greater MVC and a MAS of 0 on the impaired side demonstrated pre- and post-activation spontaneous motor unit discharges in approximately 50% of trials on the impaired side. The observation could be limited to a small sample size, a narrow range of spasticity (MAS was 1 or 1+ for the majority of subjects, n=8), influence of botulinum toxin, and a wide range of strength deficits. However, it was interesting that the spontaneous motor unit discharge frequency and amplitude increased after contractions on the impaired side, but the extent of increase was not related to the contraction levels. Furthermore, we also observed increased amplitude of the spontaneous discharges after contractions in the unimpaired limb. These observations suggested that spontaneous motor unit discharges are likely to result from supraspinal descending excitatory input to the spinal motoneuron pool 4 with some sort of gating mechanisms. Though no experimentally imposed sources of synaptic excitation (e.g., tendon vibration) allow us to localize the origin of the input, the input is likely different from descending corticospinal activation under voluntary control.
Impaired Voluntary Force Control in Spastic-Paretic Biceps
Our finding that greater strength (i.e., better residual strength) on the impaired side was correlated with less force variability is of particular significance. Observation of increased force variability on the impaired side has been reported previously.11 Impaired force control could be attributed to reduced ability in motor unit recruitment and modulation, including fluctuation in motor unit discharge rate and motor unit synchronization during submaximal force production.17–21 In a previous study 22 that compared variability of joint torque during voluntary activation across the distal joint of the thumb, the proximal joint of the index finger, the wrist joint, and the elbow joint, it was found that in healthy subjects, the torque variation decreased systematically as the maximum voluntary torque increased. The magnitude of the coefficient of torque variation was further found to be dependent primarily on the number of motor units innervating the muscles for the joint.22 It is thus reasonable to infer that, similarly in stroke patients, greater strength on the impaired side is correlated with greater number of motor units that could be voluntarily activated, thus less force variability. This is also consistent with the finding from a previous study that weakness in stroke patients results primarily from the loss of descending corticospinal activation of the spinal motoneurons.6 In combination with the report that weakness is the primary contributor for overall impairment,6 strengthening of the impaired muscles should be a prime target for therapy to improve function and control in stroke patients.
Conclusion
In summary, our results have confirmed abnormal EMG-force relations using iEMG recordings, greater force variability, and sustained spontaneous motor unit discharges in chronic stroke. Our findings further indicate that sustained spontaneous discharges are not functionally related to other impairments such as spasticity, strength, and force variability. Weakness rather than spasticity is a main factor interfering with voluntary force control in paretic-spastic biceps brachii muscles in chronic stroke. Strengthening of impaired muscles should be a prime target for therapy.
Acknowledgments
This study was supported in part by NIH grants (NIH/NINDS R01NS060774; NIH/NICHD/NCMRR R24 HD050821-08 under subcontract with Rehabilitation Institute of Chicago).
Abbreviations
- CV
Coefficient of variation
- AE
Absolute error
- iEMG
Intramuscular electromyogram
- MAS
Modified Ashworth Scale
- MVC
Maximum voluntary contraction
- RMS
Root mean squre
- HSD
Honestly significant difference
References
- 1.Lukacs M. Electrophysiological signs of changes in motor units after ischaemic stroke. Clin Neurophysiol. 2005;116:1566–1570. doi: 10.1016/j.clinph.2005.04.005. [DOI] [PubMed] [Google Scholar]
- 2.Lewek MD, Hornby TG, Dhaher YY, Schmit BD. Prolonged quadriceps activity following imposed hip extension: a neurophysiological mechanism for stiff-knee gait? J Neurophysiol. 2007;98:3153–3162. doi: 10.1152/jn.00726.2007. [DOI] [PMC free article] [PubMed] [Google Scholar]
- 3.Mottram CJ, Suresh NL, Heckman CJ, Gorassini MA, Rymer WZ. Origins of abnormal excitability in biceps brachii motoneurons of spastic-paretic stroke survivors. J Neurophysiol. 2009;102:2026–2038. doi: 10.1152/jn.00151.2009. [DOI] [PMC free article] [PubMed] [Google Scholar]
- 4.Mottram CJ, Wallace CL, Chikando CN, Rymer WZ. Origins of spontaneous firing of motor units in the spastic-paretic biceps brachii muscle of stroke survivors. J Neurophysiol. 2010;104:3168–3179. doi: 10.1152/jn.00463.2010. [DOI] [PMC free article] [PubMed] [Google Scholar]
- 5.Seo NJ, Rymer WZ, Kamper DG. Delays in grip initiation and termination in persons with stroke: effects of arm support and active muscle stretch exercise. J Neurophysiol. 2009;101:3108–3115. doi: 10.1152/jn.91108.2008. [DOI] [PubMed] [Google Scholar]
- 6.Kamper DG, Fischer HC, Cruz EG, Rymer WZ. Weakness Is the Primary Contributor to Finger Impairment in Chronic Stroke. Arch Phys Med Rehab. 2006;87:1262. doi: 10.1016/j.apmr.2006.05.013. [DOI] [PubMed] [Google Scholar]
- 7.Suresh NL, Zhou P, Rymer WZ. Abnormal EMG-force slope estimates in the first dorsal interosseous of hemiparetic stroke survivors. Conf Proc IEEE Eng Med Biol Soc. 2008;2008:3562–3565. doi: 10.1109/IEMBS.2008.4649975. [DOI] [PubMed] [Google Scholar]
- 8.Tang A, Rymer WZ. Abnormal force--EMG relations in paretic limbs of hemiparetic human subjects. J Neurol Neurosurg Psychiatry. 1981;44:690–698. doi: 10.1136/jnnp.44.8.690. [DOI] [PMC free article] [PubMed] [Google Scholar]
- 9.Gemperline JJ, Allen S, Walk D, Rymer WZ. Characteristics of motor unit discharge in subjects with hemiparesis. Muscle Nerve. 1995;18:1101–1114. doi: 10.1002/mus.880181006. [DOI] [PubMed] [Google Scholar]
- 10.Zhou P, Suresh NL, Rymer WZ. Model based sensitivity analysis of EMG-force relation with respect to motor unit properties: applications to muscle paresis in stroke. Ann Biomed Eng. 2007;35:1521–1531. doi: 10.1007/s10439-007-9329-3. [DOI] [PubMed] [Google Scholar]
- 11.Lodha N, Naik SK, Coombes SA, Cauraugh JH. Force control and degree of motor impairments in chronic stroke. Clin Neurophysiol. 2010;121:1952–1961. doi: 10.1016/j.clinph.2010.04.005. [DOI] [PubMed] [Google Scholar]
- 12.Pisano F, Miscio G, Del Conte C, Pianca D, Candeloro E, Colombo R. Quantitative measures of spasticity in post-stroke patients. Clin Neurophysiol. 2000;111:1015–1022. doi: 10.1016/s1388-2457(00)00289-3. [DOI] [PubMed] [Google Scholar]
- 13.Burne JA, Carleton VL, O’Dwyer NJ. The spasticity paradox: movement disorder or disorder of resting limbs? J Neurol Neurosurg Psychiatry. 2005;76:47–54. doi: 10.1136/jnnp.2003.034785. [DOI] [PMC free article] [PubMed] [Google Scholar]
- 14.Kallenberg LA, Hermens HJ. Motor unit properties of biceps brachii in chronic stroke patients assessed with high-density surface EMG. Muscle Nerve. 2009;39:177–185. doi: 10.1002/mus.21090. [DOI] [PubMed] [Google Scholar]
- 15.Willison RG. Analysis of electrical activity in healthy and dystrophic muscle in man. J Neurol Neurosurg Psychiatry. 1964;27:386–394. doi: 10.1136/jnnp.27.5.386. [DOI] [PMC free article] [PubMed] [Google Scholar]
- 16.Rose AL, Willison RG. Quantitative electromyography using automatic analysis: studies in healthy subjects and patients with primary muscle disease. J Neurol Neurosurg Psychiatry. 1967;30:403–410. doi: 10.1136/jnnp.30.5.403. [DOI] [PMC free article] [PubMed] [Google Scholar]
- 17.Taylor AM, Christou EA, Enoka RM. Multiple features of motor-unit activity influence force fluctuations during isometric contractions. J Neurophysiol. 2003;90:1350–1361. doi: 10.1152/jn.00056.2003. [DOI] [PubMed] [Google Scholar]
- 18.Lang CE, Schieber MH. Reduced Muscle Selectivity During Individuated Finger Movements in Humans After Damage to the Motor Cortex or Corticospinal Tract. J Neurophysiol. 2004;91:1722–1733. doi: 10.1152/jn.00805.2003. [DOI] [PubMed] [Google Scholar]
- 19.Moritz CT, Barry BK, Pascoe MA, Enoka RM. Discharge rate variability influences the variation in force fluctuations across the working range of a hand muscle. J Neurophysiol. 2005;93:2449–2459. doi: 10.1152/jn.01122.2004. [DOI] [PubMed] [Google Scholar]
- 20.Ward NS, Newton JM, Swayne OB, Lee L, Thompson AJ, Greenwood RJ, Rothwell JC, Frackowiak RS. Motor system activation after subcortical stroke depends on corticospinal system integrity. Brain. 2006;129(Pt 3):809–819. doi: 10.1093/brain/awl002. [DOI] [PMC free article] [PubMed] [Google Scholar]
- 21.Kokotilo KJ, Eng JJ, McKeown MJ, Boyd LA. Greater activation of secondary motor areas is related to less arm use after stroke. Neurorehabil Neural Repair. 2010;24:78–87. doi: 10.1177/1545968309345269. [DOI] [PMC free article] [PubMed] [Google Scholar]
- 22.Hamilton AFDC, Jones KE, Wolpert DM. The scaling of motor noise with muscle strength and motor unit number in humans. Exp Brain Res. 2004;157:417. doi: 10.1007/s00221-004-1856-7. [DOI] [PubMed] [Google Scholar]


