

Abstract
Introduction
Plasma triglycerides (TG) and HDL-C are inversely related in Metabolic Syndrome (MetS), due to exchange of VLDL-TG for HDL-cholesteryl esters catalyzed by cholesteryl ester transfer protein (CETP). We investigated the relationship of TG to HDL-C in highly-active antiretroviral drug (HAART)-treated HIV patients.
Methods
Fasting plasma TG and HDL-C levels were compared in 179 hypertriglyceridemic HIV/HAART patients and 71 HIV-negative persons (31 normotriglyceridemic (NL) and 40 hypertriglyceridemic due to type IV hyperlipidemia (HTG)). CETP mass and activity were compared in 19 NL and 87 HIV/HAART subjects.
Results
Among the three groups, a plot of HDL-C vs. TG gave similar slopes but significantly different y-intercepts (9.24 ± 0.45, 8.16 ± 0.54, 6.70 ± 0.65, sqrt(HDL-C) for NL, HIV and HTG respectively; P<0.001); this difference persisted after adjusting HDL-C for TG, age, BMI, gender, glucose, CD4 count, viral load and HAART strata (7.18 ± 0.20, 6.20 ± 0.05 and 4.55 ± 0.15 sqrt(HDL-C) for NL, HIV and HTG, respectively, P <0.001). CETP activity was not different between NL and HIV, but CETP mass was significantly higher in HIV (1.47 ± 0.53 compared to 0.93 ± 0.27 μg/mL, P<0.0001), hence CETP specific activity was lower in HIV (22.67 ± 13.46 compared to 28.46 ± 8.24 nmol/μg/h, P=0.001).
Conclusions
Dyslipidemic HIV/HAART patients have a distinctive HDL-C plasma concentration adjusted for TG. The weak inverse relationship between HDL-C and TG is not explained by altered total CETP activity; it could result from a non-CETP-dependent mechanism or a decrease in CETP function due to inhibitors of CETP activity in HIV patients’ plasma.
Keywords: HIV/AIDS, dyslipidemia, insulin resistance, lipodystrophy, cholesteryl ester transfer protein
Introduction
HIV-infected patients on highly active antiretroviral therapy (HAART) have a high rate of Metabolic Syndrome (MetS), characterized by insulin resistance, dyslipidemia (high triglycerides [TG], low high-density lipoprotein cholesterol (HDLC)), and body fat redistribution [1–5]. Numerous etiologic factors contribute to this complex phenotype, including the effects of antiretroviral drugs, factors specific to the HIV virus, inflammatory mechanisms related to the infection or its treatment, and genetic predisposition [6–8]. Hypertriglyceridemia, stemming from distinct defects in regional adipocyte function and dysregulated lipolysis [9–11], and characterized by elevated triglyceride content in both very low density lipoprotein (VLDL) particles and chylomicrons, is a defining hallmark of MetS in HIV patients on HAART [10,11].
Insulin resistance has been associated with low HDL-C and hypertriglyceridemia, so that these two reciprocally related plasma lipid markers are characteristic features of MetS and diabetes [12–16]. Low HDL-C has been linked mechanistically to hypertriglyceridemia by changes in the activity of CETP, which exchanges cholesteryl esters in HDL for triglycerides in VLDL [12]. Hence, an inverse relationship between TG and HDL-C [17], associated with a concomitant increase in CETP mass and activity [18], are consistently observed in unselected non-HIV patient populations with MetS or diabetes. In contrast to these widely confirmed findings, we found, in the course of a longitudinal study of well-characterized HIV patients on stable HAART selected for the presence of hypertriglyceridemia [19], that elevated triglyceride levels were not consistently associated with low HDL-C levels. This apparent lack of an inverse relationship between TG and HDL-C suggested that dyslipidemic HIV patients on HAART might have unique defects in lipoprotein metabolism related to TG and cholesteryl ester transfer. Hence, we explored the relationship between plasma TG and HDL-C in hypertriglyceridemic HIV patients on stable HAART compared to HIV-negative patients with or without hypertriglyceridemia. We also compared CETP mass and activity between the HIV/HAART and normotriglyceridemic HIV-negative groups.
Methods
Subjects
The protocols were approved by the Institutional Review Boards of Baylor College of Medicine, Legacy Community Health Center and the Harris County Hospital District. Written informed consent was obtained in Spanish or English.
Following a 10 hour overnight fast, plasma samples were obtained from 179 HIV-infected patients during baseline testing for the Heart Positive Study, a double-blind, randomized, placebo-controlled study of the effects of intensive diet, exercise, niacin, and/or fenofibrate on HIV/HAART-associated dyslipidemia (ClinicalTrials.gov ID: NCT00246376). The details of the study design and primary outcomes have been previously published [19]. The patients were HIV-positive adults on a stable HAART regimen for a minimum of six months, with fasting hypertriglyceridemia (TG = 321 ± 194 mg/dL [mean ± SD] on no lipid lowering medications). The HIV patients were compared to two HIV-negative control groups: a healthy normotriglyceridemic (NL) group and a hypertriglyceridemic group with type IV hyperlipidemia (type IV HTG). The NL group was recruited by advertisement, and included 31 healthy, lean, persons with no known chronic illness and on no medications, with mean fasting TG 93 ± 29 mg/dL. The type IV HTG group comprised 40 patients recruited for a separate study of dietary counseling for severe hypertriglyceridemia, with mean fasting plasma TG 905 ± 475 mg/dL. (The type IV hypertriglyceridemic patients were selected as a comparison group who mimic the lipid profile of HIV patients, i.e., hypertriglyceridemia with low HDL-C, without a severe or primary defect in LDL-C).
Exclusion criteria for the HIV subjects in the Heart Positive Study were use of non-standard diets, nutritional supplements (including fish oils and creatine), as well as steroidal or anabolic agents (including testosterone in the absence of hypogonadism or at supraphysiologic doses), or any medications (other than combination antiretroviral agents) or lipid lowering therapy (including statins, fibrates, niacin, bile acid sequestrants) during the three months prior to entering the study. Other exclusion criteria included presence of adrenal insufficiency, untreated hypogonadism, untreated hypo- or hyperthyroidism, pregnancy, use of warfarin-based anticoagulants, renal insufficiency, alcoholism or hepatic dysfunction. An additional exclusion criterion for the HIV patients as well as for the NL control subjects was a history of diabetes or fasting plasma glucose > 125 mg/dL or two-hour glucose level in an oral glucose tolerance test > 200 mg/dl.
Exclusion criteria for the type IV HTG subjects in the dietary counseling study were treatment with a fibrate within the prior three months, treatment with an ω-3 fatty acid product, cod-liver oil, or dietary fiber with lipid-lowering effects within the prior four weeks, consumption of cold-water fish more than once per week, a history of myocardial infarction or other serious illnesses within the past six months, serum alanine or aspartate transaminase more than three times the upper limit of normal, serum creatinine >176.8μmol/L, platelets <60 × 109 g/L, hemoglobin <100g/L, pregnancy or breast-feeding, alcohol or drug abuse, fasting plasma glucose >300 mg/dL, or use of oral antidiabetic agents or insulin.
Plasma lipid fractions were measured in fasting plasma samples from all these subjects. Samples from 19 subjects randomly selected from the NL group and 87 patients randomly selected from the HIV group were also tested for plasma CETP mass and activity.
Analytical methods
All laboratory analyses were performed in CLIA-certified laboratories. For the HIV subjects, fasting plasma lipid levels and glucose were measured in the Atherosclerosis Clinical Laboratory of Baylor College of Medicine using an Olympus AU400e automated chemistry analyzer in which total cholesterol is measured using cholesterol dehydrogenase combined with the esterase and oxidase into a single enzymatic reagent. Triglycerides are measured by a procedure based on a series of coupled enzymatic reactions after hydrolysis by microbial lipases to release glycerol and fatty acids - glycerol is phosphorylated by glycerol kinase to produce glycerol-3-phosphate, which is oxidized by glycerol phosphate oxidase to produce H2O2 and dihydroxyacetone phosphate. The H2O2 oxidatively couples p-chlorophenol and 4-aminoantipyrine with catalysis by peroxidase to produce a red dye with an absorbance maximum at 500 nm; the increase in absorbance at 520/600 nm is proportional to the triglyceride content of the sample. HDL cholesterol is measured in two steps - first, free cholesterol in non-HDL-lipoproteins is solubilized and consumed by cholesterol oxidase, peroxidase, and N, N-bis (4-sulph obutyl)-m-toluidine (DSBmT) to generate a colorless end product, and second, a detergent selectively solubilizes HDL- lipoproteins. The HDL cholesterol is released for reaction with cholesterol esterase, cholesterol oxidase and a chromogen system to yield a blue color complex which can be measured bichromatically at 600/700nm. The resulting increase in absorbance is directly proportional to the HDL-C concentration. Plasma LDL-cholesterol concentrations were calculated according to the Friedewald equation if triglycerides were <400 mg/dL; direct LDL-C was measured for most of the subjects in whom triglycerides were >400 mg/dL. Plasma glucose was measured by the glucose oxidase method.
CD4 T cell counts were measured by LabCorp (Burlington, NC) using flow cytometry. HIV-1 viral load (VL) was measured by LabCorp or Quest Diagnostics (Madison, NJ) using either of two quantitative real-time PCR assays (routine, with a lower limit of 400 copies/cc, or ultrasensitive, with a lower limit of 50 copies/cc). VL values measured as <400 copies/cc by the first assay were assigned a value of 200 copies/cc and all the VL values were log-transformed prior to analysis.
For NL and type IV HTG groups, all plasma analyses were determined by National Health Laboratories (Houston, TX), a certified laboratory using methods similar to those as described above.
CETP mass was determined by ELISA according to the vendor’s instructions (Wako Pure Chemical Industries, Osaka, Japan). CETP activity was determined using a fluorescent neutral lipid transfer assay (Roar Biomedical, Inc., New York, NY).
Statistical methods
All values are expressed as mean + SD. Statistical analyses were performed using SPSS version 17.0. Normality of continuous variables was assessed using the Shapiro-Wilk test. Appropriate parametric and non-parametric tests were used to compare continuous variables among the HIV, NL, and type IV HTG groups. Chi-squared analysis was used to compare the groups with respect to categorical variables. Formal power calculations were not performed to define sample size for the CETP analysis, but the number of HIV/HAART patients randomly selected for this analysis (N=87) was 64% larger than the sample studied in the only previous study that of CETP activity in HIV patients, which reported it was significantly increased in these patients, with or without HAART [20]. An independent groups t-test was used to compare the HIV and NL groups for CETP mass and activity, as well as for the comparison of HIV and NL groups with regard to LDL-C levels. A two-tailed probability of P<0.05 was considered statistically significant. Linear regression analysis was used to assess the correlation between CD4 count and log CETP activity. Analysis of covariance (ANCOVA) was used to compare the relationship between HDL-C and triglycerides among the 3 groups. For the variables used in the ANCOVA models, multiple mathematical transformations were tested, and the transformed variable with the least significant p-value by normality tests (i.e., most normal distribution) was selected for the model.
Results
Clinical and anthropomorphic characteristics of the study subjects are shown in Table 1. The mean age for HIV subjects (44 ± 8 y [mean ± SD]) was between that for NL (40 ± 10 y) and for type IV HTG subjects (51 ± 9 y). The type IV HTG and HIV groups included more men than the NL group. Body mass index (BMI) of the HIV group (27 ± 4 kg/m2) was greater than that of the NL group (22.7 ± 3 kg/m2) but less than that of the type IV HTG group (29.3 ± 4 kg/m2). Waist-to-hip ratio of the HIV group (0.94 ± 0.1) was also greater than that of the NL group (0.8 ± 0.06). Fasting glucose in the HIV group (96 ± 14 mg/dL) was higher than in the NL group (87 ± 8 mg/dL), but lower than in the type IV HTG group (118 ± 43 mg/dL). Fasting plasma triglycerides were higher in the HIV group (321 ± 194 mg/dL) than in the NL group (93 ± 29 mg/dL) but lower than in the type IV HTG group (905 ± 475 mg/dL). Fasting total and LDL cholesterol levels were similar in the HIV and NL groups, but total cholesterol was higher in the type IV HTG group (339 ± 82 mg/dL) than in the HIV group (212 ± 50 mg/d). Mean HDL-C was lower in the HIV group (39 ±9 mg/dL) than in the NL group (60 ± 13 mg/dL), but higher than in the type IV HTG group (20 ± 7 mg/dL). Non-HDL-C was higher in the HIV group than in NL but lower than in type IV HTG. The HIV patients (all of whom were on stable HAART) had a mean CD4+ T cell count of 500 ± 288 K/cc). Plasma HIV-1 viral load was undetectable in 84% of the HIV patients.
Table 1.
Demographics and plasma lipid profiles of study subjects.
| Variable | Normolipidemic subjects | Type IV hyperTG patients | HIV patients |
|---|---|---|---|
|
| |||
| N | 31 | 40 | 179 |
|
| |||
| Age (y) | 40 ± 10 | 51 ± 9 | 44 ± 8a |
|
| |||
| Male (n) | 10 | 22 | 156 |
|
| |||
| BMI (kg/m2) | 22.7 ± 3 | 29.3 ± 4 | 27 ± 4a,b |
|
| |||
| Systolic BP (mmHg) | 111 ± 12 | 134 ± 16 | 129±13 |
|
| |||
| Diastolic BP (mmHg) | 68 ± 9 | 85 ± 8 | 84 ± 10 |
|
| |||
| Fasting Glucose (mg/dL) | 87 ± 8 | 118 ± 43 | 96 ± 14a,b |
|
| |||
| Total Cholesterol (mg/dL) | 195 ± 36 | 339 ± 82 | 212 ± 50b |
|
| |||
| HDL-C (mg/dL) | 60 ± 13 | 20 ± 7 | 39 ± 9a,b |
|
| |||
| LDL-C (mg/dL) | 117 ± 29 | – | 117 ± 44 |
|
| |||
| Non-HDL-C (mg/dL) | 135 ± 33 | 319 ± 80 | 174 ± 46a,b |
|
| |||
| Triglycerides (mg/dL) | 93 ± 29 | 905 ± 475 | 321 ± 194a,b |
|
| |||
| HAART Strata* | 122 | ||
| PI-containing regime | – | – | 44 |
| NNRTI-containing regime | – | – | 13 |
| 3-NRTI regime | – | – | |
|
| |||
| CD4 count (K/mm3) | – | – | 500 ± 288 |
|
| |||
| Log Viral Load (ln copies/mL) | – | – | 3.52 ± 4.5 |
All values are mean ± SD
HAART Strata: at the time of randomization in the Heart Positive Study, all HIV patients were stratified by these three commonly-used combinations of ART classes. PI = protease inhibitor, NNRTI = non-nucleoside reverse transcriptase inhibitor, NRTI = nucleoside reverse transcriptase inhibitor.
P<0.05 for HIV vs. normolipidemic subjects
P<0.05 for HIV vs. Type IV hypertriglyceridemic patients.
The slope-intercept relationships between HDL-C and triglyceride levels in the three groups showed some differences. The slopes were similar in all three groups, and the models revealed poor correlation of HDL-C to TG in all, suggesting that not all the differences in HDL-C are explained by differences in TG (Figure 1). Although the mathematical slopes were not significantly different among the three groups (P= 0.85 for the interaction term), the HDL-C values (y-intercepts) were very different (9.24 ± 0.45, 8.16 ± 0.54, 6.70 ± 0.65, sqrt(HDL-C), P<0.001) for controls, HIV and HTG respectively. The difference between the HDL-C intercepts in the three groups remained significant even after controlling for age, BMI, gender, fasting glucose levels, CD4 count (<300/cc or > 300/cc), detectable viral load and triglyceride levels (7.18 ± 0.20, 6.20 ± 0.05 and 4.55 ± 0.15 sqrt(HDL-C) for NL, HIV and HTG, respectively, P <0.001) for NL, HIV and HTG, respectively. (HDL-C values were transformed to sqrtHDL-C to normalize the data, as the ANCOVA models assume that all variables are normally distributed.) Significant predictors of HDL-C levels included gender (P=0.006), fasting glucose levels (P=0.02), triglycerides (P<0.0001) and HIV status (P=0.0001).
Figure 1.
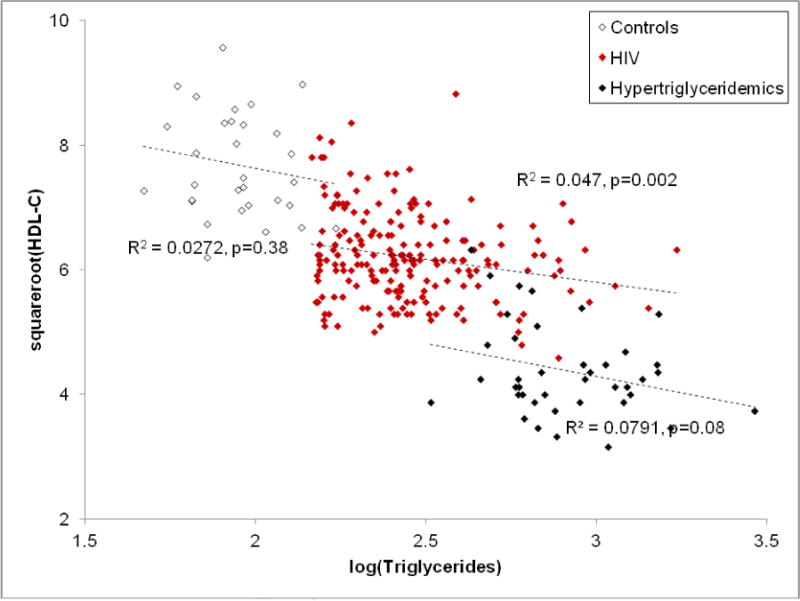
Relationship between HDL-C and TG levels in NL, HIV/HAART and type IV HTG patients.
CETP mass and activity were measured in fasting plasma samples in a randomly selected subset of 19 NL and 87 HIV subjects. CETP mass was greater in the HIV subjects than in the NL subjects (1.47 ± 0.53 compared to 0.93 ± 0.27 μg/mL, P<0.0001) (Table 2). CETP activity was not significantly different between the HIV and the NL subjects (32.55 ± 19.81 compared to 25.27 ± 5.89 pmol/0.5ml/3h, P=0.50), but CETP specific activity (CETP activity/CETP mass) was lower in the HIV group (22.67 ± 13.46 compared to 28.46 ± 8.24 nmol/μg/h, P=0.001). Within the HIV group, 81% had undetectable viral load. Patients with undetectable viral load had lower CETP mass than those with detectable viral load (1.30 μg/mL (95% CI 1.07, 1.72) compared to 1.79 μg/mL (1.30, 2.01), P=0.002); however there were no significant differences between these two subgroups in regard to CETP activity or specific activity.
Table 2.
CETP mass and activity in normolipidemic subjects and HIV patients.
| Variable | Normolipidemic subjects | HIV patients | P |
|---|---|---|---|
| N | 19 | 87 | |
| CETP mass (μg/ml) | 0.93 ± 0.27 | 1.47 ± 0.53 | P < 0.0001 |
| CETP activity (pmol/μL/h) | 25.27± 5.73 | 32.55± 19.81 | P< 0.50 |
| CETP specific activity (nmol/μg/h) | 28.46 ± 8.24 | 22.67 ± 13.46 | P = 0.001 |
A multivariate analysis was performed to identify variables that might be related to CETP mass or activity, using age, BMI, gender, fasting glucose levels, CD4 count (<300/cc or > 300/cc), detectable viral load and triglyceride levels as covariates). CD4 count was inversely related to CETP activity in the 77 patients for whom a CD4 count was available (Table 3) - Spearman’s rho correlation coefficient was –0.3121, P = 0.004. HIV patients with CETP activity greater 40 pmol/μL/h had a lower mean CD4 count than those with CETP activity less than 40 pmol/μL/h (P<0.001). The regression of log CETP activity to CD4 count was significant (P=0.002). There was a correlation between these two variables (r=0.332) that explained 11% of the variation in log CETP activity. On univariate analysis, CD4 count was associated with both CETP mass and activity.
Table 3.
Relationship between CETP activity and CD4+ T cell levels.
| Variable | HIV patients | HIV patients with CETP activity <40 pmol/μL/h | HIV patients with CETP activity>40 pmol/μL/h |
|---|---|---|---|
| N | 77 | 58 | 19 |
| CD4 count (K/mm3) | 519 ± 296 | 579 ± 305 | 336 ± 160 |
| CETP activity (pmol/μL/h) | 32.84 ± 20.6 | 22.3 ± 9.0 | 64.9 ± 12.0 |
On ANCOVA analysis, when HIV was included in the model, HIV status was a strong predictor of HDL-C level (P<0.001) and eclipsed any direct effect of CETP mass or activity (P= NS). When age, gender, BMI, fasting glucose, triglycerides, detectable viral load, CD4 >200/cc, and HAART strata were included in full ANCOVA models, viral load was a significant predictor of CETP mass (P <0.01), while CD4 count was associated with CETP activity and specific activity (P <0.01). HAART strata was associated with CETP mass (P =0.01) but not activity (P =NS). In summary, CD4 >300/cc and detectable viral load had stronger associations with CETP mass or activity than HAART strata.
Discussion
The present results indicate that hypertriglyceridemic HIV patients on HAART have relatively normal CETP activity. There is an inverse correlation between CETP activity and CD4 count in these patients, but their relatively high HDL-C levels in the face of hypertriglyceridemia are not explained by altered CETP mass or activity.
HIV/HAART patients are known to have a high frequency of MetS and a unique form of dyslipidemic lipodystrophy [4–7]. Given that these conditions are associated with increased risk for the development of cardiovascular disease [21–23], it is important to explore the underlying mechanisms so that the appropriate therapies might be developed. Among the serum lipid markers of MetS, hypertriglyceridemia is a striking hallmark of the condition in HIV patients on HAART [4]. In unselected populations of persons with MetS or insulin resistance, there is a well-established relationship between the levels of plasma TG and HDL-C [17, 18]. In the course of recruiting a large number of HIV patients on stable HAART for the Heart Positive Study [19], we observed only a modest decrease in HDL-C in the face of moderate to severe hypertriglyceridemia. We hypothesized that there is an altered relationship of HDL and TG in HIV patients and that this might reflect an unusual form of MetS in HIV/HAART patients. Our findings show that a plot of HDL-C vs. TG shows a different slope-intercept relationship among HIV/HAART patients than among normolipidemic or hypertriglyceridemic persons without HIV infection, in that the y-intercept is different. HDL-C levels in HIV patients on HAART are lower than in HIV-negative normolipidemic persons, but not as low as in HIV-negative hypertriglyceridemic patients. In a multivariate analysis adjusting for multiple factors including TG levels, the HDL-C levels were significantly different between the HIV, NL and HTG groups; HDL-C levels among HIV patients on HAART were intermediate between those of NL and HTG.
CETP plays a key role in the reciprocal relationship between HDL-C and TG in conditions associated with MetS and insulin resistance in the general population [12, 13, 17]. In hypertriglyceridemic states, VLDL-TG levels are elevated and provide a very large TG pool that could exchange for HDL-CE. As a consequence of the elevated VLDL-triglycerides, HDL are depleted of CE and enriched in triglycerides; there is little change in VLDL composition because its turnover is much faster than that of HDL. CETP activity is generally proportional to CETP mass [12], and variation in CETP mass and/or activity is closely associated with lipoprotein phenotype and notably, HDL-C levels, in both normolipidemic and dyslipidemic subjects [15–18]. Surprisingly, in the HIV/HAART patients, CETP mass was elevated but its activity was not proportionally increased. Total CETP activities in NL and HIV groups were not different, so the altered relationship between HDL-C and TG in the HIV/HAART patients is not due to this factor. A possible, though speculative, explanation for this lowered specific activity may be the presence of endogenous inhibitors of CETP in the HIV patients’ plasma samples. Both apo F (formerly known as lipid transfer inhibiting protein) and apo C1 have been shown to inhibit CETP [24–26] and thus regulate HDL metabolism and subfractions, and their levels in the plasma of HIV patients have not been determined. There was also no significant correlation between CETP activity and HDL-C levels in the HIV patients, suggesting a CETP-resistant state and lending further support to the notion that unique mechanisms underlie VLDL-triglyceridemia, a hallmark of MetS in HIV patients on HAART [4, 9–11].
CETP mass and activity were not measured in the type IV hypertriglyceridemic patients in this study - however, CETP activity in such patients has been reported to be very different from the our results in the HIV/HAART patients, specifically, they are elevated compared to normotriglyceridemic controls, and inversely related to HDL-C [27]. Thus, the present results in the HIV patients compared to NL are opposite in direction to those reported in non-HIV hypertriglyceridemic persons compared to non-HIV normotriglyceridemic persons.
Rose et al reported a detailed comparison of HDL metabolism in HIV-positive and HIV-negative subjects in which they noted increased CETP mass in patients with HIV infection irrespective of ongoing treatment with protease-inhibitor containing antiretroviral therapy [20]. They also noted absence of a correlation between HDL-C and TG levels in the HIV patients. However, unlike the present study, they found an inverse correlation between CETP activity and HDL-C levels, which led them to propose that elevated CETP activity enhances transfer of TG from VLDL to HDL. It is likely that the smaller number and heterogeneity of patients studied by Rose et al might account for the difference between their results and ours – they studied 25 untreated and 28 antiretroviral-treated HIV subjects, while in the present study CETP mass and activity were measured in 87 HIV patients, all selected for hypertriglyceridemia while on stable HAART.
Lipoatrophic or “mixed” forms of HIV-associated lipodystrophy are invariably associated with hypertriglyceridemia [4, 28, 29]. This is linked to marked adipocyte dysfunction, resulting in accelerated lipolysis in the fasted state [10, 30, 31] with net increase in free fatty acids released into the plasma [10] and faster flux of FFA’s into the liver, resulting in accelerated synthesis and export of VLDL-TG. There are also profound abnormalities in the disposal of meal-derived chylomicron-TG’s in HIV patients as a result of adipocyte dysfunction [11, 30]. We previously demonstrated a defect in TG transfer from chylomicrons to adipose depots, likely due to impaired “trapping” of fatty acids by lipoprotein lipase [11, 32]. Thus, abnormalities in the metabolism of both VLDL- and chylomicron-TG contribute to hypertiglyceridemia in HIV patients on HAART. Less is known regarding abnormalities in HDL metabolism in HIV patients, which are also likely to be unique in the face of the potential resistance of HDL-C to cholesteryl ester transfer. Elegant studies reported by Mujawar et al. suggest that reverse cholesterol transfer is impaired in HIV-infected macrophages due to the inhibitory effect of the HIV protein Nef on ABCA-1 expression and function [33].
CD4 count in patients on HAART reflects severity of the HIV infection and the degree of immune reconstitution. Rose et al have previously shown that this marker of immune recovery is related to HDL metabolism in HIV/HAART patients, such that Apo A1 [20] and HCL-C [34] levels are positively correlated to CD4 count. The present investigation uncovered a different aspect of this phenomenon, as increased CETP activity, reflecting a more dysmetabolic state, was noted in the patients with lower CD4 counts following HAART.
Several limitations of our study could affect the conclusions. The HIV patients and type IV HTG patients were not recruited as part of the same study, hence there were slight differences in their respective inclusion / exclusion criteria. However, these criteria overlapped in all important respects relevant to the analyses in this study. The use of a “convenience sample” to address the issue of HDL-C – TG relationships may be justified by the fact that both the hypertriglyceridemic cohorts were large and well-defined, and the normal healthy controls also comprised a reasonably large sample for normative data on CETP parameters. CETP measurements were performed in a randomly-selected subset of the HIV patients, and compared to a smaller group of healthy controls without a priori power calculations. However, post-hoc power calculations indicate that the sample sizes chosen were sufficient to detect group differences with power of 98–99% at P<0.05 for CETP mass and specific activity. Moreover, the HIV patients comprised a large number (64% larger than in the only other study of CETP measurements in HIV patients [20]). Another limitation is that, despite the fact that ANCOVA did not show significant differences between genders in regard to the measured parameters, the number of enrolled women was low.
Collectively these data point to distinctive features and novel mechanisms governing lipid kinetics and adipocyte function in HIV patients on HAART. Among these features must now be included an altered relationship between HDL-C and TG in the presence of hypertriglyceridemia and other parameters of a lipotoxic metabolic syndrome. Total CETP activity is not altered in HIV patients with MetS, hence the presence of endogenous inhibitors that modify CETP specific activity, or non-CETP-based mechanisms, may be responsible for this altered relationship. In a broader context, these results suggest that there are determinants of HLD-C levels in HIV patients on HAART that are independent of triglyceride levels. Future studies should be directed at elucidating the mechanisms underlying the unique form of dyslipidemia and MetS associated with HIV/HAART.
Acknowledgments
The authors thank Ms. Charles Rhodes and the staff of the Atherosclerosis Laboratory for performing the lipid / lipoprotein measurements. This work was supported by RO1-HL47696 and the Alkek Foundation (A.B.)
Abbreviations
- HAART
highly-active antiretroviral therapy
- CETP
cholesteryl ester transfer protein
- TG
triglycerides
- HDL-C
high-density lipoprotein cholesterol
- VLDL
very low density lipoprotein
- MetS
Metabolic Syndrome
Footnotes
Disclosure: The authors declare that they have nothing to disclose.
Author Contributions: Catherine N. Vu, Raul Ruiz-Esponda, Evelyn Chang and Ivonne Coraza recruited patients and subjects, and acquired data, maintained the database and performed preliminary analyses; Henry Pownall helped with study design and data interpretation and reviewed the manuscript; Ron C. Hoogeveen performed the biochemical analyses and reviewed the manuscript; Eric Yang performed the statistical analyses; Baiba Gillard helped with data interpretation and analysis and reviewed the manuscript; Ashok Balasubramanyam designed the study, interpreted the data and drafted the manuscript.
Publisher's Disclaimer: This is a PDF file of an unedited manuscript that has been accepted for publication. As a service to our customers we are providing this early version of the manuscript. The manuscript will undergo copyediting, typesetting, and review of the resulting proof before it is published in its final citable form. Please note that during the production process errors may be discovered which could affect the content, and all legal disclaimers that apply to the journal pertain.
References
- 1.Carr A, Samaras K, Burton S, et al. A syndrome of peripheral lipodystrophy, hyperlipidaemia and insulin resistance in patients receiving HIV protease inhibitors. AIDS. 1998;12:F51–F58. doi: 10.1097/00002030-199807000-00003. [DOI] [PubMed] [Google Scholar]
- 2.Lo JC, Mulligan K, Tai VW, et al. “Buffalo hump” in men with HIV-1 infection. Lancet. 1998;351:867–870. doi: 10.1016/S0140-6736(97)11443-X. [DOI] [PubMed] [Google Scholar]
- 3.Saint-Marc T, Partisani M, Poizot-Martin I, et al. Fat distribution evaluated by computed tomography and metabolic abnormalities in patients undergoing antiretroviral therapy: preliminary results of the LIPOCO study. AIDS. 2000;14:37–49. doi: 10.1097/00002030-200001070-00005. [DOI] [PubMed] [Google Scholar]
- 4.Balasubramanyam A, Jahoor F, Jones P, Sekhar RV, Pownall HJ. Pathogenesis of the HAART-associated metabolic syndrome: a model of “systemic steatosis”. Curr Opin Lipidol. 2004;15:59–67. doi: 10.1097/00041433-200402000-00011. [DOI] [PubMed] [Google Scholar]
- 5.Magkos F, Mantzoros CS. Body fat redistribution and metabolic abnormalities in HIV-infected patients on highly active antiretroviral therapy: novel insights into pathophysiology and emerging opportunities for treatment. Metabolism. 2011;60:749–753. doi: 10.1016/j.metabol.2010.09.011. [DOI] [PMC free article] [PubMed] [Google Scholar]
- 6.Tsiodras S, Mantzoros C, Hammer S, Samore M. Effects of protease inhibitors on hyperglycemia, hyperlipidemia, and lipodystrophy: a 5-year cohort study. Arch Intern Med. 2000;160:2050–2056. doi: 10.1001/archinte.160.13.2050. [DOI] [PubMed] [Google Scholar]
- 7.Saint-Marc T, Partisani M, Poizot-Martin I, et al. A syndrome of peripheral fat wasting (lipodystrophy) in patients receiving long-term nucleoside analogue therap. AIDS. 1999;13:1659–1667. doi: 10.1097/00002030-199909100-00009. [DOI] [PubMed] [Google Scholar]
- 8.Kino T, Gragerov A, Kopp JB, et al. The HIV-1 virion-associated protein Vpr is a coactivator of the human glucocorticoid receptor. J Exp Med. 1999;189:51–62. doi: 10.1084/jem.189.1.51. [DOI] [PMC free article] [PubMed] [Google Scholar]
- 9.Austin MA. Serum triglyceride and coronary heart disease. Aterioscler Thromb. 1991;11:2–14. doi: 10.1161/01.atv.11.1.2. [DOI] [PubMed] [Google Scholar]
- 10.Sekhar RV, Jahoor F, White AC, et al. Metabolic basis of HIV-lipodystrophy syndrome. Am J Physiol Endocrinol Metab. 2002;283:E332–7. doi: 10.1152/ajpendo.00058.2002. [DOI] [PubMed] [Google Scholar]
- 11.Sekhar RV, Jahoor F, Pownall HJ, et al. Severely dysregulated disposal of postprandial triacylglycerols exacerbates hypertriacylglycerolemia in HIV lipodystrophy syndrome. Am J Clin Nutr. 2005;81:1405–10. doi: 10.1093/ajcn/81.6.1405. [DOI] [PubMed] [Google Scholar]
- 12.Tall AR. Serum cholesteryl ester transfer protein. J Lipid Res. 1993;34:1255–74. [PubMed] [Google Scholar]
- 13.Guerin M, Le Goff W, Lassel TS, et al. Proatherogenic role of elevated cholesteryl ester transfer from HDL to VLDL1 and dense LDL in type 2 diabetes:impact of the degree of triglyceridemia. Arterioscler Thromb Vasc Biol. 2001;21:282–288. doi: 10.1161/01.atv.21.2.282. [DOI] [PubMed] [Google Scholar]
- 14.Bhatnagar D, Durrington PN, Kumar S, et al. Plasma lipoprotein composition and cholesteryl ester transfer from high density lipoproteins to very low density and low density lipoproteins in patients with noninsulin-dependent diabetes mellitus. Diabet Med. 1995;13:139–144. doi: 10.1002/(SICI)1096-9136(199602)13:2<139::AID-DIA15>3.0.CO;2-C. [DOI] [PubMed] [Google Scholar]
- 15.Riemens S, van Tol A, Sluiter W, Dullaart RPF. Elevated plasma cholesteryl ester transfer in NIDDM: relationships with apolipoprotein B-containing lipoproterins and phospholipid transfer protein. Atherosclerosis. 1998;140:71–79. doi: 10.1016/s0021-9150(98)00111-7. [DOI] [PubMed] [Google Scholar]
- 16.Niemeijer-Kanters SD, Dalliga-Thie GM, Rruijter-Heijstek FC, et al. Effect of intensive lipid lowering strategy on low density lipoprotein particle size in patients with type 2 diabetes mellitus. Atherosclerosis. 2001;156:209–216. doi: 10.1016/s0021-9150(00)00642-0. [DOI] [PubMed] [Google Scholar]
- 17.Pownall HJ, Brauchi D, Kilinc C, et al. Correlation of serum triglyceride and its reduction by omega-3 fatty acids with lipid transfer activity and the neutral lipid composition of high-density and low-density lipoproteins. Atherosclerosis. 1999;143:285–297. doi: 10.1016/s0021-9150(98)00301-3. [DOI] [PubMed] [Google Scholar]
- 18.Bagdade JD, Lane JT, Subbaiah PV, et al. Accelerated cholesteryl ester transfer in noninsulin-dependent diabetes mellitus. Atherosclerosis. 1993;104(1–2):69–77. doi: 10.1016/0021-9150(93)90177-v. [DOI] [PubMed] [Google Scholar]
- 19.Balasubramanyam A, Coraza I, Smith EO, Scott LW, Patel P, Iyer D, Taylor AA, Giordano TP, Sekhar RV, Clark P, Cuevas-Sanchez E, Kamble S, Ballantyne CM, Pownall HM. Combination of niacin and fenofibrate with lifestyle changes improves dyslipidemia and hypoadiponectinemia in HIV Patients on ART: results of Heart Positive, a randomized, controlled study. J Clin Endocrinol Metab. 2011;96:2236–2247. doi: 10.1210/jc.2010-3067. [DOI] [PMC free article] [PubMed] [Google Scholar]
- 20.Kaplan RC, Kingsley LA, Sharrett AR, Li X, Lazar J, Tien PC, et al. Ten-year predicted coronary heart disease risk in HIV-infected men and women. Clin Infect Dis. 2007;45(8):1074–81. doi: 10.1086/521935. [DOI] [PubMed] [Google Scholar]
- 21.Triant VA, Lee H, Hadigan C, Grinspoon SK. Increased acute myocardial infarction rates and cardiovascular risk factors among patients with human immunodeficiency virus disease. J Clin Endocrinol Metab. 2007;92(7):2506–12. doi: 10.1210/jc.2006-2190. [DOI] [PMC free article] [PubMed] [Google Scholar]
- 22.Serraino D, Bruzzone S, Zucchetto A, Suligoi B, De Paoli A, Pennazza S, et al. Elevated risks of death for diabetes mellitus and cardiovascular diseases in Italian AIDS cases. AIDS Res Ther. 2010;7(1):11. doi: 10.1186/1742-6405-7-11. [DOI] [PMC free article] [PubMed] [Google Scholar]
- 23.Paromov VM, Morton RE. Lipid transfer inhibitor protein defines the participation of high density lipoprotein subfractions in lipid transfer reactions mediated by cholesterol ester transfer protein (CETP) J Biol Chem. 2003;278(42):40859–40866. doi: 10.1074/jbc.M306580200. [DOI] [PubMed] [Google Scholar]
- 24.Morton RE, Greene DJ. Regulation of lipid transfer between lipoproteins by an endogenous plasma protein: selective inhibition among lipoprotein classes. J Lipid Res. 1994;35(5):836–847. [PubMed] [Google Scholar]
- 25.Gautier T, Masson D, de Barros JP, Athias A, Gambert P, Aunis D, Metz-Boutigue MH, Lagrost L. Human apolipoprotein C-I accounts for the ability of plasma high density lipoproteins to inhibit the cholesteryl ester transfer protein activity. J Biol Chem. 2000;275(48):37504–37509. doi: 10.1074/jbc.M007210200. [DOI] [PubMed] [Google Scholar]
- 26.Rose H, Hoy J, Woolley I, et al. HIV infection and high density lipoprotein metabolism. Atherosclerosis. 2008;199:79–86. doi: 10.1016/j.atherosclerosis.2007.10.018. [DOI] [PMC free article] [PubMed] [Google Scholar]
- 27.Föger B, Ritsch A, Doblinger A, Wessels H, Patsch JR. Relationship of plasma cholesteryl ester transfer protein to HDL cholesterol. Studies in normotriglyceridemia and moderate hypertriglyceridemia. Arterioscler Thromb Vasc Biol. 1996;16:1430–1436. doi: 10.1161/01.atv.16.12.1430. [DOI] [PubMed] [Google Scholar]
- 28.Periard D, Telenti A, Sudre P, et al. Atherogenic dyslipidemia in HIV-infected individuals treated with protease inhibitors. The Swiss HIV Cohort Study. Circulation. 1999;100:700–705. doi: 10.1161/01.cir.100.7.700. [DOI] [PubMed] [Google Scholar]
- 29.Carr A, Samaras K, Thorisdottir A, Kaufmann GR, Chisholm DJ, Cooper DA. Diagnosis, prediction, and natural course of HIV-1 protease-inhibitor-associated lipodystrophy, hyperlipidaemia, and diabetes mellitus: a cohort study. Lancet. 1999;353:2093–2099. doi: 10.1016/S0140-6736(98)08468-2. [DOI] [PubMed] [Google Scholar]
- 30.Reeds DN, Mittendorfer B, Patterson BW, et al. Alterations in lipid kinetics in men with HIV-dyslipidemia. Am J Physiol Endocrinol Metab. 2003;285:E490–E497. doi: 10.1152/ajpendo.00118.2003. [DOI] [PubMed] [Google Scholar]
- 31.Hadigan C, Borgonha S, Rabe J, et al. Increased rates of lipolysis among human immunodeficiency virus-infected men receiving highly active antiretroviral therapy. Metabolism. 2002;51:1143–1147. doi: 10.1053/meta.2002.34704. [DOI] [PubMed] [Google Scholar]
- 32.Ware LJ, Jackson AG, Wootton SA, et al. Antiretroviral therapy with or without protease inhibitors impairs postprandial TAG hydrolysis in HIV-infected men. Br J Nutr. 2009;102(7):1038–1046. doi: 10.1017/S0007114509338817. [DOI] [PubMed] [Google Scholar]
- 33.Mujawar Z, Rose H, Morrow M, et al. Human Immunodeficiency Virus Impairs Reverse Cholesterol Transport from Macrophages. PLoS Biology. 2006;4(11):e365. doi: 10.1371/journal.pbio.0040365. 1970–1983. [DOI] [PMC free article] [PubMed] [Google Scholar]
- 34.Rose H, Woolley I, Hoy J, et al. HIV infection and high-density lipoprotein: the effect of the disease vs the effect of treatment. Metabolism. 2006;55(1):90–95. doi: 10.1016/j.metabol.2005.07.012. [DOI] [PubMed] [Google Scholar]