

Abstract
Purpose
We assessed whether chemotherapy selection based on in situ ERCC1 and RRM1 protein levels would improve survival in patients with advanced non–small-cell lung cancer (NSCLC).
Patients and Methods
Eligible patients were randomly assigned 2:1 to the trial's experimental arm, which consisted of gemcitabine/carboplatin if RRM1 and ERCC1 were low, docetaxel/carboplatin if RRM1 was high and ERCC1 was low, gemcitabine/docetaxel if RRM1 was low and ERCC1 was high, and docetaxel/vinorelbine if both were high. In the control arm, patients received gemcitabine/carboplatin. The trial was powered for a 32% improvement in 6-month progression-free survival (PFS).
Results
Of 331 patients registered, 275 were eligible. The median number of cycles given was four in both arms. A tumor rebiopsy specifically for expression analysis was required in 17% of patients. The median time from informed consent to expression analysis was 11 days. We found no statistically significant differences between the experimental arm and the control arm in PFS (6.1 months v 6.9 months) or overall survival (11.0 months v 11.3 months). A subset analysis revealed that patients with low levels for both proteins who received the same treatment in both treatment arms had a statistically better PFS (P = .02) in the control arm (8.1 months) compared with the experimental arm (5.0 months).
Conclusion
This demonstrates that protein expression analysis for therapeutic decision making is feasible in newly diagnosed patients with advanced-stage NSCLC. A tumor rebiopsy is safe, required in 17%, and acceptable to 89% (47 of 53) of patients.
INTRODUCTION
Molecular analysis-directed selection of therapeutic agents for patients with advanced malignancies has resulted in substantial survival benefit for patients with chronic myelogenous leukemia,1 lung cancer,2–4 and melanoma.5 In non–small-cell lung cancer (NSCLC), recent investigations have uncovered other potentially actionable molecular alterations.6,7 In solid tumors, these alterations are rare, and resistance develops within a relatively short time interval.8 Chemotherapy produces response rates (RR) of 25% to 35% in treatment-naive NSCLC patients, suggesting that molecular markers can be used as determinants of treatment benefit. Several reports have suggested that ERCC1 and RRM1 are predictive in NSCLC.9–16
Correlative biomarker analyses from two randomized phase III trials have demonstrated that in situ protein levels of ERCC1 are associated with improved survival in patients treated adjuvantly with cisplatin-containing regimens9 or better response in advanced-stage patients treated with a regimen containing carboplatin (Cb).10 This was preceded by multiple small studies demonstrating an association between ERCC1 mRNA levels and therapeutic benefit from various platinum-containing regimens.11–14 Likewise, RRM1 has been validated as a predictive biomarker for response to gemcitabine (G) using in situ protein levels in a phase III trial10 and in smaller studies using mRNA levels.12–14
Two prior prospective studies in NSCLC utilized tumoral mRNA levels of ERCC1 alone or ERCC1 and RRM1 to assign patients to a regimen containing and not containing Cb and a regimen containing and not containing G, and both trials demonstrated promising improvements in patients' RR.15,16
In this article, we report the results of an international phase III trial that utilized in situ protein levels of ERCC1 and RRM1 as determined by automated quantitative analysis (AQUA) to assign patients to Cb if ERCC1 levels were low and G if RRM1 levels were low versus a control arm of unselected chemotherapy consisting of GCb.
PATIENTS AND METHODS
Trial Design
Our trial complied with the Helsinki Declaration and was approved by the institutional review boards. Eligibility criteria included a diagnosis of NSCLC, stage IV or wet IIIB disease (American Joint Committee on Cancer Staging Manual, version 6), availability of formalin-fixed and paraffin-embedded (FFPE) tumor specimens or willingness to undergo a biopsy to obtain such a specimen, and disease measurable or evaluable by RECIST criteria.17 Patients were randomly assigned 2:1 to the experimental versus control arms using a telephone-accessible randomization list for each stratum, which included prior (neo)adjuvant therapy, performance status, and sex.
Disease response was sequentially assessed after every two cycles by computed tomography and other imaging modalities as appropriate. Patients without disease progression continued therapy for up to six cycles. Patients received follow-up every 3 months for an additional year to determine disease status. The primary end point was progression-free survival (PFS) at 6 months, with an anticipated rate of 50% in the experimental and 38% in the control arms based on previous phase II trials.16,18,19 Other end points included overall survival, best disease response (RR), feasibility, toxicity (assessed by Common Terminology Criteria for Adverse Events, version 3.0), and additional relevant molecular investigations.
Treatment Plan
If ERCC1 was equal to or below the value of 66.0, Cb was used in the treatment doublet; if RRM1 was equal to or below the value of 40.5, G was used (Fig 1), based on published levels in patients with NSCLC.20 The strategy resulted in four protein-expression groups with four doublet regimens in the experimental arm. The low-ERCC1 and low-RRM1 group was treated with G, 1,250 mg/m2 on days 1 and 8, and Cb, area under the concentration time curve (AUC) 5 on day 1, every 21 days (this was the GCb group). The low-RRM1 and high-ERCC1 group was treated with G, 1,250 mg/m2 on days 1 and 8, and docetaxel (D), 40 mg/m2 on days 1 and 8, once every 21 days (GD group). The high-RRM1 and low-ERCC1 group was treated with D, 75 mg/m2 on day 1, and Cb, area under the concentration time curve 6 on day 1, once every 21 days (DCb group). The high-ERCC1 and high-RRM1 group was treated with vinorelbine (V), 35 mg/m2 on days 1 and 15, and D, 50 mg/m2 on days 1 and 15, once every 28 days (DV group). All patients in the control arm were treated with GCb regardless of protein levels. The treatment design resulted in an internal control group; that is, patients in both study arms with low ERCC1 and RRM1 received identical therapies. The trial included provisions for dose reductions or treatment delays. Maintenance therapy was not permitted.
Fig 1.

CONSORT diagram.
Specimen Collection, Processing, and Gene Expression Analysis
The study required collection and shipment of FFPE tumor blocks before therapy. Processing was done in a reference laboratory by one of two investigators. Sections 5-μm thick were placed on frosted glass slides together with reference calibrator specimens for normalization of protein levels, and in situ quantification was done by AQUA (PM-2000, HistoRx, New Haven, CT; version 1.2) as previously described.10,20,21
RNA was extracted from FFPE sections using the High Pure RNA Paraffin Kit from Roche Laboratories (No. 03270289001), and real-time quantitative polymerase chain reaction analysis was performed as previously described.16
Statistical Methods
The primary objective was to achieve a 6-month PFS of 50% (median, 6.0 months) in the experimental arm compared with 38% (median, 4.3 months) in the control arm. Because an interim analysis was planned after 50% of the expected events had occurred with the goal to terminate the study if the experimental arm was better than the control arm with an α level of .005, the final α for the survival comparison was .048.22 The plan was to accrue patients over 3 years with a 1 year follow-up. This resulted in 80% power to reject the null hypothesis of no difference in PFS, with a sample size of 118 per group. Because we deployed a 2:1 randomization, we increased the sample size by 13% to 267 evaluable patients and 254 events. Spearman correlation was used to test the association between log2 transformed protein and mRNA measurements. Kaplan-Meier estimates and log-rank tests were used for survival comparisons among treatment groups. For comparison of categorical variables among treatment groups, Fisher's exact test was used; for comparison of continuous variables, the Wilcoxon rank-sum test was used. All statistical analyses and graphics were performed using R software (R Project for Statistical Computing, Wien, Austria).
RESULTS
Patient and Trial Characteristics
Between May 8, 2007 and December 23, 2010, 331 patients registered onto the trial and 275 were eligible. Of the 56 ineligible patients, 26 had protein-analysis data. Failed analyses made six patients ineligible, inadequate tissue for analysis and unwillingness to have a second biopsy made four patients ineligible, and desire to start treatment immediately without gene analysis made two patients ineligible. The other 44 patients were ineligible for reasons unrelated to the required molecular studies.
Characteristics of the 275 eligible patients are listed in Table 1, and no significant differences between the treatment arms were found. The distribution of regimen assignment in the experimental arm (GCb, 56, 30.6%; DCb, 26, 14.2%; GD, 37, 20.2%; DV, 64, 35.0%) was not significantly different (χ2 test; P = .2) from the expect rates of 30% to GCb, 20% to DCb, 20% to GD, and 30% to DV.20 In the control arm, all patients received GCb; however, based on protein levels, the distribution would have been similar (GCb, 33 [35.9%]; DCb, 15 [16.3%]; GD, 19 [20.7%]; DV, 25 [27.2%]).
Table 1.
Patient Demographics and Disease Characteristics
| Variable* | All Patients (n = 275) |
Experimental Arm (n = 183) |
Control Arm (n = 92) |
P† | |||
|---|---|---|---|---|---|---|---|
| No. | % | No. | % | No. | % | ||
| Sex‡ | .798 | ||||||
| Female | 142 | 51.6 | 93 | 50.8 | 49 | 53.3 | |
| Male | 133 | 48.4 | 90 | 49.2 | 43 | 46.7 | |
| Ethnicity | .214 | ||||||
| Non-Hispanic | 264 | 96.0 | 178 | 97.3 | 86 | 93.5 | |
| Hispanic | 9 | 3.3 | 4 | 2.2 | 5 | 5.4 | |
| Unknown | 2 | 0.7 | 1 | 0.5 | 1 | 1.1 | |
| Race | .814 | ||||||
| White | 259 | 94.2 | 171 | 93.4 | 88 | 95.7 | |
| American Indian | 1 | 0.4 | 1 | 0.5 | 0 | 0.0 | |
| Asian | 4 | 1.5 | 2 | 1.1 | 2 | 2.2 | |
| African American | 10 | 3.6 | 8 | 4.4 | 2 | 2.2 | |
| Unspecified | 1 | 0.4 | 1 | 0.5 | 0 | 0.0 | |
| Age, years | .204 | ||||||
| Median | 63.6 | 64.2 | 63.2 | ||||
| Mean | 63.5 | 64.1 | 62.3 | ||||
| Minimum-maximum | 39.6-85.0 | 42.1-85.0 | 39.6-82.5 | ||||
| Smoking status | .885 | ||||||
| Never | 27 | 18 | 9 | ||||
| Active | 99 | 63 | 36 | ||||
| Quit (> 1 year ago) | 146 | 100 | 46 | ||||
| Unknown | 3 | 2 | 1 | ||||
| Histology | .946 | ||||||
| Adenocarcinoma | 146 | 99 | 47 | ||||
| Squamous cell | 49 | 31 | 18 | ||||
| Large cell | 12 | 8 | 4 | ||||
| Other | 68 | 45 | 23 | ||||
| Stage | .312 | ||||||
| IV | 257 | 173 | 84 | ||||
| IIIB | 18 | 10 | 8 | ||||
| Performance status‡ | 1.000 | ||||||
| 0 | 84 | 56 | 28 | ||||
| 1 | 191 | 127 | 64 | ||||
| Weight loss | .947 | ||||||
| Absent | 208 | 138 | 70 | ||||
| Present | 65 | 44 | 21 | ||||
| Unknown | 2 | 1 | 1 | ||||
| Metastatic sites | |||||||
| Brain | 37 | 22 | 15 | .352 | |||
| Liver | 49 | 33 | 16 | 1.000 | |||
| Bone | 105 | 76 | 29 | .116 | |||
All variables were equally distributed between both treatment arms.
P value for age was from the Wilcoxon rank sum test; all others were from Fisher's exact test.
Denotes stratification parameters. None of the patients had received prior adjuvant or neoadjuvant therapy.
Six patients never started therapy; five in the experimental arm and one in the control arm (not significantly different). The median number and range of treatment cycles given to patients in both arms and by treatment assignment in the experimental arm was not significantly different (Kruskal-Wallis test, P = .25 and P = .27, respectively; Table 2). All planned six cycles were completed by 108 patients (42.2%); 66 patients (36.1%) in the experimental arm and 42 patients (45.7%) in the control arm (not significantly different). The completion rates in the experimental arm by assigned treatment were 42.9% (24 of 56 patients) for GCb, 38.5% (10 of 26 patients) for DCb, 43.2% (16 of 37 patients) for GD, and 35.9% (23 of 64 patients) for DV (not significantly different). The reasons for treatment termination in the remaining 161 patients included disease progression or death in 78 patients (21 in the control arm), treatment-related complications in 46 patients (14 in the control arm), patients' choice in 15 patients (six in the control arm), and other reasons in 22 patients (zero in the control arm).
Table 2.
Cycles of Treatment by Arm and Assignment
| Arm | No. of Patients | Mean | SD | Minimum | Median | Maximum |
|---|---|---|---|---|---|---|
| Experimental arm | ||||||
| GCb | 56 | 4.4 | 1.7 | 1.0 | 4.5 | 6.0 |
| DCb | 26 | 4.3 | 1.8 | 1.0 | 5.0 | 6.0 |
| GD | 37 | 3.9 | 2.1 | 0.0 | 4.0 | 6.0 |
| DV | 64 | 3.6 | 2.1 | 0.0 | 3.0 | 6.0 |
| Control arm, GCb | 92 | 4.3 | 1.9 | 0.0 | 5.0 | 6.0 |
Abbreviations: DCb, docetaxel/carboplatin; DV, docetaxel/vinorelbine; GCb, gemcitabine/carboplatin; GD, gemcitabine/docetaxel; SD, standard deviation.
Survival
The final date of follow-up was January 6, 2012, at which time 172 patients had progressed and 221 were deceased. Seventy-six patients had died without documented disease progression, and 27 patients with disease progression were alive. The median follow-up time was 31.7 months; 32.9 months in the experimental arm, and 26.3 months in the control arm.
The 6-month PFS rate and median PFS were 52.0% and 6.1 month in the experimental arm, respectively, and 56.5% and 6.9 months in the control arm, respectively. This difference was not significant (log-rank P = .181; Fig 2A). PFS in the experimental arm was not significantly different among the treatment groups (log-rank P = .0995; Table 3). In a comparison of the four protein-expression groups between the experimental and control arms, a significant survival advantage was found for patients with low ERCC1 and low RRM1 in the control arm compared with the same group in the experimental arm (log-rank P = .02), although both received GCb therapy (Fig 2B, Table 3). PFS for the other three protein-expression groups did not differ significantly between arms (Fig 2C, Table 3).
Fig 2.
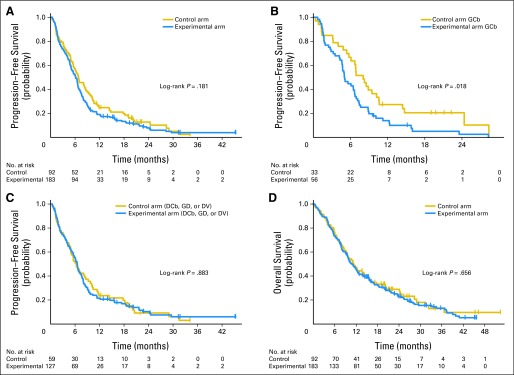
Patient survival. (A) Progression-free survival. (B) Progression-free survival between the experimental and control arms for patients with low ERCC1 and low RRM1 levels who received identical therapy (gemcitabine/carboplatin [GCb]). (C) Progression-free survival between the experimental and control arms for patients with high RRM1 and low ERCC1, low RRM1 and high ERCC1, and high RRM1 and high ERCC1 levels who received docetaxel/carboplatin (DCb), gemcitabine/docetaxel (GD), and docetaxel/vinorelbine (DV) therapy in the experimental arm and GCb in the control arm. (D) Overall survival.
Table 3.
Survival and Disease Response
| Outcome and Variable | Experimental Arm |
Control Arm |
||||||||||||||||||
|---|---|---|---|---|---|---|---|---|---|---|---|---|---|---|---|---|---|---|---|---|
| All (n = 183) |
Low RRM1 and Low ERCC1 (GCb; n = 56)* |
High RRM1 and Low ERCC1 (DCb; n = 26) |
Low RRM1 and High ERCC1 (GD; n = 37) |
High RRM1 and High ERCC1 (DV; n = 64) |
All (n = 92) |
Low RRM1 and Low ERCC1 (GCb; n = 33)* |
High RRM1 and Low ERCC1 (GCb; n = 15) |
Low RRM1 and High ERCC1 (GCb; n = 19) |
High RRM1 and High ERCC1 (GCb; n = 25) |
|||||||||||
| No. | % | No. | % | No. | % | No. | % | No. | % | No. | % | No. | % | No. | % | No. | % | No. | % | |
| PFS | ||||||||||||||||||||
| Median | 6.1 | 5.0 | 6.5 | 6.1 | 6.7 | 6.9 | 8.1 | 8.1 | 6.0 | 6.3 | ||||||||||
| 95% CI | 5.0 to 6.7 | 4.6 to 6.6 | 2.7 to 8.3 | 4.2 to 8.1 | 5.5 to 7.8 | 5.6 to 8.6 | 5.8 to 10.2 | 3.7 to 11.6 | 2.1 to 20.2 | 4.4 to 9.7 | ||||||||||
| 6-month rate, % | 52.0 | 44.6 | 56.1 | 51.4 | 57.2 | 56.5 | 66.7 | 53.3 | 47.4 | 52.0 | ||||||||||
| 95% CI | 45.2 to 59.8 | 33.3 to 59.8 | 39.7 to 79.3 | 37.5 to 70.3 | 46.2 to 70.8 | 47.2 to 67.6 | 52.4 to 84.9 | 33.2 to 85.6 | 29.5 to 76.1 | 35.7 to 75.8 | ||||||||||
| 12-month rate, % | 19.2 | 13.9 | 24.0 | 10.8 | 26.7 | 24.9 | 27.3 | 26.7 | 36.8 | 12.0 | ||||||||||
| 95% CI | 14.2 to 25.9 | 7.2 to 26.9 | 12.0 to 48.3 | 4.3 to 27.3 | 17.7 to 40.3 | 17.4 to 35.5 | 15.6 to 47.6 | 11.5 to 61.7 | 20.4 to 66.4 | 4.2 to 34.7 | ||||||||||
| OS | ||||||||||||||||||||
| Median, months | 11.0 | 10.1 | 10.0 | 9.0 | 12.5 | 11.3 | 15.1 | 11.6 | 15.8 | 9.7 | ||||||||||
| 95% CI | 9.4 to 12.5 | 8.1 to 15.6 | 8.0 to 21.7 | 6.6 to 13.6 | 9.8 to 19.9 | 9.3 to 15.1 | 8.5 to 28.4 | 5.8 to 14.3 | 3.9 to 29.0 | 6.7 to 13.7 | ||||||||||
| 6-month rate, % | 73.5 | 71.4 | 84.1 | 67.6 | 74.6 | 76.1 | 78.8 | 80.0 | 63.2 | 80.0 | ||||||||||
| 95% CI | 67.3 to 80.2 | 60.5 to 84.3 | 71.0 to 99.7 | 54.0 to 84.5 | 64.6 to 86.2 | 67.9 to 85.3 | 66.0 to 94.0 | 62.1 to 100.0 | 44.8 to 89.0 | 65.8 to 97.3 | ||||||||||
| 12-month rate, % | 46.1 | 44.3 | 40.1 | 43.2 | 51.7 | 46.6 | 54.5 | 46.7 | 52.6 | 32.0 | ||||||||||
| 95% CI | 39.3 to 54.0 | 33.0 to 59.5 | 24.8 to 64.7 | 29.9 to 62.6 | 40.6 to 65.8 | 37.5 to 58.1 | 39.9 to 74.5 | 27.2 to 80.2 | 34.4 to 80.6 | 18.1 to 56.7 | ||||||||||
| 24-month rate, % | 22.9 | 16.3 | 28.0 | 14.2 | 31.4 | 28.9 | 41.1 | 24.0 | 30.7 | 16.0 | ||||||||||
| 95% CI | 17.3 to 30.5 | 8.5 to 31.2 | 15.0 to 52.6 | 5.7 to 35.4 | 21.4 to 46.2 | 20.7 to 40.5 | 27.0 to 62.4 | 9.3 to 61.9 | 14.4 to 65.3 | 6.5 to 39.3 | ||||||||||
| RR | ||||||||||||||||||||
| CR | 0 | 0.0 | 0 | 0.0 | 0 | 0.0 | 0 | 0.0 | 0 | 0.0 | 0 | 0.0 | 0 | 0.0 | 0 | 0.0 | 0 | 0.0 | 0 | 0.0 |
| PR | 64 | 38.8 | 18 | 33.3 | 10 | 43.5 | 14 | 41.2 | 22 | 40.7 | 31 | 36.5 | 10 | 32.3 | 6 | 42.9 | 7 | 38.9 | 8 | 36.4 |
| SD | 72 | 43.6 | 26 | 48.1 | 8 | 34.8 | 14 | 41.2 | 24 | 44.4 | 42 | 49.4 | 18 | 58.1 | 6 | 42.9 | 7 | 38.9 | 11 | 50.0 |
| PD | 29 | 17.6 | 10 | 18.5 | 5 | 21.7 | 6 | 17.6 | 8 | 14.8 | 12 | 14.1 | 3 | 9.7 | 2 | 14.3 | 4 | 22.2 | 3 | 13.6 |
| Not evaluable/missing | 18 | NA | 2 | NA | 3 | NA | 3 | NA | 10 | NA | 7 | NA | 2 | NA | 1 | NA | 1 | NA | 3 | NA |
| Other variables | ||||||||||||||||||||
| Sex, female/male† | 93 and 90 | 27 and 29 | 16 and 10 | 19 and 18 | 31 and 33 | 49 and 43 | 19 and 14 | 9 and 6 | 8 and 11 | 13 and 12 | ||||||||||
| Performance status, 0/1† | 56 and 127 | 18 and 38 | 8 and 18 | 9 and 28 | 21 and 43 | 28 and 64 | 8 and 25 | 3 and 12 | 10 and 9 | 7 and 18 | ||||||||||
| Histology, adeno/nonadeno | 99 and 84 | 27 and 29 | 16 and 10 | 20 and 17 | 36 and 28 | 47 and 45 | 20 and 13 | 7 and 8 | 7 and 12 | 13 and 12 | ||||||||||
| Stage, IIIb/IV | 10 and 173 | 3 and 53 | 1 and 25 | 1 and 36 | 5 and 59 | 8 and 84 | 4 and 29 | 0 and 15 | 2 and 17 | 2 and 23 | ||||||||||
| Weight loss, Y/N | 44 and 138 | 12 and 44 | 9 and 17 | 14 and 22 | 9 and 55 | 21 and 70 | 8 and 24 | 3 and 12 | 4 and 15 | 6 and 19 | ||||||||||
| Smoking status, active/nonactive | 63 and 118 | 21 and 35 | 4 and 22 | 16 and 21 | 22 and 40 | 36 and 55 | 14 and 19 | 3 and 12 | 10 and 8 | 9 and 16 | ||||||||||
| Metastatic sites | ||||||||||||||||||||
| Brain | 22 | 4 | 2 | 5 | 11 | 15 | 4 | 2 | 3 | 6 | ||||||||||
| Liver | 33 | 8 | 4 | 6 | 15 | 16 | 4 | 2 | 2 | 8 | ||||||||||
| Bone | 76 | 24 | 16 | 14 | 22 | 29 | 9 | 5 | 3 | 12 | ||||||||||
Abbreviations: adeno, adenocarcinoma; CR, complete response; DCb, docetaxel/carboplatin; DV, docetaxel/vinorelbine; GCb, gemcitabine/carboplatin; GD, gemcitabine/docetaxel; NA, not applicable; OS, overall survival; PD, progressive disease; PFS, progression-free survival; PR, partial response; RR, response rates; SD, stable disease; Y/N, yes/no.
PFS was significantly better (P = .02) in the control arm compared with the experimental arm for patients with low ERCC1 and low RRM1 expression, although both groups received identical treatment (GCb).
Denotes stratification parameters. None of the patients had received prior adjuvant or neoadjuvant therapy.
The overall survival was not significantly different (log-rank P = .66; Fig 2D; Table 3) between treatment arms or among the different treatment groups in the experimental arm (log-rank P = .226; Table 3). There was also no significant difference between both arms for the individual protein-expression groups (Table 3).
Disease Response
Best disease response was determined by appropriate imaging studies with tumor diameter measurements on up to 10 lesions after at least every second cycle of therapy. The sum of these diameters was compared with the pretreatment values and expressed as a percentage of change. Measurable response values were obtained for 157 patients in the experimental arm (86% shrinkage to 236% growth) and 82 patients in the control arm (91% shrinkage to 19% growth). Categorical disease response17 data were available for 250 patients, and there was no significant difference between both arms (38.8% partial response in the experimental arm and 36.5% partial response in the control arm; χ2-test P = .79; Table 3).
In situ ERCC1 protein levels ranged from 9.4 to 255 (median, 75.2; mean, 89.6), RRM1 levels ranged from 2.9 to 255 (median, 84.7; mean, 94.4), and they were significantly correlated (r = 0.394, P < .001). ERCC1 levels were significantly lower (Wilcoxon rank sum test P = .04) in the control arm (median, 68.4; mean, 78.4; range, 9.4 to 255) compared with the experimental arm (median, 79.7; mean, 95.2; range, 13.2 to 255). RRM1 levels did not differ significantly (P = .32) between both arms (control arm: median, 93.0; mean, 97.8; range, 4.3 to 248.8; experimental arm: median, 78.7; mean, 92.7; range, 2.9 to 255). We found no significant correlation between best response and in situ protein levels of ERCC1 (r = −0.06; P = .49) or RRM1 (r = 0.03; P = .74) in the 135 patients treated with GCb in both arms.
Feasibility and Toxicity
If more than two thirds of registered patients had a successful protein analysis, the trial would meet its feasibility end point. We successfully determined protein levels in 301 (91%) of 331 patients. The median time from informed consent to completed gene analysis was 11 days (mean, 12 days); it ranged from 1 to 47 days. A tumor rebiopsy for the specific purpose of gene expression analysis was required in 17% of patients (53 of 307, which includes six patients who did not agree to a second biopsy and 26 ineligible patients with a successful protein analysis), and in the 47 patients who agreed to it there were no complications. Of the 307 specimens used for protein analysis, 202 were histologic, 103 cytologic, and two unspecified specimens. There were no significant differences among the diagnostic procedures that resulted in successful versus unsuccessful initial protein analyses (Fisher's exact test P = .211). We did not observe a statistically significant difference in adverse or serious adverse events between the study arms or among treatment groups (Table 4).
Table 4.
Adverse Events in Treated Patients
| Treatment | Patients | Adverse Events |
Serious Adverse Events |
Treatment Discontinuation for Toxicity | ||
|---|---|---|---|---|---|---|
| All | Probably/Possibly Related | All | Probably/Possibly Related | |||
| All | 269 | 156 | 149 | 56 | 29 | 46 |
| Experimental Arm | 178 | 102 | 97 | 37 | 19 | 32 |
| GCb | 56 | 34 | 34 | 10 | 4 | 7 |
| DCb | 26 | 15 | 15 | 7 | 6 | 4 |
| GD | 36 | 21 | 21 | 9 | 3 | 9 |
| DV | 60 | 32 | 27 | 11 | 6 | 12 |
| Control arm, GCb | 91 | 54 | 52 | 19 | 10 | 14 |
| P* | .94 | .47 | .83 | .27 | .75 | |
Abbreviations: DCb, docetaxel/carboplatin; DV, docetaxel/vinorelbine; GCb, gemcitabine/carboplatin; GD, gemcitabine/docetaxel.
Toxicity rates were not significantly different between the treatmeant arms or among the treatment groups in the experimental arm
Protein and mRNA Expression
After completion of the primary protein analysis by AQUA, residual FFPE specimens were available from 162 patients for molecular studies. RNA of sufficient quality was obtained from 103 patients, and mRNA expression levels for ERCC1 and RRM1 were obtained from 72 patients. The levels of ERCC1 mRNA expression ranged from 1.7 to 100.7 (median, 14.2; mean, 21.0), those for RRM1 ranged from 1.4 to 91.0 (median, 13.0; mean 19.6), and they were significantly correlated (r = 0.77; P < .001) as previously reported.10,20 We did not find a significant correlation between ERCC1 in situ protein and mRNA levels (r = 0.15; P = .20). There was also no correlation between both levels for RRM1 (r = −0.06; P = .61; Fig 3). In the 28 patients treated with GCb with available mRNA levels and response data, no significant correlation between best response and ERCC1 (r = −0.18; P = .35) or RRM1 (r = 0.02; P = .91) was found.
Fig 3.

(A and B) ERCC1 and (C and D) RRM1 protein and mRNA expression.
DISCUSSION
We conducted a randomized, international, phase III trial in patients with advanced NSCLC with the intent to validate previous data that indicated ERCC1 and RRM1 as predictive markers of therapeutic benefit from carboplatin and gemcitabine, respectively.10,12–14 The expectation was to achieve a 32% improvement in the 6-month PFS rate in the experimental arm, with treatment based on protein levels, compared with the control arm, in which GCb was administered to all patients. This design was chosen to validate the previously reported10 association between in situ protein levels for both genes and disease response. A result of the design was that patients with low levels of both proteins received identical GCb therapy. Although this reduced the anticipated benefit from individualized therapy, it resulted in an internal control. We did not observe a survival or RR benefit from individualized therapy; however, we did observe a statistically significant survival benefit for patients with low levels of both proteins in the control arm compared with the same group of patients in the experimental arm. Because we did not find a significant bias for parameters known to affect survival between both arms, we conclude that our trial result is false negative. In phase III trials, investigators generally don't know if an acceptance of the null hypothesis—when there is no difference in treatment arms—is wrong (type 2 error) because internal controls are not part of trial designs as they reduce the expected effect size. However, given that most phase III trials have 80% power, the false negative rate is 20%.
We did not observe a significant correlation between best disease response and protein or mRNA ERCC1 or RRM1 levels in patients treated with GCb as had been previously reported.10,13 This observation may be a result of interinstitutional variations in specimen collection and processing. Although we did not observe a statistically significant difference in both protein levels among the nine contributing sites (ERCC1, Kruskal-Wallis P = .54; RRM1, P = .06), interinstitutional differences in protein levels for RRM1 were observed. This is consistent with reported protein levels in the International Adjuvant Lung Trial, which had demonstrated that levels of RRM1, and to a lesser degree ERCC1, were significantly affected by contributing institutions.23 In addition, the previously reported correlations10,13 between ERCC1 levels and disease response (protein, r = 0.39; mRNA, r = 0.28) and RRM1 levels and disease response (protein, r = 0.41; mRNA, r = 0.47) are modest, suggesting that other parameters affect these biomarker-drug efficacy interactions. In fact, we have identified and reported at least three parameters that affect these interactions.24,25 Finally, studies have suggested that the chosen reagent for in situ quantification of ERCC1 (monoclonal antibody 8F1) may detect other molecules of similar immunoreactivity and cellular localization than ERCC1, which may explain the observed lack of correlation in the current study.26
We have previously reported a modest correlation (r = 0.42) between RRM1 mRNA levels determined in fresh-frozen tumor specimens and in situ protein levels as determined by AQUA from specimens collected at a single institution.20 Data obtained from FFPE specimens analyzed for mRNA and protein levels in the current trial showed no correlation (r = −0.06). This may be explained by the different fixation and processing techniques used in these investigations. An alternate explanation is the known and previously mentioned dependence of RRM1 protein levels on contributing institutions.23 We also observed no correlation between ERCC1 mRNA and protein levels (r = 0.15), which we had also not observed in a prior study (r = 0.14).20 It may be explained by the previously mentioned immunoreactivity with an alternate target by the ERCC1 reagent 8F1, namely choline-phosphate cytidylyltransferase A (PCYT1A).27
Finally, it is important to note, that our study required real-time processing of tumor specimens for ERCC1 and RRM1 in situ protein levels. All prior investigations of these molecules utilized batch processing of tumor samples. Thus, day-to-day variations in the assay reliability may have not affected prior investigations, whereas our investigation suffered from this. During the entire trial, all specimens were processed by one of two investigators using a standardized operating procedure, device, and image analysis application. Reagents were from similar sources and prepared identically; however, different lots of reagents were used during the 3.5-year patient accrual period. In an analysis of ERCC1 and RRM1 values over time, we noticed nonrandom trends in marker levels, suggesting that reagent and processing procedures may have influenced the biomarker levels.
In summary, we believe that the survival results and possibly the disease response results are false negative. However, the trial clearly demonstrates feasibility of treatment assignment for patients with advanced NSCLC across countries and academic, nonacademic, and private practice settings. We conclude that further assay development with special attention to reagent specificity, day-to-day assay conditions, and site-specific specimen processing is desirable before another trial is launched.
Supplementary Material
Acknowledgment
Dr Mark Carlson from the Southeast Nebraska Cancer Center, Lincoln, NE, Dr Pablo Reyes from the Leesburg Regional Medical Center, Leesburg, FL, and Dr Hector Velez from the Ponce School of Medicine, Ponce, Puerto Rico, contributed patients.
Footnotes
Supported by Grant No. CA129343 from the National Cancer Institute and by sanofi-aventis.
Authors' disclosures of potential conflicts of interest and author contributions are found at the end of this article.
Clinical trial information: NCT00499109.
AUTHORS' DISCLOSURES OF POTENTIAL CONFLICTS OF INTEREST
Although all authors completed the disclosure declaration, the following author(s) indicated a financial or other interest that is relevant to the subject matter under consideration in this article. Certain relationships marked with a “U” are those for which no compensation was received; those relationships marked with a “C” were compensated. For a detailed description of the disclosure categories, or for more information about ASCO's conflict of interest policy, please refer to the Author Disclosure Declaration and the Disclosures of Potential Conflicts of Interest section in Information for Contributors.
Employment or Leadership Position: None Consultant or Advisory Role: Julie Brahmer, Bristol-Myers Squibb (U), Eli Lilly (C) Stock Ownership: None Honoraria: Mary Pinder-Schenck, Eli Lilly Research Funding: Gerold Bepler, sanofi-aventis; Juergen R. Fischer, sanofi-aventis Expert Testimony: None Other Remuneration: Gerold Bepler, Genzyme
AUTHOR CONTRIBUTIONS
Conception and design: Gerold Bepler, Charles Williams, Michael J. Schell, George Simon
Provision of study materials or patients: Charles Williams, George Simon, Shirish Gadgeel, Fred Schreiber, Julie Brahmer, Alberto Chiappori, Tawee Tanvetyanon, Mary Pinder-Schenck, Jhanelle Gray, Eric Haura, Scott Antonia, Juergen R. Fischer
Collection and assembly of data: Gerold Bepler, Michael J. Schell, Wei Chen, Zhong Zheng, Shirish Gadgeel, Fred Schreiber, Julie Brahmer, Alberto Chiappori, Tawee Tanvetyanon, Mary Pinder-Schenck, Jhanelle Gray, Eric Haura, Scott Antonia, Juergen R. Fischer
Data analysis and interpretation: Gerold Bepler, Michael J. Schell, Wei Chen, Xiuhua Zhao, Eric Haura
Manuscript writing: All authors
Final approval of manuscript: All authors
REFERENCES
- 1.Druker BJ, Guilhot F, O'Brien SG, et al. Five-year follow-up of patients receiving imatinib for chronic myeloid leukemia. N Engl J Med. 2006;355:2408–2417. doi: 10.1056/NEJMoa062867. [DOI] [PubMed] [Google Scholar]
- 2.Lynch TJ, Bell DW, Sordella R, et al. Activating mutations in the epidermal growth factor receptor underlying responsiveness of non-small-cell lung cancer to gefitinib. N Engl J Med. 2004;350:2129–2139. doi: 10.1056/NEJMoa040938. [DOI] [PubMed] [Google Scholar]
- 3.Paez JG, Janne PA, Lee JC, et al. EGFR mutations in lung cancer: Correlation with clinical response to gefitinib therapy. Science. 2004;304:1497–1500. doi: 10.1126/science.1099314. [DOI] [PubMed] [Google Scholar]
- 4.Kwak EL, Bang Y-J, Camidge R, et al. Anaplastic lymphoma kinase inhibition in non-small-cell lung cancer. N Engl J Med. 2010;363:1693–1703. doi: 10.1056/NEJMoa1006448. [DOI] [PMC free article] [PubMed] [Google Scholar]
- 5.Chapman PB, Hauschild A, Robert C, et al. Improved survival with vemurafenib in melanoma with Braf V600E mutation. N Engl J Med. 2011;364:2507–2516. doi: 10.1056/NEJMoa1103782. [DOI] [PMC free article] [PubMed] [Google Scholar]
- 6.Weiss J, Sos ML, Seidel D, et al. Frequent and focal FGFR1 amplification associates with therapeutically tractable FGFR1 dependency in squamous cell lung cancer. Science Translational Medicine. 2010;2:1–7. doi: 10.1126/scitranslmed.3001451. [DOI] [PMC free article] [PubMed] [Google Scholar]
- 7.Hammerman PS, Sos ML, Ramos AH, et al. Mutations in the DDR2 kinase gene identify a novel therapeutic target in squamous cell lung cancer. Cancer Discovery. 2011;1:78–89. doi: 10.1158/2159-8274.CD-11-0005. [DOI] [PMC free article] [PubMed] [Google Scholar]
- 8.Sosman JA, Kim KB, Schuchter L, et al. Survival in Braf V600-mutant advanced melanoma treated with vemurafenib. N Engl J Med. 2012;366:707–714. doi: 10.1056/NEJMoa1112302. [DOI] [PMC free article] [PubMed] [Google Scholar]
- 9.Olaussen KA, Dunant A, Fouret P, et al. DNA repair by ERCC1 in non-small-cell lung cancer and cisplatin-based adjuvant chemotherapy. N Engl J Med. 2006;355:983–991. doi: 10.1056/NEJMoa060570. [DOI] [PubMed] [Google Scholar]
- 10.Reynolds C, Obasaju C, Schell MJ, et al. Randomized phase III trial of gemcitabine-based chemotherapy with in situ RRM1 and ERCC1 protein levels for response prediction in non-small-cell lung cancer. J Clin Oncol. 2009;27:5808–5815. doi: 10.1200/JCO.2009.21.9766. [DOI] [PMC free article] [PubMed] [Google Scholar]
- 11.Lord RVN, Brabender J, Gandara D, et al. Low ERCC1 expression correlates with prolonged survival after cisplatin plus gemcitabine chemotherapy in non-small cell lung cancer. Clin Cancer Res. 2002;8:2286–2291. [PubMed] [Google Scholar]
- 12.Rosell R, Scagliotti G, Danenberg KD, et al. Transcripts in pretreatment biopsies from a three-arm randomized trial in metastatic non-small-cell lung cancer. Oncogene. 2003;22:3548–3553. doi: 10.1038/sj.onc.1206419. [DOI] [PubMed] [Google Scholar]
- 13.Bepler G, Kusmartseva I, Sharma S, et al. RRM1 modulated in vitro and in vivo efficacy of gemcitabine and platinum in non-small-cell lung cancer. J Clin Oncol. 2006;24:4731–4737. doi: 10.1200/JCO.2006.06.1101. [DOI] [PubMed] [Google Scholar]
- 14.Ceppi P, Volante M, Novello S, et al. ERCC1 and RRM1 gene expressions but not EGFR are predictive of shorter survival in advanced non-small-cell lung cancer treated with cisplatin and gemcitabine. Ann Oncol. 2006;17:1818–1825. doi: 10.1093/annonc/mdl300. [DOI] [PubMed] [Google Scholar]
- 15.Cobo M, Isla D, Massuti B, et al. Customizing cisplatin based on quantitative excision repair cross-complementing 1 mRNA expression: A phase III trial in non-small-cell lung cancer. J Clin Oncol. 2007;25:2747–2754. doi: 10.1200/JCO.2006.09.7915. [DOI] [PubMed] [Google Scholar]
- 16.Simon G, Sharma A, Li X, et al. Feasibility and efficacy of molecular analysis-directed individualized therapy in advanced non-small-cell lung cancer. J Clin Oncol. 2007;25:2741–2746. doi: 10.1200/JCO.2006.08.2099. [DOI] [PubMed] [Google Scholar]
- 17.Therasse P, Arbuck SG, Eisenhauer EA, et al. New guidelines to evaluate the response to treatment in solid tumors: European Organization for Research and Treatment of Cancer, National Cancer Institute of the United States, National Cancer Institute of Canada. J Natl Cancer Inst. 2000;92:205–216. doi: 10.1093/jnci/92.3.205. [DOI] [PubMed] [Google Scholar]
- 18.Chiappori A, Simon G, Williams C, et al. Phase II study of first line sequential chemotherapy with gemcitabine-carboplatin followed by docetaxel in patients with advanced non-small cell lung cancer. Oncology. 2005;68:382–390. doi: 10.1159/000086979. [DOI] [PubMed] [Google Scholar]
- 19.Chiappori AA, Haura E, Rodriguez FA, et al. Phase I/II study of atrasentan, an endothelin A receptor antagonist, in combination with paclitaxel and carboplatin as first-line therapy in advanced non-small cell lung cancer. Clin Cancer Res. 2008;14:1464–1469. doi: 10.1158/1078-0432.CCR-07-1508. [DOI] [PubMed] [Google Scholar]
- 20.Zheng Z, Chen T, Li X, et al. The DNA synthesis and repair genes RRM1 and ERCC1 in lung cancer. N Engl J Med. 2007;356:800–808. doi: 10.1056/NEJMoa065411. [DOI] [PubMed] [Google Scholar]
- 21.Camp RL, Chung GG, Rimm DL. Automated subcellular localization and quantification of protein expression in tissue microarrays. Nat Med. 2002;8:1323–1327. doi: 10.1038/nm791. [DOI] [PubMed] [Google Scholar]
- 22.O'Brien PC, Fleming TR. A multiple testing procedure for clinical trials. Biometrics. 1979;35:549–556. [PubMed] [Google Scholar]
- 23.Bepler G, Olaussen KA, Vataire AL, et al. ERCC1 and RRM1 in the International Adjuvant Lung Trial by automated quantitative in situ analysis. Am J Pathol. 2011;179:69–78. doi: 10.1016/j.ajpath.2010.11.029. [DOI] [PMC free article] [PubMed] [Google Scholar]
- 24.Zhou J, Oliveira P, Li X, et al. Modulation of the ribonucleotide reductase-antimetabolite drug interaction in cancer cell lines. J Nucleic Acid. 2010;2010:1–10. doi: 10.4061/2010/597098. [DOI] [PMC free article] [PubMed] [Google Scholar]
- 25.Zhang Y, Li X, Chen Z, et al. Ubiquitination of RRM1 by Ring1B (RNF2) promotes its degradation and nuclear export. Proc Am Assoc Cancer Res. 2011;102:3842. [Google Scholar]
- 26.Bhagwat NR, Roginskaya VY, Acquafondata MB, et al. Immunodetection of DNA repair endonuclease ERCC1-XPF in human tissue. Cancer Res. 2009;69:6831–6838. doi: 10.1158/0008-5472.CAN-09-1237. [DOI] [PMC free article] [PubMed] [Google Scholar]
- 27.Ma D, Baruch D, Shu Y, et al. Using protein microarray technology to screen anti-ERCC1 monoclonal antibodies for specificity and applications in pathology. BMC Biotechnology. 2012;12:88. doi: 10.1186/1472-6750-12-88. [DOI] [PMC free article] [PubMed] [Google Scholar]
Associated Data
This section collects any data citations, data availability statements, or supplementary materials included in this article.