

Abstract
Pediatric drug development is hampered by biological, clinical, and formulation challenges associated with age-based populations. A primary cause for this lack of development is the inability to accurately predict ontogenic changes that affect pharmacokinetics (PK) in children using traditional preclinical animal models. In response to this issue, our laboratory has conducted a proof-of-concept study to investigate the potential utility of juvenile pigs to serve as surrogates for children during preclinical PK testing of selected rifampin dosage forms. Pigs were surgically modified with jugular vein catheters that were externalized in the dorsal scapular region and connected to an automated blood sampling system (PigTurn-Culex-L). Commercially available rifampin capsules were administered to both 20 and 40 kg pigs to determine relevant PK parameters. Orally disintegrating tablet formulations of rifampin were also developed and administered to 20 kg pigs. Plasma samples were prepared from whole blood by centrifugation and analyzed for rifampin content by liquid chromatography–tandem mass spectrometry. Porcine PK parameters were determined from the resultant plasma–concentration time profiles and contrasted with published rifampin PK data in human adults and children. Results indicated significant similarities in dose-normalized absorption and elimination parameters between pigs and humans. Moreover, ontogenic changes observed in porcine PK parameters were consistent with ontogenic changes reported for human PK. These results demonstrate the potential utility of the juvenile porcine model for predicting human pediatric PK for rifampin. Furthermore, utilization of juvenile pigs during formulation testing may provide an alternative approach to expedite reformulation efforts during pediatric drug development.
KEY WORDS: ADME, pediatric, pharmacokinetics, porcine, rifampin
INTRODUCTION
Dr. Harry Shirkey of the Children’s Hospital in Alabama originally described pediatric populations as “therapeutic orphans” in the 1960s because of children’s neglected status during drug development (1). Approximately 50 years later, the aversion to developing new therapeutic agents for children still stands. This aversion is attributable to a variety of factors, including ethical concerns associated with testing drugs in children, biological challenges resultant of physiological maturation/development, formulation challenges to improve patient compliance, and perhaps most significantly the lack of financial return on investment due to smaller patient populations (2). In response to these challenges, regulatory agencies including the Food and Drug Administration (FDA) and the European Medicines Agency (EMA) have issued legislation such as the Best Pharmaceuticals for Children Act and the Pediatric Research Equity Act in the USA and the Paediatric Investigation Plan in the European Union to provide incentives for testing and developing drugs for children. While these incentives have significantly improved pediatric drug labeling and increased the number of clinical trials being performed in children, a large unmet need still exists for the development of child-friendly dosage forms (3).
The lack of age-appropriate formulations is a topic that has recently garnered significant interest throughout industry, regulatory agencies, and clinicians (4–6). Traditional solid oral dosage forms such as tablets or capsules are often unacceptable for children because of swallowing difficulties and choking hazards. Liquid formulations reduce swallowing difficulties but may have a truncated shelf life because drugs in solution are often less stable than drugs in the solid state. In addition, liquid formulations are bulky and expensive to ship, which creates logistical problems for developing areas of the world (7,8). In the absence of clinically tested pediatric formulations, clinicians frequently administer extemporaneous preparations of adult dosage forms (9). For example, a common strategy is to utilize an adult dosage form, ground and mixed into beverages or soft foods to allow for ease of swallowing. However, administration of extemporaneous adult formulations to children may have serious therapeutic consequences (10,11). Adult doses may be considerably higher than the dose required to elicit a therapeutic response in children, leading to plasma levels above the minimum toxic concentration (12). This approach also neglects food effects, which may significantly alter drug absorption and consequently therapeutic efficacy. Furthermore, dosing accuracy may be sacrificed if the adult dosage form has to be compromised or if all of the extemporaneous formulation is not administered.
Another major concern for pediatric drug development is the inability to accurately predict the in vivo pharmacokinetic and pharmacodynamic (PK/PD) behavior of a compound due to physiological changes associated with growth and maturation (13). One of the primary reasons for this difficulty is that we lack representative preclinical methods and animal models that accurately reflect the age-based changes observed in pediatric populations (14). Traditional animal models (e.g., mice, rats, dogs, and primates) have been used to predict PK/PD response for a variety of drugs with marginal success for all patient populations (15). However, confounding variables, including species-dependent differences in physiology and transporter/enzyme function, limit the utility of these animal models for estimating human PK/PD data (15). Therefore, an animal species with a high degree of anatomical and physiological similarity to humans may provide a more accurate and reliable means to predict human PK/PD behavior (16,17). Moreover, if ontogenic changes in an animal species could be correlated with ontogenic changes in humans, then the animal model could potentially be used to predict human pediatric PK/PD behavior (18). In fact, both the FDA and the EMA have issued guidance documents that cite the need for and the utility of juvenile animal studies with respect to pediatric drug development (19,20). Such juvenile animal studies have provided valuable information on pediatric PK/PD response that were not demonstrated in traditional adult animal studies (21). To that aim, our laboratory has begun to investigate the potential utility of the juvenile porcine model to serve as a surrogate for human children during preclinical PK testing, based on numerous reports that the pig may be the best non-primate model for predicting human safety pharmacology (16,22–25).
The porcine model possesses multiple anatomical and physiological characteristics that more closely resemble humans than other non-primate species (16,18,22,26,27). For example, the gastrointestinal transit time, surface area, and pH gradients in pigs are the most similar to humans when compared to other preclinical animal species (17,26). These similarities make pigs particularly attractive for studying oral drug absorption. Furthermore, similarities in porcine drug metabolizing enzymes (DMEs) suggest that pigs may be the most suitable animal model for drug metabolism and toxicology studies (28–32). Pigs and humans also have a high degree of similarity in both mRNA and protein identity for a number of pharmaceutically relevant transporters, including P-glycoprotein, members of the multidrug resistance-associated protein family, and members of the organic anion transporter family (33). While many of the references cited in this section focus primarily on minipigs, it should be noted that the principal differences between domestic pigs and minipigs are related to growth rates and size at maturation rather than anatomical, physiological, or functional differences (16,23).
The use of the porcine model also allows for administration of intact, prototype formulations to assess the impact of dosage form variation on PK response. This is a primary advantage over smaller animals that are unable to accommodate commercially relevant dosage forms because of anatomical size limitations (22). When used in this capacity, the porcine model may facilitate formulation development by enabling scientists to compare and contrast PK parameters of various dosage forms. Information obtained from such studies could then be utilized for the selection and refinement of the optimal formulation to achieve the desired PK profile. This approach may be particularly useful for complex formulations, such as controlled release products which require careful administration of intact dosage forms.
Based on the advantages of the porcine model discussed above, the aim of this study was two-fold: (1) to determine ontogenic changes in rifampin porcine PK and compare with ontogenic changes in rifampin human PK and (2) to develop novel age appropriate pediatric dosage forms of rifampin and determine their relevant PK parameters in juvenile pigs. Rifampin was selected as the model compound for these studies because of its efficacy as a first-line therapeutic in treating tuberculosis (TB), its well-tolerated safety profile, its global demand due to increasing incidence rates of TB, and its inclusion on the WHO’s list of Essential Medicines for Children (34).
MATERIALS AND METHODS
Materials
Rifampin capsules, USP 300 mg (Sandoz, Princeton, NJ, USA) were obtained from the Purdue University Pharmacy. Rifampin API was purchased from Waterstone Technology (Carmel, IN, USA). 25-Desacetyl rifampin reference standard was purchased from SynFine Research (ON, Canada). Rifabutin served as an internal standard and was purchased from Sigma Aldrich (St. Louis, MO, USA). Solid-phase extraction (SPE) columns (320-0005-A) were purchased from Biotage (Charlotte, NC, USA). F-Melt® was kindly donated by Fuji Chemical Industry Co., Ltd (Kamiichi, Japan). Croscarmellose sodium (Ac-Di-Sol®) and microcrystalline cellulose (Avicel® PH 102) were donated by FMC BioPolymer (Philadelphia, PA, USA). Magnesium stearate was obtained from Avantor (Center Valley, PA, USA). Cherry flavoring was donated by Cargill Flavor Systems (Cincinnati, OH, USA). Catheters, tubing, and other supplies for the PigTurn-Culex-L® were purchased from Bioanalytical Systems, Inc. (West Lafayette, IN, USA). HPLC solvents and all other chemicals and reagents were obtained from VWR (Radnor, PA, USA) unless stated otherwise.
Placebo Tablet Manufacturing
Placebo tablets were used to socialize the pigs and train them to accept and swallow solid oral dosage forms. Placebo tablets were manufactured by blending 2.5 kg of microcrystalline cellulose (Avicel® PH 102) with 2.5 kg of sucrose for 10 min in a Tote® Tumble Bin Blender. Following blending, magnesium stearate (1.0%) was added and blended for an additional 5 min. Tablets were compressed to a target hardness of 8 kp using a 16-station Stokes B2 tablet press with 11 mm round standard concave tooling.
Rifampin Orally Disintegrating Tablet Manufacturing and Assay
Rifampin orally disintegrating tablets (ODTs) were manufactured by blending F-Melt® (37.1%), Avicel® PH 102 (37.1%), rifampin (14.3%), Ac-Di-Sol® (10.0%), and cherry flavor (1.0%) for 15 min at 25 RPM. Following blending, magnesium stearate (0.5%) was added and blended for an additional 5 min. Tablets were compressed to a target weight of 350 mg at 4.4 kN using a single station Carver Press with 11 mm round standard concave tooling. ODTs were assayed for rifampin content using a modified version of the USP monograph for rifampin capsules (35). Individual ODTs were ground using a mortar and pestle and dissolved in 25 mL of acetonitrile. The solution was then passed through a 0.45-μm polypropylene syringe filter to remove insoluble particulate matter. Ten-microliter injections were chromatographically separated using an Agilent XDB-C18 column on an Agilent 1100 HPLC system. The mobile phase consisted of methanol, acetonitrile, monopotassium phosphate (0.075 M), and citric acid (1.0 M) (28:30:38:4) at a flow rate of 1 mL/min as described previously (36). Detection was performed using UV absorbance at 254 nm.
Dosing Studies
The Purdue Animal Care and Use Committee (PACUC) reviewed and approved the study protocol. Animal procurement, husbandry, and dosing studies were conducted under the supervision of a staff veterinarian of Purdue’s Lab Animal Program. Juvenile (∼20 kg, ∼2 months old) and adult crossbred farm pigs (∼40 kg, ∼4 months old) were obtained approximately 2 weeks prior to study initiation. During this 2-week period, the animals were socialized and trained to accept and swallow placebo tablets. After the 2-week socialization period, the animals were surgically modified with an indwelling jugular catheter, externalized in the dorsal scapular region as described previously (37). Following surgical recovery, the pigs were placed on a movement-responsive caging system which counter-rotates against the animal’s movement so that the catheter line does not twist (37). The animal has 270° of free rotation prior to movement response by the cage so that the cage only rotates to curtail catheter entangling. This system allows for automated blood sampling which has the benefit of providing a relatively stress-free environment for PK studies, since the study can be conducted with minimal human intervention compared to manual blood draws that can be very stressful for the animal (37).
Following acclimatization to the movement-responsive cage, the pigs were dosed with either 300-mg rifampin capsules or 50-mg rifampin ODTs, dependent upon the study. Blood samples (1 mL) were collected into vials containing K3EDTA as an anticoagulant at preprogrammed time points up to 24 h post-dose, which varied between the adult and juvenile pig studies due to PACUC guidance. Vials were held at 4°C on a fraction collector until protocol completion and then processed to plasma and stored frozen (−80°C) for no longer than one month prior to analysis. Stability studies indicated no degradation in porcine plasma at −80°C during this time period (data not shown). Plasma samples were analyzed by liquid chromatography–tandem mass spectrometry (LC–MS/MS) for rifampin content.
Rifampin Bioanalysis
Rifampin sample preparation and protein removal was performed by either a C2 SPE procedure (38) or a modified acetonitrile approach based on Hartkoorn et al. (39). For the latter, 300 μL of internal standard solution was added (rifabutin at 500 ng/mL in acetonitrile) to 100 μL of plasma. Samples were vortexed for 2 min, then centrifuged at 6,000×g for 10 min. Supernatant (100 μL) was transferred to a new vial, followed by the addition of 100 μL of 10 mM ammonium acetate in water. The sample solution was mixed, followed by submission for LC–MS/MS analysis.
For LC–MS/MS analysis, 5 μL was submitted to an Agilent 1200 series HPLC coupled to an Agilent 6460 triple quadrupole mass spectrometer (Agilent Technologies, Santa Clara, CA, USA). Chromatography was performed using a Zorbax XDB-C8 column (2.1 × 50 mm, 3.5 μm). Compounds were analyzed using a solvent system composed of 20 mM ammonium acetate in water (solvent A) and acetonitrile (solvent B). The linear elution gradient was as follows: 0 min 20% B, 0–2.5 min 90% B, 2.5–7 min hold 90% B, 7–7.5 min 20% B, and 7.5–11.5 min 20% B. Column flow was 0.3 mL/min. The Jetstream ESI source was operated in positive ion mode with the nozzle voltage set at 1,000 V and the capillary at 3,500 V. Nebulizer pressure was set at 40 psi, drying gas (nitrogen) was at 350°C with a flow rate of 9 L/min, and the sheath gas was at 300°C with a flow rate of 10 L/min. The fragmentor voltage was 145 V for all analytes. Multiple reaction monitoring was used for selective detection. The mass transitions were 823.3 to 791.2 for rifampin, 781.3 to 749.3 for 25-desacetyl rifampin, and 847.3 to 815.3 for rifabutin, with a dwell time for each compound of 50 ms. Collision cell energies were 17 eV for rifampin, 10 eV for 25-desacetyl rifampin, and 25 eV for rifabutin.
Compound retention time was 4.2 min for rifampin, 4.0 min for 25-desacetyl rifampin, and 5.3 min for rifabutin. Quantitation standards were prepared in the range of 100 to 20,000 ng/mL. Responses for rifampin and 25-desacetyl rifampin were normalized against the rifabutin internal standard response. Standard curves had a correlation coefficient of r2 > 0.99. Intra- and inter-day coefficients of variation for rifampin were 8.9% and 2.5%, respectively.
Pharmacokinetic Analysis
Noncompartmental pharmacokinetic data analysis was performed using PK Solutions 2.0 from Summit Research Services (Montrose, CO, USA). Rifampin plasma concentration time data were input into the software, and the resultant profiles were curve stripped to extract the PK parameters. Rifampin plasma concentrations below the limit of quantitation (100 ng/mL) were set to zero for determination of PK parameters. The PK parameters investigated were the maximum plasma concentration (Cmax), time to achieve Cmax (tmax), area under the plasma concentration time curve (AUC), elimination half life (t1/2), total body clearance (CL), and volume of distribution (VD). For comparison of porcine PK parameters determined in the present study with parameters obtained from the literature, dose normalization to 1 mg/kg administered was performed for ease of comparison.
In Vitro Dissolution and Disintegration Tests
Dissolution tests for the capsules and ODTs were performed according to the USP monograph for rifampin capsules (40) in an Erweka 6 vessel dissolution tester. Each dosage form was placed in a USP Type I Apparatus (basket) rotating at 100 RPM and submerged in 900 mL of 0.1 N HCl at 37°C. Samples (1 mL) were collected at selected time points and passed through a 0.45-μm polypropylene filter to remove insoluble particulate matter. Samples were then analyzed for rifampin content using a Varian Cary 50 UV–vis spectrophotometer set to 475 nm. Dissolution was considered complete when the absorbance measurements had reached a plateau for three consecutive time points. Disintegration tests were performed according to the USP general chapter for disintegration (41) using an Erweka disintegration tester. Rifampin ODTs were tested in 1 L of simulated saliva (42) warmed to 37°C, while rifampin capsules were tested in 1 L of 0.1 N HCl to mimic disintegration in vivo.
Statistical Analysis
Pharmacokinetic sample means were statistically compared using an unpaired, two-tailed t test with Welch’s correction at a 95% confidence level. Statistical analysis was performed using GraphPad Prism 5 and JMP 9.0. Statistical significance is denoted using the following notation *p < 0.05, **p < 0.01, ***p < 0.001.
RESULTS
Rifampin Pharmacokinetics in Adult Pigs
Two adult pigs (39.8–42.9 kg) were entered into the study, socialized, trained to accept placebo tablets, and surgically modified with jugular vein catheters. Following surgical recovery, each pig was administered two 300-mg rifampin capsules based upon the recommended dosing regimen of 10–20 mg/kg, resulting in an actual dosage range of 14.0–15.1 mg/kg. After a washout period of 24 h following the last blood sample, a second dose (two, 300-mg capsules) was administered to each pig resulting in a total of four replicates. Whole blood samples were taken at preprogrammed time points (n = 19 samples) up to 24 h post-dose. Figure 1 illustrates the plasma concentration time profiles for an individual adult pig (a) and for the mean profile of the four replicates in the study (b). The plasma concentration time profile for the individual pig demonstrated an initial peak concentration of 21.5 μg/mL at 0.75 h. However, the concentration declined to 18.4 μg/mL at 1 h and then peaked a second time to 23.1 μg/mL at 1.25 h. Three subsequent peaks at 2, 4, and 8 h post-dose were also observed. We hypothesize these peaks to result from enterohepatic circulation and reabsorption, which has been well documented for rifampin in humans (43–45). Similar peaks were also observed in the plasma concentration time profiles for the other pig in the study.
Fig. 1.
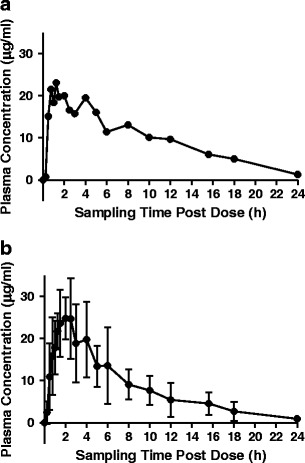
a Rifampin plasma concentration vs. time profile for a single adult pig (∼40 kg) dosed with two 300-mg rifampin capsules and b mean rifampin plasma concentration vs. time profile for two adult pigs (∼40 kg) dosed twice with two 300-mg rifampin capsules (four total samples). Each data point in b represents the mean of four samples
Each of the plasma concentration time profiles was curve stripped to extract the PK data as described above, and the relevant PK parameters are revealed in Table I. The mean Cmax and tmax values were 28.8 μg/mL and 2.1 h, respectively. The mean AUC0–t was 188.4 μg h/mL, while the mean t1/2 was 4.1 h. The CL and VD, normalized to relative bioavailability (F = 1) and body weight, were 0.1 L/h/kg and 0.4 L/kg, respectively. Inter-animal coefficients of variation (CV) ranged from 5.3% for body weight to 47.2% for AUC. All of these values fall within the normal range of rifampin PK parameters observed in human adults, as will be discussed below. Comparisons between the adult porcine rifampin PK data and the juvenile porcine rifampin PK data will also be discussed in subsequent sections.
Table I.
The Rifampin Pharmacokinetic Data Obtained in Juvenile and Adult Pigs Are Presented for Comparison as the Mean, Standard Deviation (±SD), and Inter-animal Coefficient of Variation
| Parameter | Juvenile pigs | Adult pigs | ||
|---|---|---|---|---|
| Mean (SD) | CV | Mean (SD) | CV | |
| n | 5 | 2/2a | ||
| Weight (kg) | 20.5 (1.6) | 7.9 | 41.4 (2.2)*** | 5.3 |
| Dose (mg/kg) | 14.7 (1.1) | 7.9 | 14.5 (0.8) | 5.3 |
| C max (μg/mL) | 7.0 (2.2) | 31.1 | 28.8 (5.6)** | 19.0 |
| t max (h) | 2.0 (0.8) | 42.9 | 2.1 (0.6) | 28.6 |
| AUC0–24 (μg h/mL) | 58.1 (18.4) | 31.6 | 188.4 (88.9)* | 47.2 |
| t 1/2 (h) | 3.5 (1.0) | 29.0 | 4.1 (1.2) | 29.3 |
| CL/F/weight (L/h/kg) | 0.3 (0.1) | 25.6 | 0.1 (0.0)*** | 27.0 |
| V D/F/weight (L/kg) | 1.3 (0.4) | 29.6 | 0.4 (0.0)** | 9.7 |
Means were compared using an unpaired, two-tailed t test with Welch’s correction at a 95% confidence level
SD standard deviation, CV coefficient of variation, C max maximum plasma concentration, t max time to achieve C max, AUC area under the plasma concentration time curve, t 1/2 elimination half life, CL total body clearance, V D volume of distribution
*p < 0.05; **p < 0.01; ***p < 0.001 (statistical significance)
aTwo adult pigs were used in the study. Each pig was dosed twice for a total of four replicates. Pharmacokinetic parameters for the adult pigs were calculated based on the four replicates
Rifampin Pharmacokinetics in Juvenile Pigs
Six juvenile pigs (19.3–22.3 kg) were entered into the study, socialized, trained to accept placebo tablets, and surgically modified with jugular vein catheters. One animal was removed from the study due to postoperative illness resulting in five complete PK profiles. Following surgical recovery, each pig was administered one 300-mg rifampin capsule based on the recommended dosing guidelines of 10–20 mg/kg, resulting in an actual dosage of 13.5–15.5 mg/kg. Whole blood samples were taken at preprogrammed time points (n = 18 samples) up to 24 h post-dose. Figure 2 illustrates the plasma concentration time profiles for an individual juvenile pig (a) and for the mean profile of the five juvenile pigs in the study (b). Similar to the adult pigs, the individual plasma concentration time profiles for the juvenile pigs exhibited multiple peaks characteristic of enterohepatic circulation and reabsorption. For example, the individual profile presented in Fig. 2 displays peaks at 1, 4, and 6 h post-dose. The mean PK parameters for the five juvenile pigs are presented in Table I. The mean Cmax and tmax values were 7.0 μg/mL and 2.0 h, respectively. The mean AUC0–t was 58.1 μg h/mL, while the mean t1/2 was 3.5 h. The CL and VD, normalized to F (1) and body weight, were 0.3 L/h/kg and 1.3 L/kg, respectively. Inter-animal CV ranged from 7.9% for dose to 42.9% for tmax.
Fig. 2.

a Rifampin plasma concentration vs. time profile for a single juvenile pig (∼20 kg) dosed with one 300-mg rifampin capsule and b mean rifampin plasma concentration vs. time profile for five juvenile pigs (∼20 kg) dosed with one 300-mg capsule. Each data point in b represents the mean of five samples
Ontogenic Changes in Porcine Rifampin Pharmacokinetic Parameters
Table I displays the rifampin PK parameters for both juvenile and adult pigs. The mean weights for the juvenile and adult pigs were 20.5 and 41.4 kg, respectively (p < 0.001). As described previously, juvenile pigs were administered one 300-mg rifampin capsule while adult pigs were administered two 300-mg rifampin capsules based upon currently recommended dosing regimens. This resulted in a mean dose, normalized to body weight, of approximately 14.7 mg/kg for the juvenile pigs and 14.5 mg/kg for the adult pigs. No statistical difference was observed between the two groups at these dose levels (p = 0.96).
Because the doses between the juvenile and adult pigs were not statistically different, PK parameters were compared directly instead of the comparison of parameters following dose normalization. Table I illustrates that the mean Cmax value for the juvenile pigs was significantly lower (7.0 μg/mL) than the mean Cmax value for the adult pigs (28.8 μg/mL; p < 0.01). When comparing tmax values, a statistical difference was not observed between the juvenile pigs (2.0 h) and the adult pigs (2.1 h; p = 0.80). However, AUC0–t did exhibit a statistically significant difference between the two groups (p = 0.01). Specifically, the juvenile pigs demonstrated lower exposure (58.1 μg h/mL) than the adult pigs (188.4 μg h/mL), which is consistent with the lower Cmax values observed for juvenile pigs reported above.
The t1/2 between the juvenile pigs (3.5 h) and the adult pigs (4.1 h) was not statistically different (p = 0.45). Conversely, CL normalized to F (1) and body weight for the juvenile pigs (0.3 L/h/kg) was significantly higher than for the adult pigs (0.1 L/h/kg; p < 0.001). The VD normalized to F (1) and body weight was over three-fold higher for the juvenile pigs (1.3 L/kg) than for the adult pigs (0.4 L/kg) and was found to be statistically different (p < 0.01). Similar trends in rifampin PK ontogeny have been reported for human patients, which will be discussed below (46).
Comparison of Juvenile Porcine and Human Pediatric Rifampin Pharmacokinetic Parameters
Juvenile porcine PK data were contrasted with published human pediatric data from literature sources (46–51) to assess the ability of juvenile pigs to predict human PK data. Table II illustrates the PK comparisons between the juvenile pigs and human children from six literature sources. Porcine dosing studies were conducted at 14.7 mg/kg, while the literature studies included for comparison ranged from 9.6 to 15.0 mg/kg. These doses resulted in mean Cmax values of 7.0 μg/mL for the pigs and 3.0–11.7 μg/mL for the literature studies. In order to more accurately compare Cmax values, dose normalized Cmax values were calculated as described above. The mean dose normalized Cmax value for the pigs (0.5 μg/mL) fell well within the range of values calculated from the literature sources of 0.3–1.2 μg/mL. Similarly, the mean tmax value for the pigs (2.0 h) was consistent with the range of tmax values reported in the literature for pediatrics (1.5–4.0 h). Finally, the t1/2 of rifampin in juvenile pigs (3.5 h) was observed to be similar to that of pediatric patients (1.9–3.8 h). Based on these parameters, it appears that the juvenile pigs might be capable of predicting rifampin PK in children. It should be noted that AUC values were not included for comparison because of extensive variation in blood sample collection times among the literature sources, thus preventing accurate interpretation of values. However, Cmax values correlate very well with AUC values for rifampin (52).
Table II.
Comparison of Rifampin Pharmacokinetic Data in Juvenile Pigs with Published Human Pediatric Data Obtained from Literature Sources Following Oral Administration
| Dose (mg/kg) | Dosage form | n | Age | Disease state | C max (μg/mL) | Dose normalized C max (μg/mL) | t max (h) | t 1/2 (h) | |
|---|---|---|---|---|---|---|---|---|---|
| Porcine | 14.7 | Capsule | 5 | 2 months | Healthy | 7.0 | 0.5 | 2.0 | 3.5 |
| Hussels et al. (47) | 10.0 | Capsule | 7 | 2–<6 years | NP | 6.5 | 0.7 | 3.8 | 2.1 |
| 10.0 | Capsule | 11 | 6–< 10 years | NP | 7.1 | 0.7 | 4.0 | 2.6 | |
| 10.0 | Capsule | 9 | 10–14 years | NP | 6.6 | 0.7 | 3.5 | 1.9 | |
| McCracken et al. (48) | 10.0 | Suspension | 21 | 6–58 months | Impetigo/cellulitis | 10.7 | 1.1 | 2.0 | 2.9 |
| 10.0 | Suspension in applesauce | 12 | 6–58 months | Impetigo/cellulitis | 8.9 | 0.9 | 2.0 | 2.9 | |
| 10.0 | Powder in applesauce | 5 | 6–58 months | Impetigo/cellulitis | 11.5 | 1.2 | 2.0 | 2.9 | |
| Seth et al. (49) | 12.0 | NP | 15 | NP | Normal/TB | 3.0 | 0.3 | 2.0 | 2.4 |
| 12.0 | NP | 30 | NP | Undernourished/TB | 3.3 | 0.3 | 2.0 | 2.1 | |
| 12.0 | NP | 10 | NP | Malnourished/TB | 3.4 | 0.3 | 2.0 | 2.4 | |
| Seth et al. (50) | 12.0 | NP | 64 | 1–13 years | PPC/TB | 3.9 | 0.3 | 2.0 | 3.0 |
| 12.0 | NP | 20 | 1–13 years | PPD/TB | 3.4 | 0.3 | 2.0 | 3.8 | |
| 12.0 | NP | 10 | 1–13 years | TBM | 3.9 | 0.3 | 2.0 | 3.2 | |
| Schaaf et al. (46) | 9.6 | Tablet | 21 | 3.7 years | HIV+/TB | 5.7 | 0.6 | 2.2 | NP |
| 9.6 | Tablet | 33 | 4.0 years | HIV−/TB | 6.3 | 0.7 | 1.7 | NP | |
| Thee et al. (51) | 10.0 | Tablet | 11 | 1.1 year | TB | 6.4 | 0.6 | 1.5 | NP |
| 15.0 | Tablet | 11 | 1.1 year | TB | 11.7 | 0.8 | 1.5 | NP |
Results are presented as the mean from each study
C max maximum plasma concentration, t max time to achieve C max, NP not provided, TB tuberculosis infected, PPC pulmonary primary complex, PPD progressive primary disease, TBM tuberculous meningitis, HIV + human immunodeficiency virus infected, HIV − human immunodeficiency virus un-infected
Effect of Dosage Form on Rifampin Pharmacokinetics in Juvenile Pigs
ODTs were formulated to assess whether PK differences would be observed in the porcine model as a result of dosage form variation. ODTs were manufactured as described above. The optimized formulation characteristics of the ODTs and of the 300-mg capsules are illustrated in Table III for comparative purposes. Assay results demonstrated a mean of 49.6-mg rifampin per ODT and 300.5-mg rifampin per capsule (p < 0.001). The mean disintegration time for the ODTs was 0.2 min compared to 14.7 min for the capsules (p < 0.001). Similarly, the time to reach 85% dissolution (T85%) for the ODTs (8.8 min) was significantly less than that of the capsules (42.2 min; p = 0.01). Based on these in vitro performance differences between the ODTs and capsules, the ODTs were administered to juvenile pigs in order to determine their PK parameters.
Table III.
Comparison of In Vitro Performance Characteristics of the Two Rifampin Dosage Forms Evaluated: 50-mg ODTs and 300-mg capsules
| Parameter | 50-mg ODT | 300-mg capsule |
|---|---|---|
| n | 6 | 6 |
| Assay (mg) | 49.6 (0.5) | 300.5 (0.7)*** |
| Disintegration time (min) | 0.2 (0.1) | 14.7 (1.7)*** |
| T 85% dissolution (min) | 8.8 (0.9) | 42.2 (5.9)* |
Results are presented as the mean and standard deviation (±SD). Means were compared using an unpaired, two-tailed t test at a 95% confidence level
ODT orally disintegrating tablet
*p < 0.05; ***p < 0.001 (statistical significance)
Six new juvenile pigs (19.3–20.8 kg) were entered into the study. However, one pig was removed from the study due to equipment malfunction with the caging system, one pig was excluded due to loss of catheter patency, and another pig had to be dropped due to multiple missed sample points, resulting in three pigs (20.7–20.8) with complete PK profiles. Following surgical recovery, each pig was administered one 50-mg rifampin ODT, resulting in an actual dosage of 2.4 mg/kg for each pig. Whole blood samples were taken at preprogrammed time points (n = 7 samples) up to 10 h post-dose. Figure 3 illustrates the plasma concentration time profiles for an individual juvenile pig (a) and for the mean profile of the three juvenile pigs in the study (b). Unlike the previous studies with the 300-mg capsules, no enterohepatic recirculation peaks were observed following administration of the 50-mg ODTs. However, this may be due to the decreased number of sampling points in the ODT study compared to the previous studies.
Fig. 3.

a Rifampin plasma concentration vs. time profile for a single juvenile pig (∼20 kg) dosed with one 50-mg rifampin ODT and b mean rifampin plasma concentration vs. time profile for three juvenile pigs (∼20 kg) dosed with one 50-mg rifampin ODT. Each data point in b represents the mean of three samples
The PK parameters for the 50-mg ODTs are illustrated in Table IV along with the PK parameters of the 300-mg rifampin capsules for comparison. The mean weight of the pigs in the ODT study (20.7 kg) was not significantly different than the mean weight of the pigs in the capsule study (20.5 kg; p = 0.76). Conversely, the mean dose of 2.4 mg/kg in the ODT study was significantly lower compared to the mean dose in the capsule study (14.7 mg/kg). The significant difference in dose between the two studies led to significant differences in Cmax and AUC0–t values. The mean Cmax and AUC0–t values for the ODT study were 1.1 μg/mL and 3.7 μg h/mL, while those for the capsule study were 7.0 μg/mL and 58.1 μg h/mL, respectively. Following dose normalization, the mean Cmax values between the two studies were identical (1.1 μg/mL). However, a statistical difference was observed for dose normalized AUC0–t. Specifically, the dose normalized AUC0–t for the ODT group (3.7 μg h/mL) was less than that of the capsule group (9.5 μg h/mL; p = 0.01). The mean t1/2 in the ODT study was 1.6 h, while that in the capsule study was 3.5 h (p = 0.01). Faster CL was observed in the ODT study (0.9 L/h/kg) compared to the capsule study (0.3 L/h/kg; p < 0.01). The VD was not statistically different (p = 0.15) between the ODT group (2.0 L/kg) and the capsule group (1.3 L/kg).
Table IV.
Comparison of In Vivo Pharmacokinetic Parameters in Juvenile (20 kg) Pigs for Two Dosage Forms of Rifampin
| Parameter | 50-mg ODT | CV | 300-mg capsule | CV |
|---|---|---|---|---|
| n a | 3 | 5 | ||
| Weight (kg) | 20.7 (0.1) | 0.5 | 20.5 (1.6) | 7.9 |
| Dose (mg/kg) | 2.4 (0.0) | 0.3 | 14.7 (1.1)*** | 7.9 |
| C max (μg/mL) | 1.1 (0.3) | 26.8 | 7.0 (2.2)** | 31.1 |
| AUC0−t (μg h/mL) | 3.7 (1.1) | 30.5 | 58.1 (18.4)** | 31.6 |
| Dose normalized C max (μg/mL) | 1.1 (0.3) | 26.8 | 1.1 (0.4) | 36.4 |
| Dose normalized AUC0−t (μg h/mL) | 3.7 (1.1) | 30.5 | 9.5 (3.0)* | 31.6 |
| t max (h) | 1.2 (0.3) | 24.7 | 2.0 (0.8) | 42.9 |
| t 1/2 (h) | 1.6 (0.1) | 8.6 | 3.5 (1.0)* | 29.0 |
| CL/F/weight (L/h/kg) | 0.9 (0.2) | 26.6 | 0.3 (0.1)** | 25.6 |
| V D/F/weight (L/kg) | 2.0 (0.5) | 25.3 | 1.3 (0.4) | 29.6 |
Results are presented as the mean and standard deviation (±SD). Means were compared using an unpaired, two-tailed t test with Welch’s correction at a 95% confidence level
ODT orally disintegrating tablet, CV coefficient of variation, C max maximum plasma concentration, AUC area under the plasma concentration time curve, t max time to achieve C max, t 1/2 elimination half life, CL total body clearance, V D volume of distribution
*p < 0.05; **p < 0.01; ***p < 0.001 (statistical significance)
aThe three pigs in the 50-mg ODT study were different animals than the five pigs in the 300-mg capsule study
It is interesting to note that the tmax value for the ODT study (1.2 h) is smaller than the tmax for the capsule formulation (2.0 h). Figure 4a illustrates the dose normalized plasma concentration time profiles for each of the two formulations. These profiles demonstrate that identical dose normalized Cmax values were achieved in each study, but the tmax value for the ODTs was shorter compared to the capsule formulation. Figure 4b illustrates the dissolution profiles for the 50-mg ODTs and the 300-mg capsules. The dissolution profile of the ODTs reveals that there was an initial burst release which occurred within the first 10 min of dissolution (T85% = 8.8 min). Conversely, there was a lag phase of approximately 15 min in the dissolution profile of the capsule formulation before significant dissolution occurred (T85% = 42.2 min).
Fig. 4.
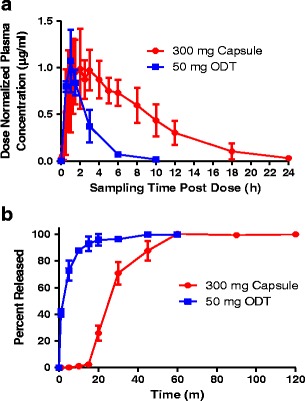
a Dose normalized rifampin plasma concentration vs. time profiles for the 300-mg rifampin capsules and the 50-mg rifampin ODTs in the juvenile pigs (∼20 kg). b Dissolution profiles for the 300-mg rifampin capsules (n = 6) and 50-mg rifampin ODTs (n = 6). Dissolution for both dosage forms was performed according to the USP monograph for rifampin capsules in 900 mL of 0.1 N HCl at 37°C using a type I apparatus (basket) rotating at 100 RPM
Comparison of Porcine Rifampin PK Data with Other Preclinical Animal Models
Rifampin PK data obtained from the juvenile pigs were contrasted with rifampin data from other preclinical animal models that have been reported in the literature (53–59). Table V illustrates the Cmax, dose normalized Cmax, tmax, and t1/2 values for pigs, mice, rats, dogs, and monkeys following oral administration of rifampin. The dose levels ranged from 2.4 to 100 mg/kg for all of the studies conducted. Because of the large range in dosing, Cmax values displayed a significant degree of variation across the studies (1.1–49.6 μg/mL). Consequently, dose normalized Cmax values were calculated using the same technique described above. From Table V, dose normalized Cmax values from largest to smallest for each species are dogs (1.2–3.7 μg/mL) > mice (0.7–2.0 μg/mL) > monkeys (0.3–0.8 μg/mL) > pigs (0.5 μg/mL) > rats (0.1–0.6 μg/mL). The range of dose normalized Cmax values for human children reported in Table II is 0.3–1.2 μg/mL.
Table V.
Comparison of Rifampin Pharmacokinetic Parameters in Juvenile Pigs with Four Commonly Utilized Preclinical Animal Models
| n | Dose (mg/kg) | C max (μg/mL) | Dose normalized C max (μg/mL) | t max (h) | t 1/2 (h) | |
|---|---|---|---|---|---|---|
| Juvenile porcinea | ||||||
| 3 | 2.4 | 1.1 | 0.5 | 1.2 | 1.6 | |
| 5 | 14.7 | 7.0 | 0.5 | 2.0 | 3.5 | |
| Mouse | ||||||
| Bruzzese et al. (53) | 10 | 10.0 | 20.0 | 2.0 | 2.0 | 6.7 |
| 4 | 10.0 | 14.7 | 1.5 | 0.5 | 5.3 | |
| Pallanza et al. (54) | 10 | 5.0 | 3.4 | 0.7 | 2.0 | 7.2b |
| 10 | 10.0 | 7.7 | 0.8 | 7.0 | 5.1b | |
| Rat | ||||||
| Bruzzese et al. (53) | 4 | 60.0 | 8.5 | 0.1 | 6.0 | 9.3 |
| Venturini et al. (55) | 4 | 100.0 | 49.6 | 0.5 | 6.0 | 5.5b |
| Agrawal et al. (56) | 6 | 10.0 | 5.8 | 0.6 | 1.6 | 7.0 |
| Dog | ||||||
| Bruzzese et al. (53) | 2 | 2.5 | 3.1 | 1.2 | 2.0 | 11.9 |
| Finkel et al. (57) | 2 | 10.0 | 37.0 | 3.7 | 3.0 | 8.0 |
| Monkey | ||||||
| Bruzzese et al. (53) | 3 | 30.0 | 17.6 | 0.6 | 4.0 | 3.7 |
| Stetter et al. (58) | 1 | 20.0 | 5.2 | 0.3 | 6.0 | NP |
| Ohtsuka et al. (59) | 3 | 20.0 | 16.5 | 0.8 | 4.0 | NP |
Results for each parameter are presented as the mean of each study following oral administration of rifampin at the indicated dose
C max maximum plasma concentration, t max time to achieve C max, NP not provided
aJuvenile porcine data are from the 50-mg ODT study (n = 3) and the 300-mg capsule study (n = 5) presented in this manuscript. The ODT study used different pigs than the capsule study
bNot provided directly from source; calculated based on plasma concentration time data provided from source
The rank order for tmax values from largest to smallest for each of the animal species in Table V is monkeys (4.0–6.0 h) > rats (1.6–6.0 h) > mice (0.5–7.0 h) > dogs (2.0–3.0 h) > pigs (1.2–2.0 h). Values for tmax for children in Table II varied from 1.5 to 4.0 h, with 2.0 h being the most common value reported. Finally, t1/2 values were the greatest for the dogs (8.0–11.9 h) followed by rats (5.5–9.3 h), mice (5.1–7.2 h), monkeys (3.7 h), and pigs (1.6–3.5 h). Values for t1/2 for human children in Table II ranged from 1.9 to 3.8 h.
DISCUSSION
Rifampin PK in adults have been demonstrated to possess a large degree of inter-individual variability (44,46,52,56). This variability has been attributed to a variety of factors including physicochemical differences in both the drug substance and the drug product, as well as biological differences among patients (60,61). Because of this variability, it is particularly difficult to extrapolate adult data in an attempt to predict pediatric data for rifampin, as well as for many other drugs. This problem is further complicated by the lack of understanding of fundamental differences in the ADME processes between adults and children (13). As a result, there is a significant unmet need for a model that has the ability to accurately predict pediatric PK data. Based on this unmet need, our laboratory has conducted a proof of concept study to determine the utility of juvenile pigs to model and predict human pediatric PK of rifampin.
Based on the fact that pigs have been established as human surrogates for adult PK, we initially set out to demonstrate feasibility by determining the rifampin PK parameters in adult pigs (40 kg, ∼4 months old). Forty-kilogram pigs were selected as the “adult” model based upon age at sexual maturity and size limitations associated with the PigTurn caging system. The results presented in Table I and Fig. 1 demonstrate that adult pigs have the capability to accurately predict rifampin PK in adult patients. For example, extensive studies from Acocella et al. document that adult humans dosed at the same level as the adult pigs (600 mg) achieve a Cmax value of 22.7 ± 3.2 μg/mL (43). This finding is very similar to the Cmax obtained in the adult pigs of 28.8 ± 5.6 μg/mL. Similarly, tmax in the human study (2.0 h) was the same as in the pig study (2.1 h). Figure 1a also reveals that multiple peaks are observed throughout the plasma concentration time profile. These peaks are highly indicative of enterohepatic circulation, which has also been well documented to occur in humans (43–45). The t1/2 in adult humans at a 600-mg dose (3.4 ± 0.3 h) (43) also compared favorably with that observed in adult pigs at the same dose (4.1 ± 1.2 h). CL in adult humans is approximately 0.2 L/h/kg (62) and is quite similar to that observed in the adult pigs (0.1 L/h/kg). It should be noted that the VD in human adults (0.9 L/kg) (62) is approximately twice that obtained for the adult pigs (0.4 L/kg). Based upon the similarities observed in rifampin PK between adult pigs and humans, further studies were conducted in juvenile pigs (20 kg, ∼2 months old) to determine ontogenic changes in rifampin PK. Fifteen-kilogram pigs were the smallest that could be used under the PACUC guidance and grew to 20 kg by the time when matched by weight with CDC growth charts, representing a child that is approximately 5.5 years old (63).
Comparison of the juvenile and adult porcine data reveals multiple age-based changes in rifampin PK, which are similar to differences reported clinically for pediatric and adult patients. For example, Cmax in the juvenile pigs (7.0 μg/mL) was approximately one fourth of the Cmax in the adult pigs (28.8 μg/mL). Similarly, AUC0–t values were also significantly lower for the juvenile pigs compared to the adult pigs. These findings are consistent with the work of Acocella et al. (64) who discovered that rifampin plasma concentrations clinically determined in children were one third to one tenth the concentrations found in adults. It was hypothesized that this difference is primarily due to differences in body water composition between the two groups, with a larger VD in children compared to adults (64). Consistent with finding a two-fold difference in the rifampin VD between children and adult patients by Acocella et al. (64) and Schaaf et al. (46), a larger VD was observed for the juvenile pigs (1.3 L/kg) compared to the adult pigs (0.4 L/kg).
There were further suggestions that the differences between juvenile and adult pig PK resemble the differences between human children and adult PK. The t1/2 of rifampin in juvenile pigs (3.5 h) was not statistically different from that of the adult pigs (4.1 h), which matches previous studies that found similarities in rifampin t1/2 for human children and adults (45,51,65). There was also a statistical difference in the CL of rifampin between juvenile and adult pigs, with CL for the juvenile pigs (0.3 L/h/kg) approximately three times greater than CL in the adult pigs (0.1 L/h/kg). This matches previous reports of faster CL of anti-tuberculosis drugs in children compared to adults and is hypothesized to be due to the greater mass of the liver in children relative to total body weight (66,67).
The similarities in rifampin PK parameters between juvenile porcine and human children presented in Table II cover a broad age group of children (6 months to 14 years). Given the large age range, it is important to consider individual studies to determine whether the 20-kg pigs are more predictive for one particular age group over another. Studies conducted by Acocella and Tan et al. have illustrated marked differences in rifampin PK in neonates compared to older children up to 18 months (45,68). Furthermore, the study conducted by Hussels et al. found that there were no statistical differences in rifampin PK between three age groups: 2–<6, 6–<10, and 10–14 years old (47). Finally, a comprehensive review of the literature by Donald et al. highlighted low rifampin concentrations in children less than 13 years of age relative to adults (52). Collectively, these results suggest that the 20-kg pig may be capable of accurately modeling rifampin PK in children between the ages of 2 and 13 years of age. However, further studies would need to be conducted in order to confirm this hypothesis.
One potential discrepancy between porcine and human rifampin PK is that the primary metabolite of rifampin, 25-desacetyl rifampin, was not detected in the plasma for any of the porcine studies. While it is known that 25-desacetyl rifampin is reabsorbed to a much lesser extent than rifampin following elimination in the bile, detection of the metabolite has still been observed in human studies (65,69). This implies that there may be differences between porcine and humans in either the rate/extent of metabolism or in the rate/extent of reabsorption of the metabolite. It should be noted that bile, which is enriched in 25-desacetyl rifampin compared to serum (45), was not collected for analysis during the porcine studies. Further experiments including collection and analysis of bile would be required in order to determine causality of the absence of 25-desacetyl rifampin in the porcine plasma.
In addition to the ability of the porcine model to predict human rifampin PK parameters in both adults and pediatrics, the model was also evaluated to determine if it could differentiate between dosage forms. Table IV and Fig. 4 demonstrate that there were marked differences in PK parameters between the 50-mg ODT and the 300-mg capsule. Despite the fact that dose-normalized Cmax values were unaltered between the two dosage forms, dose normalized AUC0–t were statistically different. The increase in dose normalized AUC0–t in the 300-mg capsule results from slower elimination compared to the 50-mg ODT (Table IV). For example, the t1/2 for the 50-mg ODT was approximately half of that for the 300-mg capsule. Similarly, the CL in the 50-mg ODT was three fold higher than for the 300-mg capsule. Collectively, these results imply that rifampin elimination in pigs is dose dependent. Dose-dependent elimination has also been reported for humans, where the t1/2 increased from 2.6 h for a 300-mg dose to 5.1 h for a 900-mg dose (45).
Figure 4 also demonstrates that differences in dissolution properties of dosage forms were manifested through differences in tmax values in vivo. The faster disintegration time and dissolution of the ODTs resulted in shorter tmax values compared to the capsules. The ability of the porcine model to demonstrate differences between the dosage forms may allow pharmaceutical scientists to begin to optimize formulations earlier in the development process. This could be particularly valuable for formulations targeted to infants and children. This is also particularly important for compounds requiring complex formulations because of restricted absorption windows or poor biopharmaceutical properties.
The final comparisons made during this study were between porcine and other preclinical animal data. Table V demonstrates that dose normalized Cmax values obtained in pigs were slightly less than those obtained in monkeys, but still quite similar to those obtained in humans. Moreover, the porcine data for Cmax more closely matched the values reported in the literature for human children than previous data reported for dogs. Specifically, dogs overestimated the serum concentrations of rifampin that have been observed in humans. In a study conducted by Cohn (70), it was found that serum concentrations obtained in dogs were nearly four times greater than those obtained in humans. Furthermore, it was demonstrated that the dog retained elevated serum levels (slower elimination) for longer periods of time than humans (70). The increased serum levels in dogs compared to humans have also been reported for a wide variety of compounds and are hypothesized to be resultant of the longer villi in dogs (71). Additionally, dogs have a higher bile salt secretion rate than humans which may facilitate absorption through solubilization of compounds and/or increasing intestinal permeability (71). With respect to the other animals in Table V, mice also tend to overestimate rifampin serum levels, while rat serum levels were similar to those reported for humans.
Values for tmax for pigs and dogs were comparable to those observed in humans. However, tmax values for rats, monkeys, and one study of mice differed significantly compared to humans (Table V). A plausible explanation for this may be due to gastric pH differences between the three species. For example, the pH in the anterior region of the stomach is 4.5 for mice, 4.3–5.1 for rats, and 4.7–5.0 for monkeys (17). This is in contrast to the dog (1.5–5.5) and pig (1.6–4.3), which are much more similar to that of man (1.5–5.0) (17). Because rifampin is zwitterionic with two pKa values (1.7 and 7.9), it is highly soluble at low pH. Therefore, the elevated gastric pH in the stomach of mice, rats, and monkeys may lower the solubility of rifampin and delay its absorption.
The largest interspecies differences were observed for the t1/2 of rifampin. Mice, rats, and dogs, all significantly overestimated the t1/2 of rifampin compared to humans. This is in contrast to the t1/2 in pigs (1.6–3.5 h) which fell well within the range of reported values for humans (1.5–5.0 h) (70). This finding further supports the previous statements that pigs may be the most appropriate animal model for conducting preclinical metabolic studies (28–32).
LIMITATIONS
The present study was conducted to provide preliminary proof-of-concept results supporting the hypothesis that the juvenile porcine model may potentially serve as a surrogate for human children during preclinical PK testing. Because of the preliminary nature of the study, only a small number of subjects were investigated. Despite the apparent similarities in human/porcine rifampin PK observed in the current study, additional studies with an increased number of subjects would provide greater predictive power for the model and reduce the likelihood that the similarities in PK were merely coincidental. Furthermore, literature sources used to obtain PK data for human adults and children contained very little information about the types of oral formulations of rifampin that were administered to patients to collect the PK data. The lack of information surrounding the clinical formulations may potentially obfuscate comparisons with the porcine data, particularly for the pediatric data where extemporaneous formulations are often administered to alleviate swallowing difficulties which are quite common among children.
Given the broad age range reported in the literature sources for children, it is extremely difficult to classify for which age group the juvenile pigs most accurately represent. For example, the papers by McCracken et al. (48) and Seth et al. (49) cover two and three of the ICH age classification groups, respectively. Without more detailed age-specific PK information from the literature sources, it is extremely difficult to match the PK data collected in juvenile pigs with a particular ICH classification for children. Due to this lack of information, more detailed studies would need to be conducted to determine for which age group the juvenile pigs provide the best prediction.
The absence of the primary metabolite of rifampin, 25-desacetyl rifampin, in porcine plasma also suggests that differences may exist between pigs and humans in either the rate/extent of metabolism and/or the rate/extent of reabsorption of the metabolite. Future experiments, including the collection and analysis of bile and hepatic tissue, should be conducted in order to determine if the active metabolite is produced in pigs. Additionally, multiple-dose studies to provide steady-state information in pigs would enable better assessment of the suitability of juvenile pigs as models for children.
CONCLUSION
Our results demonstrate that porcine models, both adult and juvenile, may be capable of serving as an accurate preclinical surrogate for rifampin PK testing for human adults and children, respectively. In fact, porcine PK data obtained from these studies are more similar to human rifampin PK data than what has been reported for canine and other species’ PK data. However, it should be noted that further testing with many additional APIs is necessary in order to validate whether or not the porcine model is better than other currently utilized animal models. Such testing with additional APIs could provide valuable insights into the utility of using the porcine model as a means to predict human PK/PD response. Moreover, societal acceptance of the porcine model in preclinical pharmaceutical testing is likely to be greater than for other animals such as dogs or non-human primates because pigs are a food animal (72).
The results presented in this manuscript provide a proof of concept for conducting further studies in the juvenile porcine model. Our findings are intended to stimulate further research utilizing pigs as a PK/PD model. More specifically, we are interested in developing and validating the juvenile porcine model as a surrogate for human children during preclinical testing. Such research is already taking hold in developmental and juvenile toxicity studies but would provide a significant impact and improve drug development if it could be further expanded into PK and other PD areas (16). If our results from the rifampin PK studies are truly indicative of the predictive power of this model, then we believe that pigs will be a valuable tool for studying drug behavior in humans, thus allowing for expedited drug development. This would be particularly advantageous for pediatric drug development where a knowledge gap still exists in the fundamental differences in the ADME processes between adults and pediatrics.
Acknowledgments
The authors would like to acknowledge the financial support received from the Indiana Clinical and Translational Sciences Institute (NIH Grant # RR025761, Dr. Knipp and Dr. Vreeman), the Dane O. Kildsig Center for Pharmaceutical Processing and Research, and the 2011–2012 Lilly Endowment Graduate Research Fellowship for Mr. Wyatt Roth. The authors would like to acknowledge that the porcine studies were conducted in the Purdue Translational Pharmacology (PTP) Core Facility of the Clinical Translational Sciences Award (Core Pilot Funding NIH Grant # RR025761). In addition, we would also like to thank Bioanalytical Systems, Inc. and Dr. Jeremy Marchant-Forde for providing access to the PigTurn-Culex-L® units. We would also like to acknowledge the assistance of Dr. Lee Matthews from the Purdue Office of the Vice President for Research for serving as the staff veterinarian for these studies. Finally, we thank Drs. Peter Kissinger, Carmen Popescu, and Rodolfo Pinal for their helpful suggestions and assistance on the project.
REFERENCES
- 1.Shirkey H. Therapeutic orphans. J Pediatr. 1968;72:119–20. doi: 10.1016/S0022-3476(68)80414-7. [DOI] [PubMed] [Google Scholar]
- 2.Milne CP, Bruss JB. The economics of pediatric formulation development for off-patent drugs. Clin Ther. 2008;30:2133–45. doi: 10.1016/j.clinthera.2008.11.019. [DOI] [PubMed] [Google Scholar]
- 3.Hoppu K, Anabwani G, Garcia-Bournissen F, Gazarian M, Kearns GL, Nakamura H, et al. The status of paediatric medicines initiatives around the world—what has happened and what has not? Eur J Clin Pharmacol. 2012;68:1–10. doi: 10.1007/s00228-011-1089-1. [DOI] [PubMed] [Google Scholar]
- 4.Rose K. Challenges in pediatric drug development: a pharmaceutical industry perspective. Paediatr Drugs. 2009;11:57–9. doi: 10.2165/0148581-200911010-00019. [DOI] [PubMed] [Google Scholar]
- 5.Gazarian M. Delivering better medicines to children: need for better integration between the science, the policy, and the practice. Paediatr Drugs. 2009;11:41–4. doi: 10.2165/0148581-200911010-00014. [DOI] [PubMed] [Google Scholar]
- 6.Schirm E, Tobi H, de Vries TW, Choonara I, De Jong-van den Berg LT. Lack of appropriate formulations of medicines for children in the community. Acta Paediatr. 2003;92:1486–9. doi: 10.1111/j.1651-2227.2003.tb00837.x. [DOI] [PubMed] [Google Scholar]
- 7.Nunn T, Williams J. Formulation of medicines for children. Br J Clin Pharmacol. 2005;59:674–6. doi: 10.1111/j.1365-2125.2005.02410.x. [DOI] [PMC free article] [PubMed] [Google Scholar]
- 8.Walters S. Report to WHO concerning international guidelines for paediatric medicines. Geneva: World Health Organization; 2010. http://www.who.int/childmedicines/paediatric_regulators/International_guidelines.pdf. Accessed 30 Aug 2012
- 9.Lam MS. Extemporaneous compounding of oral liquid dosage formulations and alternative drug delivery methods for anticancer drugs. Pharmacotherapy. 2011;31:164–92. doi: 10.1592/phco.31.2.164. [DOI] [PubMed] [Google Scholar]
- 10.Blake MJ, Abdel-Rahman SM, Jacobs RF, Lowery NK, Sterling TR, Kearns GL. Pharmacokinetics of rifapentine in children. Pediatr Infect Dis J. 2006;25:405–9. doi: 10.1097/01.inf.0000214963.55217.9c. [DOI] [PubMed] [Google Scholar]
- 11.Notterman DA, Nardi M, Saslow JG. Effect of dose formulation on isoniazid absorption in two young children. Pediatrics. 1986;77:850–2. [PubMed] [Google Scholar]
- 12.Giacoia GP, Taylor-Zapata P, Mattison D. Eunice Kennedy Shriver National Institute of Child Health and Human Development Pediatric Formulation Initiative: selected reports from working groups. Clin Ther. 2008;30:2097–101. doi: 10.1016/j.clinthera.2008.11.017. [DOI] [PubMed] [Google Scholar]
- 13.De Cock RF, Piana C, Krekels EH, Danhof M, Allegaert K, Knibbe CA. The role of population PK-PD modelling in paediatric clinical research. Eur J Clin Pharmacol. 2011;67:5–16. doi: 10.1007/s00228-009-0782-9. [DOI] [PMC free article] [PubMed] [Google Scholar]
- 14.Yu LX, Ellison CD, Hussain AS. Predicting human oral bioavailability using in silico models. In: Krishna R, editor. Applications of pharmacokinetic principles in drug development. New York: Kluwer Academic/Plenum; 2004. pp. 53–72. [Google Scholar]
- 15.Grass GM, Sinko PJ. Physiologically-based pharmacokinetic simulation modelling. Adv Drug Deliv Rev. 2002;54:433–51. doi: 10.1016/S0169-409X(02)00013-3. [DOI] [PubMed] [Google Scholar]
- 16.Swindle MM, Makin A, Herron AJ, Clubb FJ, Frazier KS. Swine as models in biomedical research and toxicology testing. Veterinary Pathology. 2012;49:344–56. doi: 10.1177/0300985811402846. [DOI] [PubMed] [Google Scholar]
- 17.DeSesso JM, Williams AL. Contrasting the gastrointestinal tracts of mammals: factors that influence absorption. Ann Rep Med Chem. 2008;43:353–71. doi: 10.1016/S0065-7743(08)00021-3. [DOI] [Google Scholar]
- 18.Svendsen O. The minipig in toxicology. Exp Toxicol Pathol. 2006;57:335–9. doi: 10.1016/j.etp.2006.03.003. [DOI] [PubMed] [Google Scholar]
- 19.FDA. Guidance for industry nonclinical safety evaluation of pediatric drug products. Silver Spring: Food and Drug Administration; 2006. http://www.fda.gov/downloads/Drugs/GuidanceComplianceRegulatoryInformation/Guidances/ucm079247.pdf. Accessed 30 Aug 2012.
- 20.EMA. Guideline on the need for non-clinical testing in juvenile animals of pharmaceuticals for paediatric indications. London: European Medicines Agency; 2005. http://www.ema.europa.eu/docs/en_GB/document_library/Scientific_guideline/2009/09/WC500003306.pdf. Accessed 30 Aug 2012.
- 21.Baldrick P. Juvenile animal testing in drug development—is it useful? Reg Tox Pharmacol. 2010;57:291–9. doi: 10.1016/j.yrtph.2010.03.009. [DOI] [PubMed] [Google Scholar]
- 22.Bode G, Clausing P, Gervais F, Loegsted J, Luft J, Nogues V, et al. The utility of the minipig as an animal model in regulatory toxicology. J Pharmacol Toxicol Methods. 2010;62:196–220. doi: 10.1016/j.vascn.2010.05.009. [DOI] [PubMed] [Google Scholar]
- 23.Forster R, Ancian P, Fredholm M, Simianer H, Whitelaw B. The minipig as a platform for new technologies in toxicology. J Pharmacol Toxicol Methods. 2010;62:227–35. doi: 10.1016/j.vascn.2010.05.007. [DOI] [PubMed] [Google Scholar]
- 24.Forster R, Bode G, Ellegaard L, van der Laan JW. The RETHINK project—minipigs as models for the toxicity testing of new medicines and chemicals: an impact assessment. J Pharmacol Toxicol Methods. 2010;62:158–9. doi: 10.1016/j.vascn.2010.05.003. [DOI] [PubMed] [Google Scholar]
- 25.Forster R, Bode G, Ellegaard L, van der Laan JW. The RETHINK project on minipigs in the toxicity testing of new medicines and chemicals: conclusions and recommendations. J Pharmacol Toxicol Methods. 2010;62:236–42. doi: 10.1016/j.vascn.2010.05.008. [DOI] [PubMed] [Google Scholar]
- 26.Kararli TT. Comparison of the gastrointestinal anatomy, physiology, and biochemistry of humans and commonly used laboratory-animals. Biopharm Drug Dispos. 1995;16:351–80. doi: 10.1002/bdd.2510160502. [DOI] [PubMed] [Google Scholar]
- 27.van der Laan JW, Brightwell J, McAnulty P, Ratky J, Stark C, Project R. Regulatory acceptability of the minipig in the development of pharmaceuticals, chemicals and other products. J Pharmacol Toxicol Methods. 2010;62:184–95. doi: 10.1016/j.vascn.2010.05.005. [DOI] [PubMed] [Google Scholar]
- 28.Skaanild MT, Friis C. Characterization of the P450 system in Gottingen minipigs. Pharmacol Toxicol. 1997;80:28–33. doi: 10.1111/j.1600-0773.1997.tb01986.x. [DOI] [PubMed] [Google Scholar]
- 29.Skaanild MT, Friis C. Cytochrome P450 sex differences in minipigs and conventional pigs. Pharmacol Toxicol. 1999;85:174–80. doi: 10.1111/j.1600-0773.1999.tb00088.x. [DOI] [PubMed] [Google Scholar]
- 30.Skaanild MT, Friis C. Porcine CYP2A polymorphisms and activity. Basic Clin Pharmacol Toxicol. 2005;97:115–21. doi: 10.1111/j.1742-7843.2005.pto_148.x. [DOI] [PubMed] [Google Scholar]
- 31.Skaanild MT. Porcine cytochrome P450 and metabolism. Current Pharm Design. 2006;12:1421–7. doi: 10.2174/138161206776361183. [DOI] [PubMed] [Google Scholar]
- 32.Fink-Gremmels J. Implications of hepatic cytochrome P450-related biotransformation processes in veterinary sciences. Eur J Pharmacol. 2008;585:502–9. doi: 10.1016/j.ejphar.2008.03.013. [DOI] [PubMed] [Google Scholar]
- 33.Goh LB, Spears KJ, Yao DG, Ayrton A, Morgan P, Wolf CR, et al. Endogenous drug transporters in in vitro and in vivo models for the prediction of drug disposition in man. Biochem Pharmacol. 2002;64:1569–78. doi: 10.1016/S0006-2952(02)01355-2. [DOI] [PubMed] [Google Scholar]
- 34.WHO. 3rd WHO model list of essential medicines for children. Geneva: World Health Organization; 2011. http://whqlibdoc.who.int/hq/2011/a95054_eng.pdf. Accessed 2 Jun 2012.
- 35.US Pharmacopeia. Rifampin capsules. Rockville: US Pharmacopeia; 2012. http://www.uspnf.com/uspnf/pub/index?usp=35&nf=30&s=0&officialOn=May 1, 2012. Accessed 23 Jan 2012.
- 36.Liu JF, Sun J, Zhang W, Gao K, He ZG. HPLC determination of rifampicin and related compounds in pharmaceuticals using monolithic column. J Pharm Biomed Analysis. 2008;46:405–9. doi: 10.1016/j.jpba.2007.10.025. [DOI] [PubMed] [Google Scholar]
- 37.Marchant-Forde J, Matthews D, Poletto R, McCain R, Mann D, DeGraw R, et al. Plasma cortisol and noradrenalin concentrations in pigs: automated sampling of freely moving pigs housed in the PigTurn(R) versus manually sampled and restrained pigs. Animal Welfare. 2012;21:197–205. doi: 10.7120/09627286.21.2.197. [DOI] [Google Scholar]
- 38.Naidong W, Shou WZ, Addison T, Maleki S, Jiang X. Liquid chromatography/tandem mass spectrometric bioanalysis using normal-phase columns with aqueous/organic mobile phases—a novel approach of eliminating evaporation and reconstitution steps in 96-well SPE. Rapid Commun Mass Spectrom. 2002;16:1965–75. doi: 10.1002/rcm.817. [DOI] [PubMed] [Google Scholar]
- 39.Hartkoorn RC, Khoo S, Back DJ, Tjia JF, Waitt CJ, Chaponda M, et al. A rapid and sensitive HPLC-MS method for the detection of plasma and cellular rifampicin. J Chromatogr B Analyt Technol Biomed Life Sci. 2007;857:76–82. doi: 10.1016/j.jchromb.2007.07.005. [DOI] [PubMed] [Google Scholar]
- 40.US Pharmacopeia. Rifampin capsules. Rockville: US Pharmacopeia; 2012 http://www.uspnf.com/uspnf/display?cmd=jsp&page=chooser. Accessed 10 Sep 2012.
- 41.US Pharmacopeia. Disintegration. Rockville: US Pharmacopeia; 2012 http://www.uspnf.com/uspnf/display?cmd=jsp&page=chooser. Accessed 10 Sep 2012
- 42.Gal JY, Fovet Y, Adib-Yadzi M. About a synthetic saliva for in vitro studies. Talanta. 2001;53:1103–15. doi: 10.1016/S0039-9140(00)00618-4. [DOI] [PubMed] [Google Scholar]
- 43.Acocella G, Pagani V, Marchetti M, Baroni GC, Nicolis FB. Kinetic studies on rifampicin. I. Serum concentration analysis in subjects treated with different oral doses over a period of two weeks. Chemotherapy. 1971;16:356–70. doi: 10.1159/000220750. [DOI] [PubMed] [Google Scholar]
- 44.Acocella G. Pharmacokinetics and metabolism of rifampin in humans. Rev Infect Dis. 1983;5:S428–32. doi: 10.1093/clinids/5.Supplement_3.S428. [DOI] [PubMed] [Google Scholar]
- 45.Acocella G. Clinical pharmacokinetics of rifampicin. Clin Pharmacokinet. 1978;3:108–27. doi: 10.2165/00003088-197803020-00002. [DOI] [PubMed] [Google Scholar]
- 46.Schaaf HS, Willemse M, Cilliers K, Labadarios D, Maritz JS, Hussey GD, et al. Rifampin pharmacokinetics in children, with and without human immunodeficiency virus infection, hospitalized for the management of severe forms of tuberculosis. BMC Med. 2009;7:19. doi: 10.1186/1741-7015-7-19. [DOI] [PMC free article] [PubMed] [Google Scholar]
- 47.Hussels H, Kroening U, Magdorf K. Ethambutol and rifampicin serum levels in children: second report on the combined administration of ethambutol and rifampicin. Pneumonogie. 1973;149:31–8. doi: 10.1007/BF02179950. [DOI] [PubMed] [Google Scholar]
- 48.McCracken G, Ginsburg C, Zweighaft T, Clahsen J. Pharmacokinetics of rifampin in infants and children: relevance to prophylaxis against Haemophilus influenzae type B disease. Pediatrics. 1980;66:17–21. [PubMed] [Google Scholar]
- 49.Seth V, Beotra A, Bagga A, Seth S. Drug therapy in malnutrition. Indian J Pediatr. 1992;29:1341–6. [PubMed] [Google Scholar]
- 50.Seth V, Beotra A, Seth S, Semwal O, Kabra S, Jain Y. Serum concentrations of rifampicin and isoniazid in tuberculosis. Indian J Pediatr. 1993;30:1091–8. [PubMed] [Google Scholar]
- 51.Thee S, Detjen A, Wahn U, Magdorf K. Rifampicin serum levels in childhood tuberculosis. Int J Tuberc Lung Dis. 2009;13:1106–11. [PubMed] [Google Scholar]
- 52.Donald PR, Maritz JS, Diacon AH. The pharmacokinetics and pharmacodynamics of rifampicin in adults and children in relation to the dosage recommended for children. Tuberculosis. 2011;91:196–207. doi: 10.1016/j.tube.2011.02.004. [DOI] [PubMed] [Google Scholar]
- 53.Bruzzese T, Rimaroli C, Bonabello A, Mozzi G, Ajay S, Cooverj ND. Pharmacokinetics and tissue distribution of rifametane, a new 3-azinomethyl-rifamycin derivative, in several animal species. Arzneimittelforschung. 2000;50:60–71. doi: 10.1055/s-0031-1300165. [DOI] [PubMed] [Google Scholar]
- 54.Pallanza R, Arioli V, Furesz S, Bolzoni G. Rifampicin: a new rifamycin. II. Laboratory studies on the antituberculous activity and preliminary clinical observations. Arzneimittelforschung. 1967;17:529–34. [PubMed] [Google Scholar]
- 55.Venturini AP. Pharmacokinetics of L/105, a new rifamycin, in rats and dogs, after oral administration. Chemotherapy. 1983;29:1–3. doi: 10.1159/000238165. [DOI] [PubMed] [Google Scholar]
- 56.Agrawal S, Panchagnula R. Implication of biopharmaceutics and pharmacokinetics of rifampicin in variable bioavailability from solid oral dosage forms. Biopharm Drug Dispos. 2005;26:321–34. doi: 10.1002/bdd.464. [DOI] [PubMed] [Google Scholar]
- 57.Finkel JM, Pittillo RF, Mellett LB. Fluorometric and microbiological assays for rifampicin and the determination of serum levels in the dog. Chemotherapy. 1971;16:380–8. doi: 10.1159/000220752. [DOI] [PubMed] [Google Scholar]
- 58.Stetter MD, Peloquin CA. Isoniazid and rifampin serum levels in a Colobus monkey (Colobus guereza caudatus) infected with Mycobacterium bovis. J Zoo Wildlife Med. 1995;26:152–4. [Google Scholar]
- 59.Ohtsuka T, Yoshikawa T, Kozakai K, Tsuneto Y, Uno Y, Utoh M, et al. Alprazolam as an in vivo probe for studying induction of CYP3A in cynomolgus monkeys. Drug Metab Dispos. 2010;38:1806–13. doi: 10.1124/dmd.110.032656. [DOI] [PubMed] [Google Scholar]
- 60.Henwood SQ, de Villiers MM, Liebenberg W, Lotter AP. Solubility and dissolution properties of generic rifampicin raw materials. Drug Dev Ind Pharm. 2000;26:403–8. doi: 10.1081/DDC-100101246. [DOI] [PubMed] [Google Scholar]
- 61.Agrawal S, Ashokraj Y, Bharatam PV, Pillai O, Panchagnula R. Solid-state characterization of rifampicin samples and its biopharmaceutic relevance. Eur J Pharm Sci. 2004;22:127–44. doi: 10.1016/j.ejps.2004.02.011. [DOI] [PubMed] [Google Scholar]
- 62.Katzung BG. Basic & clinical pharmacology. 9. New York: Lange Medical Books/McGraw Hill; 2004. [Google Scholar]
- 63.CDC. Clinical growth charts. Atlanta: Centers for Disease Control and Prevention, National Center for Health Statistics; 2009. http://www.cdc.gov/growthcharts/clinical_charts.htm. Accessed 31 Aug 2012.
- 64.Acocella G, Buniva G, Flauto U, Nicolis FB. Absorption and elimination of the antibiotic rifampicin in newborns and children. Proc. 6th Int Congress Chemother. 1969;2:755–60.
- 65.Koup JR, Williams-Warren J, Viswanathan CT, Weber A, Smith AL. Pharmacokinetics of rifampin in children. II. Oral bioavailability. Ther Drug Monit. 1986;8:17–22. doi: 10.1097/00007691-198603000-00004. [DOI] [PubMed] [Google Scholar]
- 66.Schaaf HS, Parkin DP, Seifart HI, Werely CJ, Hesseling PB, van Helden PD, et al. Isoniazid pharmacokinetics in children treated for respiratory tuberculosis. Arch Dis Child. 2005;90:614–8. doi: 10.1136/adc.2004.052175. [DOI] [PMC free article] [PubMed] [Google Scholar]
- 67.Ramachandran G, Kumar AK, Swaminathan S. Pharmacokinetics of anti-tuberculosis drugs in children. Indian J Pediatr. 2011;78:435–42. doi: 10.1007/s12098-010-0304-x. [DOI] [PubMed] [Google Scholar]
- 68.Tan TQ, Mason EO, Ou CN, Kaplan SL. Use of intravenous rifampin in neonates with persistent staphylococcal bacteremia. Antimicrob Agents Chemother. 1993;37:2401–6. doi: 10.1128/AAC.37.11.2401. [DOI] [PMC free article] [PubMed] [Google Scholar]
- 69.Chik Z, Basu RC, Pendek R, Lee TC, Mohamed Z. A bioequivalence comparison of two formulations of rifampicin (300- vs 150-mg capsules): An open-label, randomized, two-treatment, two-way crossover study in healthy volunteers. Clin Ther. 2010;32:1822–31. doi: 10.1016/j.clinthera.2010.09.006. [DOI] [PubMed] [Google Scholar]
- 70.Cohn HD. Clinical studies with a new rifamycin derivative. J Clin Pharmacol J New Drugs. 1969;9:118–25. [PubMed] [Google Scholar]
- 71.Lave T, Luttringer O, Poulin P, Parrott N. Interspecies scaling. In: Krishna R, editor. Applications of pharmacokinetic principles in drug development. New York: Kluwer Academic/Plenum; 2004. pp. 133–69. [Google Scholar]
- 72.Webster J, Bollen P, Grimm H, Jennings M. Ethical implications of using the minipig in regulatory toxicology studies. J Pharmacol Toxicol Methods. 2010;62:160–6. doi: 10.1016/j.vascn.2010.05.002. [DOI] [PubMed] [Google Scholar]