Abstract
Tumor growth profiles were simulated for 2 years using the Wang and Claret models under a phase 3 clinical trial design. Profiles were censored when tumor size increased >20% from nadir similar to clinical practice. The percent of patients censored varied from 0% (perfect case) to 100% (real-life case). The model used to generate the data was then fit to the censored data using FOCE in NONMEM. The percent bias in the estimated model parameters determined with censored data was compared to the true values. A total of 100 simulation replicates was used. For the Wang model, under clinical conditions (100% censoring), the parameter related to tumor reduction SR was underpredicted by 30% and the parameter related to tumor growth PR was underpredicted by ∼45%. Most of the variance components in the model were within ±20% of the true values. However, biased parameter estimates in the Wang model did not translate to biased tumor size predictions as the mean percent prediction error between true and model predicted tumor size never exceeded 10%. For the Claret model, at 100% censoring, the tumor growth parameter KL was unaffected by censoring. Both tumor shrinkage parameters, KD and λ, were overestimated by ∼20% in both cases. Future research needs to be directed to develop less empirically based models and to use simulation as a way to improve clinical oncology trials designs.
KEY WORDS: Claret model, growth model, Monte Carlo simulation, NONMEM, Wang model
INTRODUCTION
In studies with oncology drugs, efficacy is most often reported as a response rate that is defined using criteria (or some modification thereof) set forth by a collaboration between the USA, European Union, and Canada, the Response Evaluation Criteria in Solid Tumors (RECIST, (1)). RECIST standardizes the definition for what defines a complete response, partial response, stable disease, or progressive disease and allows for comparison between different clinical trials. Criteria for response are based on measurable disease as evidenced by tumor size. For instance, a complete response (CR) is defined as disappearance of all target lesions. A partial response (PR) is defined as at least a 30% reduction in tumor size from baseline. Progressive disease is defined as a 20% increase in tumor size from the nadir tumor size (which can also be the baseline) since the start of therapy or by the appearance of new lesions. Hence, in oncology clinical trials, tumor size is measured prior to therapy to obtain a baseline and is repeatedly measured over the course of the trial, usually every 4 to 8 weeks, after initiation of therapy. A patient is usually followed on-therapy for some length of time or until progressive disease occurs, at which time the patient is removed from the study or crossed over to other therapies and/or palliative care.
A problem with using RECIST criteria is that what is a longitudinal continuous variable, tumor size, is collapsed into a categorical endpoint: CR, PR, etc., which is known to be an inefficient use of data, can result in loss of information, and is not as powerful as when the data are treated as continuous (2). Therefore, interest has been expressed in the modeling of tumor growth kinetics in order to maximize the efficient use of information collected during a clinical trial. Wang et al. (3) modeled tumor growth in patients with non-small cell lung cancer treated with different treatment regimens and related the predicted reduction in tumor size at Week 8 after therapy to overall survival. Their model was one of exponential decline and linear growth
 |
1 |
Where Y was tumor size, BASE was the baseline tumor size, SR is the rate constant for tumor reduction, t is time, and PR was the linear rate of growth. Bonate and Suttle (submitted) used a modified Wang model that included a quadratic growth term to model the tumor size kinetics in renal cell carcinoma patients treated with either pazopanib or placebo. Claret et al. (4) modeled tumor size in patients with colorectal cancer treated with either capecitabine or flurouracil and related change in tumor size at 7 weeks after therapy to overall survival. Their model was similar to Wang’s model
 |
2 |
Where KL was the rate of tumor growth, KD was the rate of tumor shrinkage, exp(-λt) exponentially decreases the rate of tumor shrinkage over time at rate λ, and Exposure was drug dose.
In early drug oncology drug development, various models were examined and used to model tumor xenograft data in nude mice implanted with human tumors (5–9). Such analyses used models like the Gompertz, Logistic, Bertalanffy models
 |
3 |
All the models in Eq. (3) can be viewed as competition between growth and reduction. While the models presented in Eq. 1, 2, and (3) appear to be separate and distinct, i.e., non-nested, in fact they are all members of a generalized two-parameter growth family (10)
 |
4 |
where different values of a, α, b, and β lead to different models (Fig. 1). Close examination of Eq. (4) shows that the Wang and Claret models are considered modifications of the two-parameter growth model and should behave similarly.
Fig. 1.
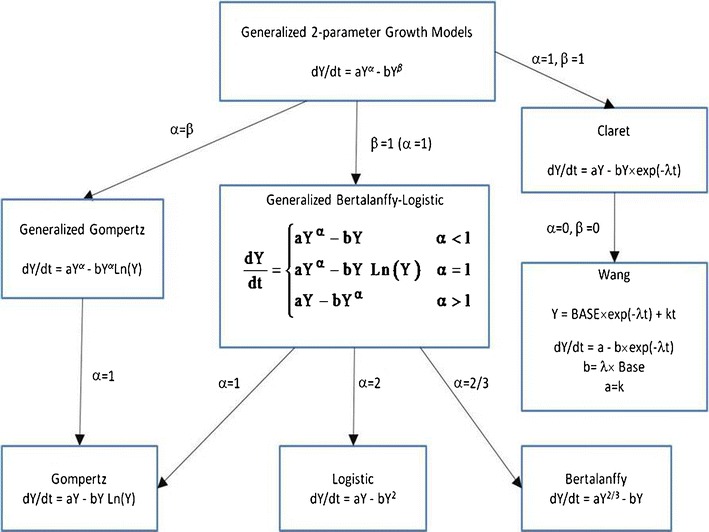
Relationship between tumor growth models to the two-parameter growth equation. Modified from Marusic (10)
It might be suspected that efficient estimation of all parameters in the model will require tumor measurements during both that part of the profile where the tumor is shrinking and that part of the profile where tumor growth/regrowth is occurring. In preclinical studies this requirement is not a problem since tumor growth can be assessed repeatedly while the tumor grows. In humans, however, it is not ethical to allow tumor growth to continue unabated. When a patient shows signs of persistent tumor growth, i.e., drug resistance, the patient is removed from treatment and put onto another therapy or palliative care. Typically, patients are removed from therapy when evidence of progressive disease is present under RECIST criteria, i.e., when tumor size increases 20% from nadir or new metastases occur. Such censoring from cessation of therapy can result in tumor size profiles that do not have sufficient data during the growth part of the curve to efficiently estimate the growth-related model parameters, a and α in Eq. (4). The purpose of this analysis was to examine the effect of varying degree of censoring on the ability to recover tumor size kinetic model parameters accurately.
METHODS
Tumor size was simulated under the Wang model given in Eq. (1). All model equations were explicitly defined in that publication and implemented herein. All nine treatment regimens studied by Wang et al. and whose model parameters were presented in Table 2 of that publication were simulated a total of 100 times using Monte Carlo methods. In each simulation, a total of 300 virtual subjects were generated (to mimic the approximately sample size of a phase 3 trial). Simulated tumor size was assessed every 6 weeks for a period of 2 years. From these complete profiles, the time to treatment cessation (time to censoring) was calculated as the time point where tumor size increased more than 20% on two occasions compared to their nadir assessment. In clinical practice, a single occasion may be used to declare disease progression, but in these simulations two occasions were used to ensure that the increase in tumor size on the first occasion was not an artifact. The occurrence of new metastases or death was ignored in these simulations. From these simulated profiles, a dataset was generated that consisted of a mixture of full profiles and profiles that were incomplete due to disease progression. The percent of subjects with censoring due to disease progression ranged from 0% to 100%. The 0% case represents the best case possible, although a physical impossibility. The 100% case represents the most realistic situation for early oncology clinical trials where all subjects eventually experience tumor progression. For those subjects deemed to be in the censored group, all observations after the time to censoring were deleted from the dataset. Figure 2 illustrates the profiles for 30 subjects where the percent of censored data in the mixture ranged from 0% to 100%. The model used to simulate the data was then used to fit the dataset containing complete and censored profiles and the relative error of the model parameter estimates from the true value was calculated. The results were summarized using box and whisker plots.
Fig. 2.
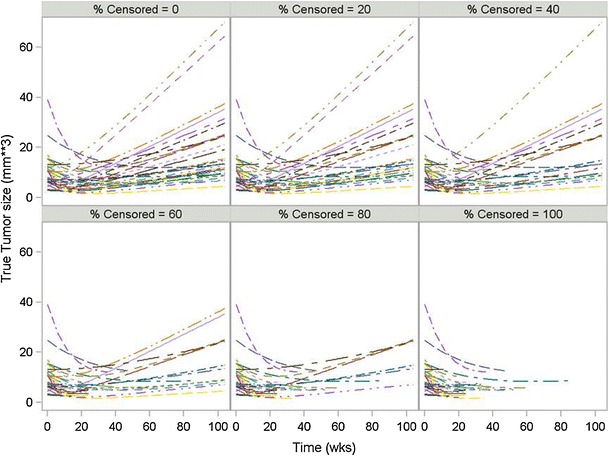
Simulated tumor size without measurement error for 30 subjects under different percent censoring using the Wang Model with the docetaxel/cispatin dataset
All simulations and data analyses were conducted in SAS, version 9.2 (SAS Institute, Cary, NC) and all model estimation was conducted in NONMEM, version 7.2 (ICON Development Solutions, Elliot City, MD) using first-order conditional estimation (FOCE) after log–log transformation. Two modifications of docetaxel/cisplatin simulation were done. First, instead of using FOCE, the SAEM algorithm with mu-modeling was used to examine the effect of the estimation algorithm on parameter bias. Second, where instead of sampling every 6 weeks as might be typically done in a clinical trial, an idealized sampling time of 1 week was explored to see if model bias could be reduced with more frequent sampling.
The same methodology was applied to the Claret et al. model using the capecitabine phase 2 model having a dose of 1,255 mg/m2/day and using the model parameters reported in Table 1. A modification of the Claret simulation was done where instead of sampling every 6 weeks, sampling times of 4 and 8 weeks were explored to see what impact these sampling times had on parameter bias.
RESULTS
Figure 3 presents a box and whisker plot of relative error between the fitted model parameters and true values as a function of percent censored for the Wang model using the docetaxel/cisplatin combination data. When no censoring was present, the parameter estimates were unbiased being just within a few percent of true values. But as the percent of censoring increased only BASE remain unbiased. Both SR and PR were underpredicted as the percent of censoring increased. At 100% censoring, which represents actual clinical practice, SR was underpredicted by 30% and PR was underpredicted by ∼45%. The between-subject variability (BSV) related to BASE was unaffected by censoring. SR BSV was affected by censoring at 100% censoring, but was still <20% from the true value and not biased to any significant extent. BSV for PR was underpredicted as censoring increased and was close to 40% bias at 100% censoring. To understand how the bias in the parameter estimates under the Wang model affected the estimates of tumor growth, the percent prediction error between true and model predicted tumor size was calculated at every time point and averaged within a simulation replication. The results from 100 simulations are shown in Fig. 4. The mean relative error never exceeded more than 10%, which is the upper bound for the measurement error of tumor assessments (11,12). With 100% dropout, some of the simulation replications exceeded 10% error, but only at later time points of a year of more.
Fig. 3.
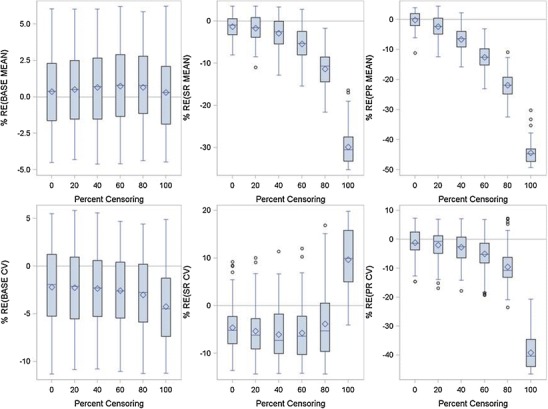
Relative error between true and FOCE model fitted parameters for the Wang Model as a function of percent censoring using the docetaxel/cisplatin combination data
Fig. 4.
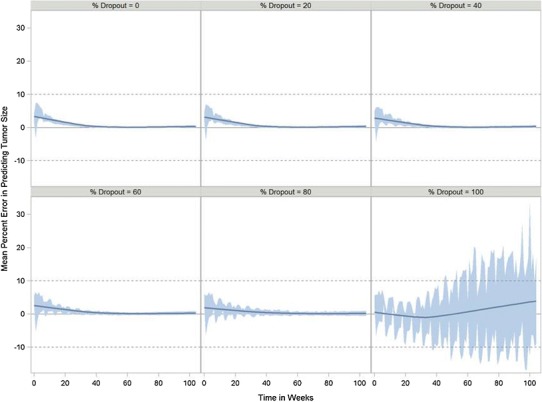
Percent error in predicting tumor size over time as a function of percent dropout for the Wang model using the docetaxel/cisplatin combination data. Band represents the 5th and 95th percentiles. Solid line is the smoothed (LOESS fit) mean error using a smoothing parameter of 0.6
Figure 5 presents the results for the paclitaxel/carboplatin data. The same conclusions were drawn from this analysis as with the docetaxel/cisplatin dataset. The results were the same for all nine datasets:
The BASE parameter was generally unaffected by the degree of censoring;
Both SR and PR were underpredicted as the degree of censoring increased;
BASE and SR BSV were unaffected by the degree of censoring, but PR BSV was significantly underpredicted.
Fig. 5.
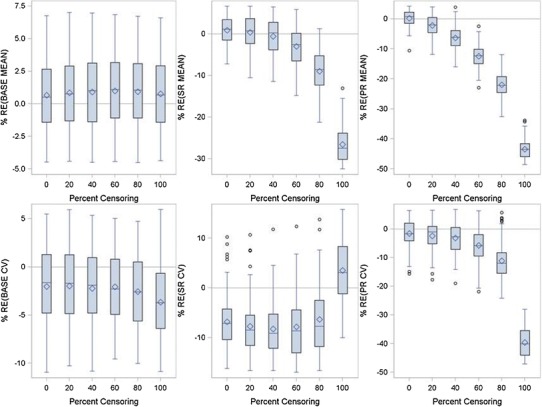
Relative error between true and FOCE model fitted parameters for the Wang Model as a function of percent censoring using the paclitaxel/carboplatin combination data
In the simulations just presented, model parameters were estimated with first-order conditional estimation within NONMEM version 7.2. To determine whether the estimation algorithm could have influenced the results, the docetaxel/cisplatin analysis was repeated using the stochastic approximation expectation–maximization (SAEM) algorithm within NONMEM. All parameters were mu-modeled where appropriate with NONMEM defaults used for burn-in. The SAEM numerically approximates the likelihood using stochastic approximation compared to the FOCE algorithm which linearizes the model to approximate the likelihood. Figure 6 presents the results using the SAEM algorithm. No difference between the simulations was noted and it was concluded that estimation algorithm had no effect on the analysis conclusions. The second modification of the simulation was to explore the effect of sampling times on parameter bias. Instead of sampling every 6 weeks, an idealized sampling time of 1 week was chosen. Changing to the more frequent sampling had no to little effect on parameter bias (data not shown) indicating that the bias in the parameter estimates was due to censoring and not due to sampling.
Fig. 6.
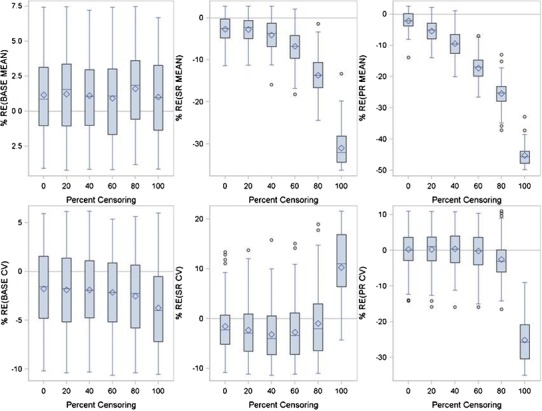
Relative error between true and SAEM model fitted parameters for the Wang Model as a function of percent censoring using the docetaxel/cisplatin combination data
Figure 7 presents the results of the analysis of the Claret model using the capecitabine data. Censoring had no effect on estimation of parameters related to the baseline tumor size. Mean KL was underestimated as censoring increased but never exceeded ±20% from the true value. Mean KD was consistently overestimated and only at 100% censoring did the bias start to exceed +20% from true value. Mean λ values were overestimated as censoring increased but did not exceed +20% from true values until 100% censoring. BASE BSV was precisely estimated regardless of censoring. KL and KD BSV were slightly biased and somewhat affected by censoring but no significant estimation bias was observed at 100% censoring. BSV for λ was affected by censoring, but surprisingly bias decreased as the percent of censoring increased and was unbiased at 100% censoring.
Fig. 7.
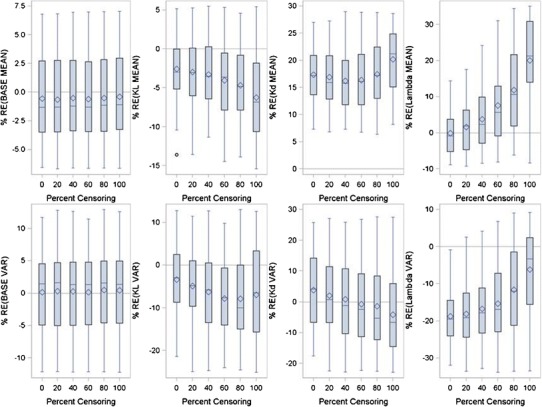
Relative error between true and FOCE model fitted parameters for the Claret Model as a function of percent censoring using the capecitabine data
As a secondary simulation to understand the effect of scan measurement time on parameter estimation, the Claret simulation was modified. The original simulation assumed that tumor measurements were made every 6 weeks. In the secondary simulation, tumor measurements were made either every 4 or 8 weeks. Changing the tumor measurement time by ±2 weeks had no effect on parameter estimation when compared to the results of the original simulation (data not shown).
DISCUSSION
The results of these simulations show that current models for tumor kinetics in clinical studies may result in biased parameter estimates when compared to true values. Baseline estimation appears to be unaffected by censoring as would be expected since censoring only occurs after the baseline measurements are collected at the start of the clinical trial. After patients are removed from the trial, either from the presence of new lesions, tumor regrowth, or drug resistance, censoring occurs and the information related to tumor growth is not present. It was expected that tumor growth-related parameters, PR in the Wang model and KL in the Claret model, in the presence of such censoring would be difficult to estimate. But this was not exactly the case. In the Wang model, parameters related to both tumor growth and tumor regression were affected by censoring; mean SR, mean PR, and PR BSV were all significantly underpredicted. Hence, parameters related to tumor growth, PR and PR BSV, were underpredicted but so was the parameter related to tumor shrinkage SR. In the Claret model, the parameters related to tumor shrinkage KD and λ were biased and overestimated. The mean parameter related to tumor growth KL was unaffected by censoring, as were the variance components. It is difficult to reconcile these differences. In the case of the Wang model, it would appear that the bias in the tumor shrinkage parameters were compensating for the bias in the tumor growth parameters, but in the Claret model this was not the case as only tumor shrinkage parameters were affected by censoring.
In terms of parameter estimation performance, the Claret model seemed to perform “better” than the Wang model. Less bias in the parameter estimates was noted with the Claret model, which may have been due to the Claret model being exposure driven, whereas the Wang model is not, and that the Claret model has an additional estimable parameter than the Wang model. The Wang model has time as its sole predictor variable whereas the Claret model uses drug exposure and time. The use of exposure in the Claret model raises some interesting questions. In the simulation, it was assumed that dose was a constant. In clinical practice, a patient rarely remains on a single constant dose throughout therapy. If a patient is not completely removed from treatment after the occurrence of a dose-limiting adverse event, doses are either decreased or interrupted while waiting for the adverse event to resolve. Doses are then resumed at either the same dose level or, more frequently, at a lower dose in the hope of avoiding the recurrence of the adverse event. The Claret model requires that the entire dosing history of the subject be known. How these dose holidays or dose changes are to be incorporated in the model and their effect on the model parameters is unclear. KD and λ are dependent on dose. Smaller doses should cause a slower rate of tumor regression and a slower rate of tumor resistance. Changes in dose should affect KD and λ but there is no way to explicitly account for dose changes as the model is currently formulated unless dose is used as a covariate on KD and λ. Even then, with a change in dose, the effect on KD and λ will not be instantaneous but will change slowly over time. Further research needs to be done with the Claret model in the presence of dose changes.
Surprisingly, even though the Wang model showed bias in the parameter estimates, this parameter bias did not translate to prediction bias in tumor size as the measurement error was within the expected bounds for tumor size assessment. It follows then that if there was no bias in tumor size predictions at early time points, one would not expect any degree of bias in prediction of overall survival. Hence, the bias in the parameter estimates for the Wang model appears to be of little clinical consequence.
That there were similarities in the results of the Wang and Claret simulations should not be unexpected since they are both members of the general class of two-parameter growth model as shown in Fig. 1. These results are an outcome of the inability to collect data during the tumor regrowth period after tumor shrinkage reaches its nadir and not the result of numerical estimation limitations since similar results were obtained regardless of whether FOCE or SAEM was the estimation algorithm used by NONMEM. The inherent parameter bias of these models does not seem to be improved by more frequent collection of tumor measurements since changing the sampling time to every week had little to no effect on the parameter estimates. Nor is it likely that improved estimation algorithms akin to time to event models with censored data will be useful since those models are predicated on a limited degree of censoring. In this case, everyone is either censored after regrowth starts to occur or the drug shows a complete response in which case there is no data upon which to estimate regrowth parameters. Perhaps one solution is to look to develop other models that are less sensitive to censoring. Today’s models are largely empirical in nature. One can envision in the future tumor growth models that are physiological in nature incorporating tumor anatomy, physiology, and biochemistry. Perhaps these models will be less sensitive to censoring because they are less reliant on clinical data.
The original Wang and Claret models were developed to estimate short term tumor regression and use this as a predictor for long-term clinical outcome, i.e., survival. These models (tumor growth-survival) do not have to be linked to be useful. Indeed, only phase 3 studies have survival as an outcome. Many cancer drugs are approved on an accelerated approval basis, which do not require survival data as part of the dossier. Tumor growth models are useful in and of themselves because they can be used identify covariates that may be predictive of tumor regression and could be used to prescreen for those patients likely to benefit from the drug in clinical trials.
One limitation of the current human tumor growth models is that in the prediction of progressive disease they fail to account for the appearance of new tumors. More realistic models of tumor growth should consider a hurdle type model linked to a two-parameter growth model wherein a probability of developing new lesions via a logistic regression-type model is modeled and if the hurdle is not passed tumor growth is still maintained. If the hurdle is passed, a new lesion has developed, progressive disease has occurred, and the patient is taken “off-study”. The models also fail to account for discontinuation due to adverse events or death without progression. These events could also be modeled by a hurdle model, where the hurdle is now a composite endpoint of any number of events that could cause study termination, linked to a growth model. These limitations do not invalidate the results of these simulations since the simulations were designed to test the underlying growth model and not represent the clinical situation.
In summary, results of tumor growth models should be interpreted with caution because of the potential bias in their parameter estimates. Both growth and shrinkage related parameters can be affected by censoring when clinical trials follow RECIST guidelines and take patients off therapy when their tumors start to show regrowth after nadir or develop new lesions. Future research needs to be directed to develop less empirically based models and to use simulation as a way to improve clinical oncology trials designs.
References
- 1.Eisenhauer EA, Therasse P, Bogaerts J, Schwartz LH, Sargent D, Ford R, Dancey J, Arbuck S, Gwyther S, Mooney M, Rubinstein L, Shankar L, Dodd L, Kaplan R, Lacombe D, Verweij J. New response evaluation criteria in solid tumours: revised RECIST guideline (version 1.1) European Journal of Cancer. 2009;45:228–247. doi: 10.1016/j.ejca.2008.10.026. [DOI] [PubMed] [Google Scholar]
- 2.Bonate L. Modeling tumor growth in oncology. In: Bonate PL, Howard DR, editors. Pharmacokinetics in drug development: advances and applications. New York: Springer; 2011. pp. 1–19. [Google Scholar]
- 3.Wang Y, Sung C, Dartois C, Ramchandani R, Booth BP, Rock E, Gobburu J. Elucidation of relationship between tumor size and survival in non-small-cell lung cancer patients can aid early decision making in clinical drug development. Clinical Pharmacology and Therapeutics. 2009;86:167–174. doi: 10.1038/clpt.2009.64. [DOI] [PubMed] [Google Scholar]
- 4.Claret L, Girard P, Hoff PM, Van Custem E, Zuideveld KP, Jorga K, Fagerberg J, Bruno R. Model-based prediction of phase III overall survival in colorectal cancer on the basis of phase II tumor dynamics. Journal of Clinical Oncology. 2009;27:4103–4108. doi: 10.1200/JCO.2008.21.0807. [DOI] [PubMed] [Google Scholar]
- 5.Ferrante L, Bompadre L, Possati L, Leone L. Parameter estimation in a Gompertzian stochastic model for tumor growth. Biometrics. 2000;56:1076–1081. doi: 10.1111/j.0006-341X.2000.01076.x. [DOI] [PubMed] [Google Scholar]
- 6.Laird AK. Dynamics of tumor growth. British Journal of Cancer. 1964;18:490–502. doi: 10.1038/bjc.1964.55. [DOI] [PMC free article] [PubMed] [Google Scholar]
- 7.Norton L. A Gompertzian model of the human breast cancer growth. Cancer Research. 1988;48:7067–7081. [PubMed] [Google Scholar]
- 8.Rygaard K, Spang-Thomsen M. Quantitation and Gompertzian analysis of tumor growth. Breast Cancer Research Treatment. 1997;46:303–312. doi: 10.1023/A:1005906900231. [DOI] [PubMed] [Google Scholar]
- 9.Xu X. The biological foundation of the Gompertz Model. International Journal of Biomedical Computing. 1987;20:35–39. doi: 10.1016/0020-7101(87)90012-2. [DOI] [PubMed] [Google Scholar]
- 10.Marusic M. Mathematical models of tumor growth. Lecture presented at the Mathematical Colloquium in Osijek organized by the Croatian Mathematical Society. 1995. http://hrcak.srce.hr/file/2874. Accessed 18 Apr 2013.
- 11.Oxnard GR, Zhao B, Sima CS, Ginsberg MS, James LP, Lefkowitz RA, Guo P, Kris MG, Schwartz LH, Riely GJ. Variability in lung tumor measurements on repeat computed tomography scans taken within 15 min. Journal of Clinical Oncology. 2011;23:3114–3119. doi: 10.1200/JCO.2010.33.7071. [DOI] [PMC free article] [PubMed] [Google Scholar]
- 12.Erasmus JJ, Gladish GW, Broemeling L, Sabloff BS, Truong MT, Herbst RS, Munden RF. Interobserver and intraobserver variability in measurement of non-small cell carcinoma lung lesions: implications for assessment of tumor response. Journal of Clinical Oncology. 2003;21:2574–2582. doi: 10.1200/JCO.2003.01.144. [DOI] [PubMed] [Google Scholar]


