

Abstract
Self-emulsifying drug delivery systems (SEDDS) have been broadly used to promote the oral absorption of poorly water-soluble drugs. The purpose of the current study was to evaluate the in vivo oral bioavailability of vitamin E isoforms, δ-tocotrienol (δ-T3) and γ-tocotrienol (γ-T3) administered as SEDDS, as compared to commercially available UNIQUE E® Tocotrienols capsules. Results from studies in rats showed that low dose treatment with δ-T3 (90%) and γ-T3 (10%) formulated SEDDS showed bioavailability of 31.5% and 332%, respectively. However, bioavailability showed a progressive decrease with increased treatment dose that displayed nonlinear absorption kinetics. Additional in vitro studies examining cellular uptake studies in Caco 2 cells revealed that the SEDDS formulation increased passive permeability of δ-T3 and γ-T3 by threefold as compared to the commercial capsule formulation. These studies also showed that free surfactants decreased δ-T3 and γ-T3 absorption. Specifically, combined treatment cremophor EL or labrasol with tocotrienols caused a 60–85% reduction in the cellular uptake of δ-T3 and γ-T3 and these effects appear to result from surfactant-induced inhibition of the δ-T3 and γ-T3 transport protein Niemann–Pick C1-like 1 (NPC1L1). In summary, results showed that SEDDS formulation significantly increases the absorption and bioavailability δ-T3 and γ-T3. However, this effect is self-limiting because treatment with increasing doses of SEDDS appears to be associated with a corresponding increase in free surfactants levels that directly and negatively impact tocotrienol transport protein function and results in nonlinear absorption kinetics and a progressive decrease in δ-T3 and γ-T3 absorption and bioavailability.
Electronic supplementary material
The online version of this article (doi:10.1208/s12248-013-9481-7) contains supplementary material, which is available to authorized users.
KEY WORDS: cremophor EL, labrasol, NPC1L1, SEDDS, tocotrienols
INTRODUCTION
A large portion of newly discovered drugs are lipophilic in nature. As a result, these drugs often display poor solubility, limited absorption and low bioavailability. Several approaches have been used to improve the oral bioavailability of many lipophilic drugs including lipid-based formulations (1–3). This approach enhances oral bioavailability through several well established mechanisms. First, co-administration of lipids causes a delay in the rate of gastric emptying and enhances drug solubility by stimulating the secretion of endogenous compounds such as bile salts and phospholipids into the gastrointestinal (GI) tract (4,5). Second, lipid-based formulations increase the incorporation of these drugs into lipoproteins, which facilitate more lymphatic absorption (6–8) and thereby bypassing hepatic portal system metabolism (9–11).
Self-emulsifying drug delivery systems (SEDDS) is an example of a lipid-based formulation strategy that has been successfully used to increase bioavailability of lipophilic drugs with poor aqueous solubility (4,7,12–15). SEDDS are composed of oils (synthetic or natural), surfactants, and co-solvents (4,16,17) and upon exposure to GI fluids and mild agitation, will form oil-in-water (o/w) emulsions with droplet size ranging from 100 to 300 nm (18,19). These small droplets provide a very large surface area that allows for more solubilization and partitioning (20), and ultimately results in a significant improvement in oral absorption and bioavailability of lipophilic drugs. Selection of SEDDS formulation components is governed by criteria that include: chemical stability, purity, drug compatibility, solvent capacity, digestibility, and miscibility (21). Furthermore, amounts and proportions of these components are critical for SEDDS formulations stability and performance. Lipid composition and/or amount of surfactants may inversely affect the drug solubilization and in vivo performance (15,22).
Tocotrienols are members of the vitamin E family of compounds that display a wide range of health benefits including neuroprotective, anticancer, antiplatelet, and cholesterol lowering activity (23,24). Numerous studies have demonstrated that the γ- and δ-tocotrienol (γ-T3 and δ-T3, respectively) isoforms display the most potent anticancer activity, with δ-T3 being slightly more effective than γ-T3 against breast, lung, leukemic, pancreatic, melanoma, and colorectal types of cancers (25–30). In addition, combined treatment of δ-T3 and γ-T3 has been shown to inhibit osteoclast activity and lower circulating cholesterol levels (25,31,32). Taken together, these findings strongly suggest that tocotrienols may provide significant benefit in the prevention and treatment of various diseases when used alone or as adjuvant therapy (33–35). However, δ-T3 and γ-T3 are lipophilic compounds that are practically insoluble in water, and display high solubility in organic solvents (about 10 mg/ml) (CAS registry numbers 14101-61-2 and 25612-59-3). Due to their poor aqueous solubility, both tocotrienols have limited absorption and low bioavailability (36,37). In humans, although the absolute bioavailability was not determined, γ-T3 relative bioavailability increased 3.5-fold when administered with food (38), whereas in rats, δ-T3 and γ-T3 oral bioavailability has been found to be as low as 8.5% and 9%, respectively (36,37). The structures of δ-T3 and γ-T3 are shown in Fig. 1.
Fig. 1.
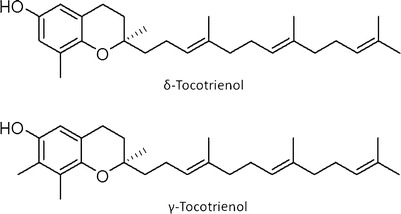
Structures of δ-tocotrienol (δ-T3) and γ-tocotrienol (γ-T3)
In addition to their poor solubility, γ-T3 has been reported as a substrate for the carrier-mediated transport protein Niemann–Pick C1-like 1 (NPC1L1), which becomes saturated in the presence of high γ-T3 concentrations, thus limiting its oral bioavailability and prompting nonlinear absorption kinetics (37). Therefore, the following studies were conducted to: (1) determine if SEDDS formulation of a mixture of δ-T3 (90%) and γ-T3 (10%) improves intestinal absorption and bioavailability in rats as compared with a commercially available dietary supplement containing the same portions of δ-T3 and γ-T3; (2) determine the effects of SEDDS formulation on specific cellular uptake mechanisms of δ-T3 and γ-T3, including carrier-mediated, passive and endocytosis; and (3) examine the interaction of SEDDS excipients with NPC1L1 to explain the nonlinear absorption kinetics observed in vivo.
MATERIALS AND METHODS
Materials
The δ-T3 and γ-T3 was generously provided by Dr. Barry Tan, American River Nutrition, Inc. (MA, USA) as a mixture of 90% and 10%, respectively. The commercially available δ-T3 and γ-T3 soft gel capsules product (UNIQUE E® Tocotrienols) was obtained from the A.C. Grace Company (Big Sandy, TX). Ezetimibe was kindly donated by Schering-Plough Corporation (NJ, USA). δ-tocopherol and chlorpromazine were obtained from Sigma (St. Louis, MO). Sodium taurocholate and phosphatidylcholine were purchased from Avanti Polar Lipids, Inc. (Alabaster, AL). Polyoxyethylated castor oil (Cremophor® EL), triglycerides of caprylic/capric acid (Captex® 355), and C8/C10 polyglycolyzed glycerides from coconut oil (Labrasol®) were provided by BASF (Mount Olive, NJ, USA), Abitec Corporation (Janesville, WI, USA), and Gattefossé (Saint-Priest, Cedex, France), respectively. Ethyl alcohol USP was purchased from AAPER Alcohol and Chemical Co. (Shelbyville, KY, USA). Supplies for cell culture were obtained from American Type Cell Culture Collection (ATCC; Manassas, VA) and Life Technologies (Grand Island, NY). Other chemicals and reagents were obtained from VWR Scientific (West Chester, PA). All chemicals were used as supplied without further modifications.
Animals
Male Sprague–Dawley rats weighing 250–400 g were acquired from Harlan Laboratories (Houston, TX). All animal experiments were approved by the Institutional Animal Care and Use Committee of the University of Louisiana at Monroe, and all the surgical and treatment procedures were consistent with the Institutional Animal Care and Use Committee policies and procedures. The rats were maintained on a 12 h light/dark cycle before the study and had free access to food and water ad libitum before each experiment.
Formulation of SEDDS and Mixed Micelles (MM)
The δ-T3 and γ-T3 loaded SEDDS were prepared as previously described with minor modifications (39). Base SEDDS formulation was prepared using cremophor EL (40.7% w/w), labrasol (40.7% w/w), captex 355 (7.2% w/w), and ethanol (11.4% w/w) as the primary surfactant, co-surfactant, secondary oil, and co-solvent, respectively. The formulation was prepared by mixing the pre-weighed SEDDS ingredients in a vial at 1,000 rpm for 5 min using IKA® UltraTurrax T8 mixer (IKA® Works Inc., NC). Vials were capped and stored in controlled room temperature until used. To prepare a 35% w/w δ-T3-SEDDS, the appropriate weight of the tocotrienol was added to the base SEDDS formulation and mixed for 2 min using the same mixer until achieving a homogenous phase of all components. MM were prepared using a modification of the method previously described by Narushima et al. (40). In brief, δ-T3 and γ-T3 diluted in methanol, phosphatidylcholine dissolved in methanol, taurocholate dissolved in 96% ethanol, and oleic acid diluted in methanol were mixed, and then evaporated to dryness under nitrogen gas. A transport buffer (4 mM KCl, 141 mM NaCl, 1 mM MgSO4, 10 mM glucose, 10 mM HEPES, and 2.8 mM CaCl2 adjusted to pH 7.4) was then added to prepare the medium for cellular uptake experiments. Final concentrations were: phosphatidylcholine 150 μM, taurocholate 300 μM, oleic acid 500 μM, and the required δ-T3 and γ-T3 concentrations in each experiment. The micellar solution was thoroughly vortexed and stirred at 37°C for 30 min.
Physical Characterization of SEDDS Formulation
Intensity-weighted mean particle size, population distribution (Polydispersity Index, PI) which is a measure of homogeneity and width of the size distribution, and Zeta potential (ξ) of SEDDS were measured by photon correlation spectroscopy (PCS) at 23°C and a fixed angle of 90° using Nicomp™ 380 ZLS submicron particle size analyzer (PSS Inc., Santa Barbara, CA). Before analysis, SEDDS were reconstituted in transport buffer to obtain a final tocotrienols concentrations of 1 mg/ml for δ-T3 and 0.1 mg/ml for γ-T3. When needed, samples for size analysis were diluted further with 0.2 ml-filtered and deionized water in order to minimize multiple-particle scattering and to achieve an optimal scattering intensity of 300 KHz. The size was recorded for 3 min with viscosity and dielectric constant of the medium set to 1.33 and 78.5, respectively. The intensity-weighted mean diameter of the particles was calculated based on Stokes–Einstein law by curve fitting of the correlation function. The Zeta potential of the SEDDS was measured using the same instrument (Nicomp™380 ZLS) under zeta mode, and Zeta potential was measured using the Helmholz–Smoluchowsky equation. The stability of SEDDS formulation was also observed by measuring the particle size after 3 weeks of storage in refrigerated conditions (4–8°C) to monitor any change in particle size over the period of the experiment. Analyses were performed in triplicates unless otherwise specified.
In Vivo Pharmacokinetic Studies
All animal experiments were performed under fed conditions. For the intravenous (i.v.) administration study, 10 mg/kg of δ-T3 and 1 mg/kg of γ-T3 was emulsified as described previously with the aid of Tween 80 and labrasol in sterilized water before administration into the femoral vein of anesthetized rats by intraperitoneal injection of 1.0 g/kg urethane (41). Blood samples were withdrawn at 0, 0.084, 0.25, 0.5, 1, 2, 4, 6, 8, and 10 h. For oral administration, 0.5, 2.5, and 25 mg/kg doses of δ-T3 prepared as SEDDS or capsule were administered to the rats via oral gavage. About 45 min following the oral administration, rats were anesthetized with urethane and blood samples were collected at 1, 2, 3, 4, 6, 8, 10, and 12 h. The blood samples were withdrawn from the femoral artery. The blood samples were collected in heparinized Eppendorf tubes. The samples were then centrifuged at 13,000 rpm for 10 min. The separated plasma was stored at −20°C until analysis by HPLC. Four rats were used for the i.v. experiment and three rats/dose for the oral experiment. Plasma levels versus time profiles were plotted and fitted using a PK-Plus module in Gastroplus™ (Simulation Plus Inc., Lancaster, CA). Non-compartmental model was used to calculate the mean residence time and the systemic clearance. The area under the curve (AUC) was calculated by the trapezoidal rule method. The i.v. data were found to best fit a two-compartmental model from which the central compartment (Vc) and peripheral compartment volume of distribution (V2) were calculated.
In Vitro Studies
Cell Culture
Caco2 cells were cultured in Dulbecco’s Modified Eagle Medium supplemented with 20% fetal bovine serum (FBS) and 2.5% antibiotics (penicillin and streptomycin) in a humidified incubator with 5% CO2 at 37°C. Cells were cultured on 75 cm2 flask at a density of 1 × 10⁶ cells/flask and were then harvested at 90% confluence with trypsin–EDTA. Cells were seeded onto a 48-well plate at a density of 50,000 cells/well. When confluent, uptake studies were performed as described below. All experiments were conducted in triplicate.
Cell Uptake Studies for SEDDS, MM, and Capsule
The δ-T3 and γ-T3 loaded SEDDS, MM and capsule were diluted in transport buffer to prepare different concentrations ranging from 1 to 25 μM for δ-T3 and 0.1–2.5 μM for γ-T3. Two hundred microliters from each concentration of SEDDS, MM, and capsule were added and incubated for 45 min. At the end of the experiment, cells were washed twice with ice-cold PBS and lysed with 100 μl lysis buffer overnight at 4°C before analysis by HPLC.
NPC1L1 Inhibition Studies
To investigate the effect of formulation on the carrier-mediated uptake of δ-T3 and γ-T3 by NPC1L1, inhibition studies of NPC1L1 by ezetimibe (selective inhibitor of NPC1L1) were performed (40,42,43). After washing the cells with warm PBS, cells were pre-incubated with 50 μM ezetimibe for 30 min. Cells were then treated with 1, 5, 10, 25 μM of δ-T3 and 0.1, 0.5, 1, 2.5 μM of γ-T3 prepared as SEDDS or capsule with or without 50 μM ezetimibe for 45 min. At the end of the experiment, cells were washed twice with ice-cold PBS and lysed with 100 μl lysis buffer for overnight at 4°C before analysis by HPLC.
Passive Uptake Studies
To measure the passive uptake of SEDDS formulation and capsule, a cellular uptake experiment at 4°C was conducted. Different concentrations of δ-T3 (1, 5, 10, 25 μM) and γ-T3 (0.1, 0.5, 1, 2.5 μM) loaded SEDDS or capsule were added to the cells at 4°C or 37°C for 45 min. After the treatment period, cells were washed, lysed, and analyzed by HPLC.
Endocytosis Inhibition Studies
To study the contribution of endocytosis process to the cellular uptake of δ-T3 and γ-T3 delivered as SEDDS or capsules endocytosis inhibition studies were performed. Cells were incubated with required concentrations of δ-T3 and γ-T3 in presence and absence of chlorpromazine, a clathrin-mediated endocytosis inhibitor (44). After washing with warm PBS, cells were pre-incubated with 50 μM chlorpromazine for 30 min. Then, different concentrations of δ-T3 (1, 5, 10, 25 μM) and γ-T3 (0.1, 0.5, 1, 2.5 μM) loaded SEDDS or capsule with or without 50 μM chlorpromazine were added to the cells for 45 min. At the end of the experiment, cells were washed, lysed, and analyzed by HPLC.
Cellular Uptake Studies of MM with Cremophor EL, Labrasol, or Captex
To investigate the effect of individual SEDDS excipients on the cellular uptake of tocotrienols and their possible contribution to the in vivo nonlinear kinetics behavior of δ-T3 and γ-T3 the following experiments were performed. Cells were treated with δ-T3 and γ-T3 prepared as MM at different concentrations and exact amount of cremophor EL (1.6%, w/v), labrasol (1.6%, w/v), or captex (0.3%, w/v) for 45 min. Cremophor EL, labrasol, or captex were added at concentrations comparable to those in SEDDS. Then, the cells were washed with cold PBS and lysed with 100 μl of lysis buffer for overnight at 4°C before analysis by HPLC.
Concentration-Dependent Studies of Cremophor EL and Labrasol
To 10 μM δ-T3 and 1 μM γ-T3 prepared as MM different concentrations of cremophor EL and labrasol were added. Cremophor EL at 0.1%, 0.5%, 0.75%, 1%, w/v or labrasol at 0.01%, 0.05%, 0.1%, 0.25%, w/v with MM containing δ-T3 and γ-T3 were incubated with the cells for 45 min. At the end of the experiment, cells were washed twice with ice-cold PBS and lysed with 100 μl lysis buffer overnight at 4°C before analysis by HPLC.
HPLC Analysis of Plasma Samples and Cell Lysate
Quantification of δ-T3 and γ-T3 in the plasma samples and cell lysate was fully validated and achieved by an isocratic Prominence Shimadzu HPLC system (Columbia, MD) as described previously (37,45). The system consisted of a SIL 20-AHT autosampler, fluorescence detector (Shimadzu, RF10A XL) and a LC-20AB pump connected to a Dgu-20A3 degasser. Data acquisition was achieved by LC Solution software version 1.22 SP1. The chromatographic conditions were a XDB-C18 Column (5 μm, 150 × 4.6 mm i.d.; Agilent, CA, USA), the mobile phase consisted of methanol, ethanol, and acetonitrile (85:7.5:7.5, v/v/v) delivered at a 1.0 ml/min flow rate. The δ-T3 and γ-T3 in plasma and cell lysate were detected by fluorescence detection set at 298 nm excitation and 325 nm emission. The total run time was 7 min with retention times of 4.0 and 4.8 min for δ-T3 and γ-T3, respectively. The injection volume was 20 μl. The extraction of δ-T3 and γ-T3 from the plasma was performed as described previously (37). In brief, 50 μl plasma and 50 μl ethanol containing 1% ascorbic acid and 1 μg/ml δ-tocopherol (internal standard) were added in a glass tube and vortex mixed, followed by the addition 1.0 ml hexane. The mixture was vortexed for 90 s before centrifugation for 10 min at 5,000 rpm. Eight hundred microliters of the supernatant were then transferred to another glass tube and evaporated to dryness by a centrifugal evaporator (Centrivap concentrator, Kansas City, MO, USA) followed by reconstitution with 100 μl methanol before 20 μl injection onto the HPLC column. For the extraction of δ-T3 and γ-T3 from the cell lysate, 1:1 precipitation with acetonitrile followed by centrifugation at 13,000 rpm for 10 min was performed before injection into the HPLC.
Data Analysis
GraphPad Prism, version 6.00 (GraphPad Software, San Diego, CA, USA) was used to perform all statistical analysis. The observed maximum concentration (Cmax) and the time of peak (Tmax) were obtained directly from the individual plasma concentration versus time profiles. The AUC was calculated using the trapezoidal rule method. Vmax and KM were determined from nonlinear regression of the concentration versus cellular uptake curves by GraphPad Prism. The results were presented as mean ± SD. P values < 0.05 were considered statistically significant.
RESULTS
Characterization of SEDDS Formulation
The mean droplet size, PI, and Zeta potential values of dispersion generated by SEDDS formulation are 211 ± 14 nm, 0.5 ± 0.04, and −25 ± 3, respectively (Supplementary Table SI). In order to determine the stability of SEDDS formulation in the solution, SEDDS formulation has been dispersed in transport buffer and stored at 4°C for 3 weeks. After 3 weeks, the mean droplet size, PI, and Zeta potential values were not significantly different from the original values, and were 234 ± 5 nm, 0.35 ± 0.02, and −28 ± 3, respectively. Detailed characterization of the SEDDS formulation has been published previously (39,46).
Intravenous Pharmacokinetic Studies
The mean plasma concentrations versus time profiles of δ-T3 and γ-T3 following i.v. administration to rats are shown in Supplementary Fig. S1, and the associated pharmacokinetic parameters are presented in Table I. A two-compartment model provided the best fit of the data for both compounds. Both δ-T3 and γ-T3 exhibited bi-exponential pharmacokinetics in plasma and the apparent terminal elimination phase was well defined 3 h post-dose. The volumes of distribution of both isoforms were significantly different where in the central compartment (Vc) δ-T3 and γ-T3 values were 0.08 ± 0.01 and 0.5 ± 0.1 l/kg, respectively, while in the peripheral compartment (V2) were 0.2 ± 0.02 and 0.95 ± 0.01 l/kg, respectively. Such difference could be related to differences in their bindings to α-tocopherol transfer protein (α-TTP). Available studies indicated the affinity of δ-T3 to α-TTP is relatively higher than that of γ-T3 (47). The half-lives for δ-T3 and γ-T3 were 3.1 ± 0.3 and 2.3 ± 0.12 h, respectively, and their clearances were 0.4 ± 0.03 and 1.9 ± 0.2 l/h/kg, respectively. Differences in rate of metabolism were reported to be higher for γ-T3 than δ-T3 which may explain γ-T3 greater clearance compared to δ-T3 (48).
Table I.
Pharmacokinetic Parameters of δ-T3 and γ-T3 Following i.v. Administration of 10 mg/kg, and 1 mg/ml, Respectively (n = 4)
| Pharmacokinetic parameter | δ-T3 | γ-T3 |
|---|---|---|
| AUC, μg h/ml | 29.3 ± 2.4 | 5.7 ± 0.6 |
| MRT, h | 1.1 ± 0.3 | 1.1 ± 0.1 |
| V c, l/kg | 0.08 ± 0.01 | 0.5 ± 0.1 |
| V 2, l/kg | 0.2 ± 0.01 | 0.95 ± 0.01 |
| CL, l/h/kg | 0.4 ± 0.04 | 1.9 ± 0.2 |
| T 1/2, h | 3 ± 0.3 | 2.3 ± 0.1 |
Each value represents the mean ± SD
MRT mean residence time, V c central compartment volume of distribution, V 2 peripheral compartment volume of distribution, CL systemic clearance
Oral Bioavailability Studies
The mean plasma concentrations versus time profiles following oral administration of different doses of δ-T3 (0.5, 2.5, 25 mg/kg) and γ-T3 (0.05, 0.25, 2.5 mg/kg) as SEDDS or commercially available capsules to fed rats are shown in Supplementary Fig. S2. The oral pharmacokinetic parameters of δ-T3 following administration of both formulations are listed in Table II. Peak concentration (Cmax) and time of peak concentration (Tmax) were obtained directly from individual plasma concentration–time profile of each rat. The area under the plasma concentration–time curve from time zero to time t was calculated and the absolute bioavailability for each dose of δ-T3 and γ-T3 from SEDDS and capsule was calculated using the following equation:
 |
Table II.
Comparative Pharmacokinetic Parameters of δ-T3 Oral Absorption when Delivered as SEDDS or Capsule Following 0.5, 2.5, 25 mg/kg Oral Administration to Rats (n = 3)
| Parameter | SEDDS (mg/kg) | Capsule (mg/kg) | ||||
|---|---|---|---|---|---|---|
| 0.5 | 2.5 | 25 | 0.5 | 2.5 | 25 | |
| AUC, ng h/ml | 453 ± 66*** | 971 ± 32*** | 2234 ± 335 | 71 ± 18 | 362 ± 81 | 1968 ± 168 |
| Bioavailability | 31 ± 5.1*** | 13.3 ± 0.6*** | 3 ± 0.1 | 4.8 ± 1.2 | 4.9 ± 0.9 | 2.7 ± 0.2 |
| C max, ng/ml | 192 ± 7*** | 255 ± 27*** | 544 ± 35 | 38 ± 4 | 69 ± 6 | 460 ± 96 |
| T max, h | 2 | 2 | 2 | 2 | 2 | 2 |
Each value represents the mean ± SD
***P < 0.001; significantly enhanced levels of δ-T3 delivered in SEDDS formulation compared to capsule at 0.5 and 2.5 mg/kg doses
As illustrated in Table II, plasma concentration of δ-T3 at all doses are significantly higher for rats administered with SEDDS formulation compared to capsules (P < 0.05). The Cmax values for 0.5, 2.5, 25 mg/kg doses of δ-T3 from SEDDS were 192 ± 7, 255 ± 27, and 640 ± 33 ng/ml, respectively, compared to 38 ± 4, 69 ± 6, and 460 ± 96 ng/ml, respectively, from capsule. In addition, Table II lists corresponding AUC values from both formulations at different doses. The AUC of 0.5, and 2.5 mg/kg of δ-T3 from SEDDS were significantly higher compared to capsule (P < 0.05), whereas, the AUC of 25 mg/kg from SEDDS was higher compared to capsule but was not significant (P > 0.05). Consequently, the bioavailability of δ-T3 was significantly higher with 0.5 and 2.5 mg/kg doses administered with SEDDS, seven- and threefolds, respectively, compared to the same doses from capsule (Table II).
γ-T3 presents in both formulations in low amount (10% of total tocotrienols) and was analyzed to investigate SEDDS formulation on its bioavailability. The mean plasma concentrations versus time profiles of γ-T3 following oral administration in rats are shown in Supplementary Fig. S3, and the associated pharmacokinetic parameters are presented in Table III. There were no significant differences in Cmax and AUC values of 0.05 and 0.25 mg/kg from SEDDS and capsule. The low doses of γ-T3 showed higher bioavailability compared to 2.5 mg/kg dose from SEDDS and capsules. However, the Cmax and AUC values of 2.5 mg/kg from SEDDS were significantly higher compared to capsule (P < 0.01). These findings demonstrated that δ-T3 and γ-T3 incorporated into SEDDS have different behavior where unlike γ-T3 at low doses δ-T3 bioavailability was significantly enhanced compared to capsule. This was evident by comparing the AUC values of both isoforms at 2.5 mg/kg. At this dose, while a significant difference between SEDDS and capsule was observed with δ-T3 and γ-T3, the effect of SEDDS formulation on δ-T3 bioavailability was more obvious compared to γ-T3 (Tables II and III). Nevertheless, both isoforms delivered as SEDDS or capsules demonstrated nonlinear kinetics.
Table III.
Comparative Pharmacokinetic Parameters of γ-T3 Oral Absorption when Delivered as SEDDS or Capsule Following 0.05, 0.25, 2.5 mg/kg Oral Administration to Rats (n = 3)
| Parameter | SEDDS (mg/kg) | Capsule (mg/kg) | ||||
|---|---|---|---|---|---|---|
| 0.05 | 0.25 | 2.5 | 0.05 | 0.25 | 2.5 | |
| AUC, ng h/ml | 918 ± 129 | 353 ± 55 | 638 ± 17** | 763 ± 122 | 350 ± 38 | 453 ± 42 |
| Bioavailability | 332 ± 45 | 25 ± 4 | 4.5 ± 0.1** | 267 ± 43 | 24.5 ± 2.7 | 3.2 ± 0.3 |
| C max, ng/ml | 395 ± 38 | 60 ± 8 | 102 ± 16** | 282 ± 19 | 47 ± 3 | 71 ± 14 |
| T max, h | 2 | 2 | 2 | 2 | 2 | 2 |
Each value represents the mean ± SD
**P < 0.01, significantly enhanced levels of γ-T3 delivered in SEDDS formulation compared to capsule at 2.5 mg/kg dose
In Vitro Studies
Cell Uptake Studies of SEDDS, MM, and Capsule
Different concentrations in the ranges 1–25 μM (0.4–10 μg/ml) of δ-T3 and 0.1–2.5 μM (0.04–1 μg/ml) of γ-T3 prepared as SEDDS, MM, or capsule were incubated with Caco2 cells for 45 min based on findings from previous work (49). MM were used as they represent the end product of ingested oil in the intestinal lumen that is readily available for absorption (1,49). As illustrated in Fig. 2, the cellular uptake of δ-T3 and γ-T3 prepared as SEDDS were significantly higher compared to the same concentrations from MM or capsule (P < 0.001). Vmax and KM for δ-T3 and γ-T3 uptake from SEDDS, MM, and capsule were calculated and showed higher values with SEDDS compared to other formulations. The Vmax value for δ-T3 from SEDDS was significantly higher with 141 ± 6 ng/mg protein/45 min compared to 58 ± 3.6 and 37.6 ± 2.9 ng/mg protein/45 min from MM and capsule, respectively. The KM values for δ-T3 from SEDDS, MM, or capsule were 26.6 ± 2.5, 22.9 ± 1.7, and 9.6 ± 0.9 μM, respectively. Similarly, the Vmax value for γ-T3 from SEDDS was significantly higher with 10.9 ± 2.1 ng/mg protein/45 compared to 5.3 ± 1.2 and 3.7 ± 0.9 ng/mg protein/45 min from MM and capsule, respectively. The KM values for γ-T3 from SEDDS, MM, or capsule were 2 ± 0.3, 1.9 ± 0.2, and 1.2 ± 0.1 μM, respectively. These uptake results demonstrated that incorporation of δ-T3 and γ-T3 into SEDDS formulation significantly increased overall cellular uptake at high and low concentrations.
Fig. 2.
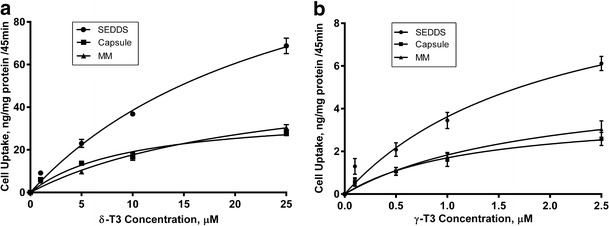
Cellular uptake (ng/mg protein/45 min) following incubation with various concentrations of a δ-T3 and b γ-T3 loaded SEDDS, MM, or capsule. Each value represents the mean ± SD from three independent experiments
NPC1L1 Inhibition Studies
In our previous work, concentration-dependent studies have been conducted with ezetimibe against γ-T3 cellular uptake and showed that 50 μM of ezetimibe has maximum NPC1L1 inhibition effect (49). Based on this finding, different concentrations ranges of δ-T3 (1–25 μM) and γ-T3 (0.1–2.5 μM) prepared as SEDDS or capsule with or without 50 μM of ezetimibe were tested and the results are shown in Fig. 3. The cellular uptake of δ-T3 and γ-T3 from SEDDS or capsule were significantly reduced in presence of ezetimibe (P < 0.05). Although, the uptake of both δ-T3 and γ-T3 from SEDDS is higher than that from capsule, there was no difference in the percent decrease (40–45%) in the uptake of δ-T3 and γ-T3 from SEDDS or capsule. These results further confirm the major role of NPC1L1 in the uptake of γ-T3 (37), and to the uptake of δ-T3. In addition, this data demonstrate the limited effect of SEDDS formulation in reducing NPC1L1 interaction with tocotrienols.
Fig. 3.
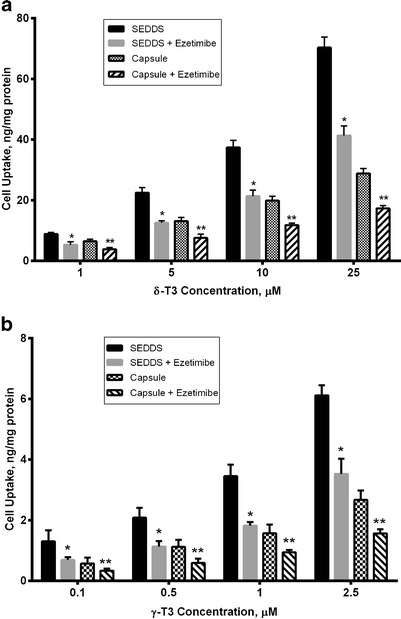
Cellular uptake (in nanogram per milligram protein) following incubation with various concentrations of a δ-T3 and b γ-T3 loaded SEDDS or capsule with or without 50 μM ezetimibe. Each value represents the mean ± SD from three independent experiments. *Indicates significantly different cellular uptake of δ-T3 and γ-T3 from SEDDS with ezetimibe compared to its absence (P < 0.05). **Indicates significantly different cellular uptake of δ-T3 and γ-T3 from capsule with ezetimibe compared to its absence (P < 0.01)
Passive Uptake Studies
To investigate the passive uptake contribution to the total cellular uptake, we conducted an uptake study at 4°C. Previous studies showed that at 4°C active carrier mediated transport and pinocytic/endocytic uptake of molecules are usually hindered (50,51). Data obtained following cells treatment with SEDDS or capsule loaded with different concentrations of δ-T3 (1–25 μM) and γ-T3 (0.1–2.5 μM) at 37°C and 4°C are presented in Fig. 4. At 4°C the cellular uptake of δ-T3 and γ-T3 loaded in SEDDS were significantly lower than their cellular uptake at 37°C with 40–50% reduction (P < 0.001). Although, the cellular uptake δ-T3 and γ-T3 from SEDDS were reduced significantly at 4°C, it is still threefolds higher than the cellular uptake of capsule at 4°C (P < 0.01). The results revealed that SEDDS formulation enhanced the passive uptake of δ-T3 and γ-T3.
Fig. 4.
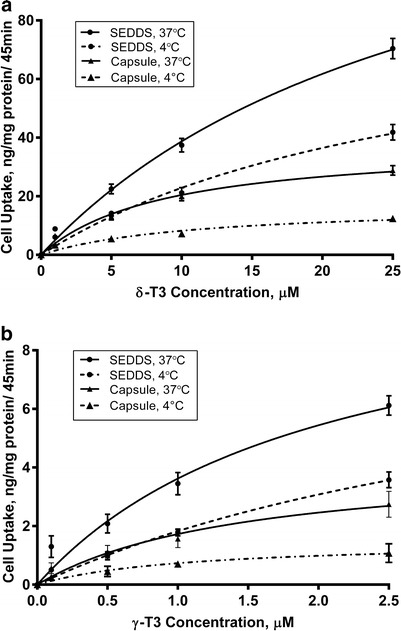
Cellular uptake (in nanogram per milligram protein) following incubation with various concentrations of a δ-T3 and b γ-T3 loaded SEDDS or capsule at 37°C and 4°C. Each value represents the mean ± SD from three independent experiments
Endocytosis Inhibition Studies
Results obtained from the endocytosis inhibition studies using chlorpromazine are presented in Fig. 5. The cellular uptake of δ-T3 and γ-T3 delivered as SEDDS or capsule were reduced in cells treated with chlorpromazine compared with those not treated (P < 0.05). The endocytosis process counted for 20–25% of δ-T3 and γ-T3 cellular uptake. However, the cellular uptake at 0.1 μM of γ-T3 was not significantly different in presence and absence of chlorpromazine.
Fig. 5.
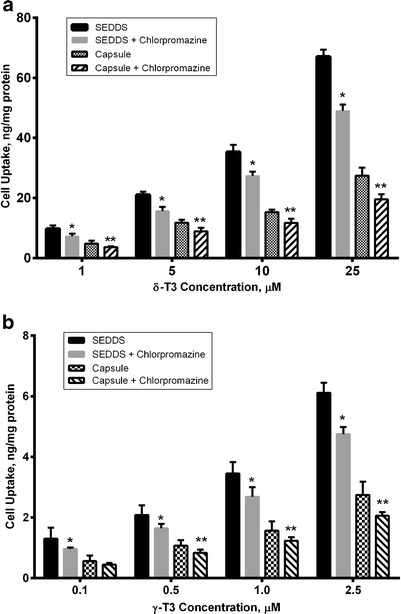
The effect of endocytosis inhibition by 50 μM chlorpromazine on the cellular uptake (in nanogram per milligram protein) of various concentrations of a δ-T3 and b γ-T3 delivered as SEDDS or capsule. Each value represents the mean ± SD from three independent experiments. *Indicates significantly different cellular uptake of δ-T3 and γ-T3 from SEDDS with chlorpromazine compared to its absence (P < 0.05). **Indicates significantly different cellular uptake of δ-T3 and γ-T3 from capsule with chlorpromazine compared to its absence (P < 0.01)
NPC1L1 Inhibition by SEDDS Excipients Cremophore EL and Labrasol
To explain the nonlinear behavior of SEDDS formulation observed in vivo, the uptake of δ-T3 and γ-T3 prepared as MM alone or in the presence of cremophor EL, labrasol or captex, the major components of SEDDS formulation, were examined. The amount of cremophor EL, labrasol or captex added to the MM were exactly as those available in the SEDDS formulation.
As illustrated in Fig. 6a,b, the cellular uptake of δ-T3 and γ-T3 examined at different concentrations was significantly reduced in the presence of cremophor EL by 60–70% (P < 0.001). The same finding was observed with labrasol however to a different extent compared to cremophore where labrasol significantly decreased the cellular uptake of δ-T3 and γ-T3 by 70–85% (P < 0.001) (Fig. 6c,d). Captex, on the other hand, did not show any effect on the cellular uptake of either isoform (data not shown).
Fig. 6.
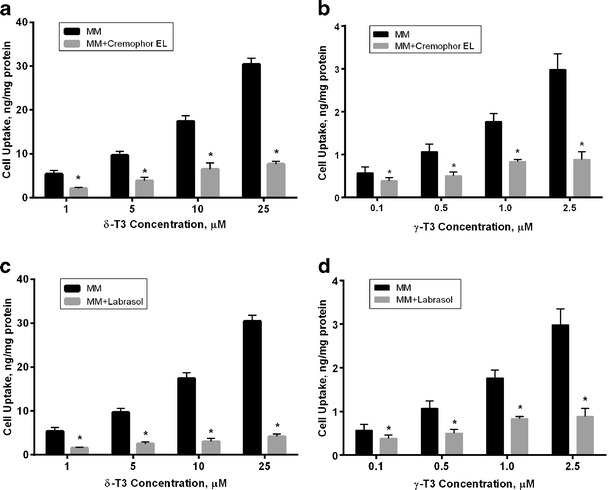
Cellular uptake (in nanogram per milligram protein) following incubation with various concentrations of a δ-T3 and b γ-T3 loaded MM in presence and absence of cremophor EL. c δ-T3 and d γ-T3 loaded MM in presence and absence of labrasol. Each value represents the mean ± SD from three independent experiments. *Indicates significantly different cellular uptake of δ-T3 and γ-T3 in presence and absence of cremophor EL or labrasol (P < 0.05)
To further investigate the effect of cremophor EL and labrasol on the cellular uptake of δ-T3 and γ-T3, we conducted concentration-dependent studies for both cremophor EL and labrasol. Viability of the cells following treatment with different concentrations of cremophor EL or labrasol was confirmed by visual inspection under the microscope. Treated cells looked healthy at all concentrations except with labrasol at concentrations larger than 0.25% (w/v) where cells de-attachment, a sign of toxicity, was observed. Thus, labrasol at concentrations higher than 0.25% were not tested. Different concentrations of cremophor EL (0.1–1.0%, w/v) with 10 μM δ-T3 and 1 μM γ-T3 loaded MM have been tested and the results are shown in Fig. 7a,b. As cremophor EL concentration increased, the cellular uptake of both δ-T3 and γ-T3 significantly decreased compared to the cellular uptake in absence of cremophor EL by 50% up to 85% reduction with higher concentration (P < 0.001). Similarly, labrasol (0.01–0.25%, w/v) significantly reduced the cellular uptake of δ-T3 and γ-T3 in concentration dependent manner (30% to 75%) (Fig. 7c,d). These findings suggested that the presence of cremophor EL or Labrasol micelles significantly reduced the cellular uptake of δ-T3 and γ-T3 at high and low concentrations of δ-T3 and γ-T3.
Fig. 7.
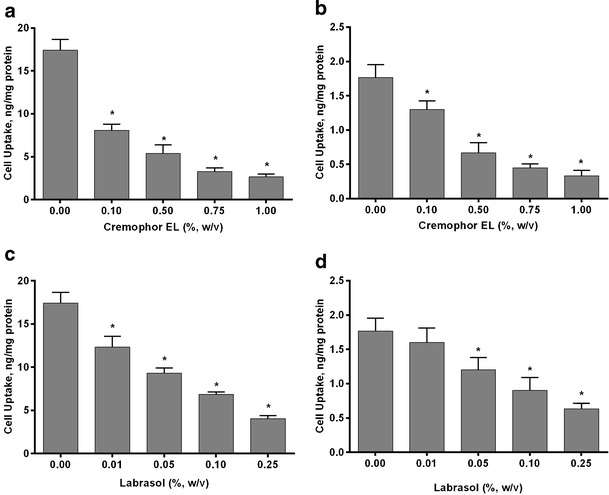
Cellular uptake (in nanogram per milligram protein) of a 10 μM δ-T3 and b 1 μM γ-T3 loaded MM with different concentrations of cremophor EL. c 10 μM δ-T3 and d 1 μM γ-T3 loaded MM with different concentrations of labrasol. Each value represents the mean ± SD from three independent experiments. *Indicates significantly different cellular uptake of δ-T3 and γ-T3 compared to control (P < 0.05)
DISCUSSION
The main objective of the current study was to enhance the in vivo bioavailability of both tocotrienol isoforms. To do so, δ-T3 and γ-T3 were packaged in a SEDDS formulation, then investigated for their in vivo performance at different doses and were compared to a commercially available product known as UNIQUE E®. Each soft gel capsule of this product contains 125 mg tocotrienols, 90% of which is δ-T3 and the remaining 10% is γ-T3. The SEDDS formulation showed significantly higher oral bioavailability for δ-T3 at 0.5 and 2.5 mg/kg doses but not at 25 mg/kg where no improvement was observed compared to capsules. On the other hand, the bioavailability of γ-T3 from SEDDS was similar to that from capsule at 0.05 and 0.25 mg/kg and significantly higher at 2.5 mg/kg than the capsule. Collectively, these findings indicate that in the dose ranges investigated the effect of SEDDS on the enhanced bioavailability of δ-T3 is more pronounced than that for γ-T3. However, this significant improvement in the absorption of δ-T3 from SEDDS, and to a lesser extent for γ-T3, was found to display nonlinear kinetics (Tables II and III). As the in vivo data from the oral administration studies demonstrated that oral clearances of both vitamin E isoforms (0.03–0.04 and 0.2–0.25 l/h/kg for δ-T3 and γ-T3, respectively) and elimination half-lives (3.6–4.0 and 2.5–3.0 h for δ-T3 and γ-T3, respectively) are constant as a function of dose, we hypothesized that the nonlinear characteristics could be explained by a saturable absorption process. Therefore, in vitro studies were performed to test this hypothesis. It is well established that SEDDS formulations generate emulsions or microemulsions following exposure to GI fluids (3,20). Some of the intact emulsions can penetrate the unstirred water layer in the intestinal lumen and easily reach the intestinal enterocyte brush border (20), whereas the remaining emulsions undergoes enzymatic size reduction and form MM in the presence of endogenous surfactants (6,20). In vitro uptake studies were conducted to compare the cellular uptake of SEDDS and capsules to MM as the most readily available form for intestinal absorption. Consistent with the in vivo data, SEDDS formulation improved the in vitro cellular uptake of δ-T3 and γ-T3 compared to MM and capsule formulations (Fig. 2). The cellular uptake of δ-T3 loaded in SEDDS at different concentrations was approximately twofold higher than its cellular uptake from MM and capsule at all concentrations tested. Additionally, the cellular uptake of SEDDS loaded with low concentrations of γ-T3 (0.1–2.5 μM) was significantly higher than its cellular uptake from MM and capsule by twofold. Collectively, in vitro and in vivo findings showed SEDDS formulation was able to enhance δ-T3 (at all investigated doses) and γ-T3 (at 2.5 mg/kg in vivo) cellular uptake and bioavailability.
In a previous study, we have demonstrated the cellular uptake of γ-T3 from MM occurs by several processes including carrier-mediated process, endocytosis, and passive uptake (49). In the current work, similar in vitro studies have been conducted to first investigate mechanisms of δ-T3 and γ-T3 cellular uptake from SEDDS and capsule formulations, second to explain their improved absorption and cellular uptake from SEDDS formulation compared to capsule, and third to explain the nonlinear behavior observed in vivo. Similar to MM, the cellular uptake of δ-T3 and γ-T3 loaded in SEDDS or capsules involved the active processes NPC1L1, which plays a major role, and endocytosis, in addition to the passive process. At 4°C, the active transport processes are essentially nonfunctional and only the passive processes are active (49–51). The cellular uptake of δ-T3 and γ-T3 at 4°C were significantly reduced when compared to the cellular uptake at 37°C for both formulations (Fig. 4). However, the passive uptake of SEDDS containing δ-T3 and γ-T3 were 3-folds higher compared to capsule. To roll out the possibility of increased viscosity as a cause for the reduced uptake of tocotrienols from both formulations at 4°C, viscosity test studies at 4 and 37°C using a TA 2000 advanced rheometer were performed. The results indicated the viscosity of both formulation at both temperatures were comparable to those of water viscosity (∼1.6 and 0.7 m.Pa.s at 4 and 37°C, respectively). This difference in viscosity between the two temperatures is miniscule and should not account for the significant difference in uptake. HPLC analysis was also performed to confirm if tocotrienols were chemically stable and retained within the dispersion at both temperatures. Since tocotrienols are oily molecules, the media was visually inspected with time and no phase separation or change in turbidity was observed throughout the study and during storage. Also, there was no change in droplet size of the dispersion when stored at 4°C.
Collectively, the results suggested that SEDDS formulation enhanced the intestinal absorption and cellular uptake through passive permeability. A possible explanation for the increased passive permeability is SEDDS excipients that can act to modulate membrane fluidity and ability of the SEDDS formulation to hide the drug molecules from being recognized by transport systems (49). However, the second possibility was excluded as NPC1L1 inhibition by ezetimibe reduced tocotrienols cellular uptake from both formulations equally (Fig. 3).
The in vivo data of δ-T3 showed a nonlinear relationship between the amount of administered dose and AUC when delivered in SEDDS formulation, and to a lesser extent in capsules (Table II). The in vivo results for 0.05 and 0.25 mg/kg doses of γ-T3 demonstrated insignificant differences in AUC values and oral bioavailability between SEDDS and capsule formulations, which were reduced as a function of dose. Interestingly, at 0.05 mg/kg dose of γ-T3 the AUC and oral bioavailability were significantly high, >100%, in both formulations and decreased sharply as a function of dose (Table III). While the reason for such observation is not clear, previous studies have reported similar findings (52,53). Such complete absorption of γ-T3 at this very low dose demonstrates rather the unneeded delivery system to enhance its bioavailability.
Endocytosis process is involved in the uptake of SEDDS formulation and similar colloidal systems. Clathrin-mediated endocytosis is a subdivision of endocytosis pathways which is mediated by small clathrin-coated vesicles that help in internalization of molecules into cells (54). Clathrin-mediated endocytosis is able to uptake the microspheres molecules with size ranging from 100 to 200 nm (55). Inhibition studies using chlorpromazine, a clathrin-mediated endocytosis inhibitor (44), significantly reduced δ-T3 and γ-T3 cellular uptake by 20–25%, in both formulations (Fig. 5). This result is consistent with our previous work where chlorpromazine reduced the cellular uptake of γ-T3, delivered as MM, by 20–25% (49).
While enhanced passive process by SEDDS increased the oral bioavailability and the endocytosis process was same for both formulations, the role of NPC1L1 in explaining the nonlinear in vivo behavior of both isoforms was not clearly evident based on results obtained from the ezetimibe inhibition studies. Thus, other possibilities were explored. SEDDS excipients such as cremophor EL and labrasol are important components of the formulation to allow entrapment and retention of δ-T3 and γ-T3 in the micellar structure. Available studies have shown cremophor RH40 (polyoxyl 40 hydrogenated castor oil) at high concentrations reduced the cellular uptake of vitamin A (56). Also, cremophor El has been reported to reduce intestinal absorption of paclitaxel by entrapment within micelles in the GI (57). It has been established that cremophor EL and labrasol interact with P-glycoprotein (P-gp) efflux transporter, and reduce its activity (58–61). Furthermore, available studies revealed that surfactant micelles, such as lipid polymer emulsions (LPE™) inhibit intestinal P-gp efflux with the exception of alpha-tocopheryl PEG 1000 succinate (TPGS) where P-gp was found to be inhibited by monomeric and not micellar TPGS (62). Thus, as δ-T3 and γ-T3 are substrates for the carrier mediated transport protein NPC1L1, the possibility of cremophor EL and labrasol to interact with NPC1L1 was investigated. In SEDDS formulation, cremophor EL and labrasol were used as the primary surfactant and co-surfactant, respectively. Upon dilution in transport media, SEDDS were found to spontaneously disperse into ∼200 nm droplets. Furthermore, because SEDDS were loaded with 35% of tocotrienols, it was essential to use high concentrations of surfactants to stabilize the emulsions upon dilution. When taking drug load into account, the actual concentration of cremophor EL and labrasol in the SEDDS would be ∼53%. The selection of these ingredients was based on our extensive formulation development and optimization studies published previously (39,46).
Following oral administration and upon GI enzymatic degradation, incorporated cremophor EL and labrasol form micelles, which possibly inhibit and/or compete with tocotrienols for their uptake by NPC1L1. Thus, to test this possibility, further studies were performed with increasing concentrations of cremophor EL and labrasol. While the critical micelle concentrations (CMC) of both molecules in vivo or in cell culture media are not known, the reported CMC value of cremophor EL or labrasol in aqueous solutions is approximately 0.01% w/v (63,64). Thus, all investigated cremophor EL and labrasol concentrations were above the CMC of these surfactants. Cells were treated with a mixture of δ-T3 and γ-T3, prepared as MM at different concentrations, and cremophore EL or labrasol. Tocotrienols concentration in this study were increased while keeping their ratios to added cremophor EL or labrasol constant in order to mimic SEDDS treatment. Cremophor EL and labrasol significantly reduced the cellular uptake of δ-T3 and γ-T3 at all investigated concentrations (Fig. 6). Concentration-dependent studies for cremophor EL and labrasol while keeping tocotrienols concentrations constant have further confirmed the above results (Fig. 7). These results strongly suggest that in the lumen, micelles forms of cremophor EL and labrasol upon SEDDS digestion inhibit NPC1L1-mediated absorption of tocotrienols across the intestinal membrane, reducing their cellular uptake and in vivo oral bioavailability, consequently leading to nonlinear absorption kinetic behavior of δ-T3 and γ-T3.
CONCLUSION
In summary, the results of this study demonstrated that SEDDS formulation successfully enhanced the oral bioavailability of δ-T3 and γ-T3. However, this enhancement was not linear as the oral bioavailability decreased as a function of dose. Our findings point toward the high concentration of the surfactants cremophor EL and labrasol released from SEDDS formulation upon digestion in the lumen, which inhibit NPC1L1-mediated absorption of tocotrienols thus inversely affect the SEDDS formulation in vivo performance. Thus, the amount of surfactants needs to be taken into consideration when developing SEDDS formulations to maximize the bioavailability of lipophilic drugs.
Electronic supplementary material
Below is the link to the electronic supplementary material.
Plasma concentration (in nanogram per milliliter) versus time (in hour) profiles after i.v. administration of (A) 10 mg/kg of δ-T3, and (B) 1 mg/kg of γ-T3, in rats (n = 4). The plots represent semi-log profiles of the i.v. data. Each value represents the mean ± SD. (JPEG 2390 kb)
Plasma concentration (in nanogram per milliliter) versus time (hour) profiles following oral administration of δ-T3 (A) 0.5 mg/kg, (B) 2.5 mg/kg, and (C) 25 mg/kg loaded in SEDDS or capsule in rats (n = 3). Each value represents the mean ± SD. (JPEG 3847 kb)
Plasma concentration (in nanogram per milliliter) versus time (hour) profiles following oral administration of γ-T3 (A) 0.05 mg/kg, (B) 0.25 mg/kg, and (C) 2.5 mg/kg loaded in SEDDS or capsule in rats (n = 3). Each value represents the mean ± SD. (JPEG 3896 kb)
(DOCX 11 kb)
REFERENCES
- 1.Porter CJ, Trevaskis NL, Charman WN. Lipids and lipid-based formulations: optimizing the oral delivery of lipophilic drugs. Nat Rev Drug Discov. 2007;6(3):231–48. doi: 10.1038/nrd2197. [DOI] [PubMed] [Google Scholar]
- 2.Porter CJ, Wasan KM, Constantinides P. Lipid-based systems for the enhanced delivery of poorly water soluble drugs. Adv Drug Deliv Rev. 2008;60(6):615–6. doi: 10.1016/j.addr.2007.10.009. [DOI] [PubMed] [Google Scholar]
- 3.Hauss DJ, Fogal SE, Ficorilli JV, Price CA, Roy T, Jayaraj AA, et al. Lipid-based delivery systems for improving the bioavailability and lymphatic transport of a poorly water-soluble LTB4 inhibitor. J Pharm Sci. 1998;87(2):164–9. doi: 10.1021/js970300n. [DOI] [PubMed] [Google Scholar]
- 4.Charman SA, Charman WN, Rogge MC, Wilson TD, Dutko FJ, Pouton CW. Self-emulsifying drug delivery systems: formulation and biopharmaceutic evaluation of an investigational lipophilic compound. Pharm Res. 1992;9(1):87–93. doi: 10.1023/A:1018987928936. [DOI] [PubMed] [Google Scholar]
- 5.Pouton CW. Formulation of poorly water-soluble drugs for oral administration: physicochemical and physiological issues and the lipid formulation classification system. Eur J Pharm Sci Off J Eur Fed Pharm Sci. 2006;29(3–4):278–87. doi: 10.1016/j.ejps.2006.04.016. [DOI] [PubMed] [Google Scholar]
- 6.O’Driscoll CM. Lipid-based formulations for intestinal lymphatic delivery. Eur J Pharm Sci Off J Eur Fed Pharm Sci. 2002;15(5):405–15. doi: 10.1016/S0928-0987(02)00051-9. [DOI] [PubMed] [Google Scholar]
- 7.Larsen A, Holm R, Pedersen ML, Mullertz A. Lipid-based formulations for danazol containing a digestible surfactant, Labrafil M2125CS: in vivo bioavailability and dynamic in vitro lipolysis. Pharm Res. 2008;25(12):2769–77. doi: 10.1007/s11095-008-9641-0. [DOI] [PubMed] [Google Scholar]
- 8.Karpf DM, Holm R, Kristensen HG, Mullertz A. Influence of the type of surfactant and the degree of dispersion on the lymphatic transport of halofantrine in conscious rats. Pharm Res. 2004;21(8):1413–8. doi: 10.1023/B:PHAM.0000036915.03725.19. [DOI] [PubMed] [Google Scholar]
- 9.Trevaskis NL, Charman WN, Porter CJ. Lipid-based delivery systems and intestinal lymphatic drug transport: a mechanistic update. Adv Drug Deliv Rev. 2008;60(6):702–16. doi: 10.1016/j.addr.2007.09.007. [DOI] [PMC free article] [PubMed] [Google Scholar]
- 10.Trevaskis NL, McEvoy CL, McIntosh MP, Edwards GA, Shanker RM, Charman WN, et al. The role of the intestinal lymphatics in the absorption of two highly lipophilic cholesterol ester transfer protein inhibitors (CP524,515 and CP532,623) Pharm Res. 2010;27(5):878–93. doi: 10.1007/s11095-010-0083-0. [DOI] [PubMed] [Google Scholar]
- 11.Holm R, Hoest J. Successful in silico predicting of intestinal lymphatic transfer. Int J Pharm. 2004;272(1–2):189–93. doi: 10.1016/j.ijpharm.2003.12.017. [DOI] [PubMed] [Google Scholar]
- 12.Porter CJ, Kaukonen AM, Boyd BJ, Edwards GA, Charman WN. Susceptibility to lipase-mediated digestion reduces the oral bioavailability of danazol after administration as a medium-chain lipid-based microemulsion formulation. Pharm Res. 2004;21(8):1405–12. doi: 10.1023/B:PHAM.0000036914.22132.cc. [DOI] [PubMed] [Google Scholar]
- 13.Sek L, Boyd BJ, Charman WN, Porter CJ. Examination of the impact of a range of Pluronic surfactants on the in-vitro solubilisation behaviour and oral bioavailability of lipidic formulations of atovaquone. J Pharm Pharmacol. 2006;58(6):809–20. doi: 10.1211/jpp.58.6.0011. [DOI] [PubMed] [Google Scholar]
- 14.Yap SP, Yuen KH. Influence of lipolysis and droplet size on tocotrienol absorption from self-emulsifying formulations. Int J Pharm. 2004;281(1–2):67–78. doi: 10.1016/j.ijpharm.2004.05.015. [DOI] [PubMed] [Google Scholar]
- 15.Han SF, Yao TT, Zhang XX, Gan L, Zhu C, Yu HZ, et al. Lipid-based formulations to enhance oral bioavailability of the poorly water-soluble drug anethol trithione: effects of lipid composition and formulation. Int J Pharm. 2009;379(1):18–24. doi: 10.1016/j.ijpharm.2009.06.001. [DOI] [PubMed] [Google Scholar]
- 16.Constantinides PP. Lipid microemulsions for improving drug dissolution and oral absorption: physical and biopharmaceutical aspects. Pharm Res. 1995;12(11):1561–72. doi: 10.1023/A:1016268311867. [DOI] [PubMed] [Google Scholar]
- 17.Balakrishnan P, Lee BJ, Oh DH, Kim JO, Hong MJ, Jee JP, et al. Enhanced oral bioavailability of dexibuprofen by a novel solid self-emulsifying drug delivery system (SEDDS) Eur J Pharm Biopharm: Official Journal of Arbeitsgemeinschaft fur Pharmazeutische Verfahrenstechnik eV. 2009;72(3):539–45. doi: 10.1016/j.ejpb.2009.03.001. [DOI] [PubMed] [Google Scholar]
- 18.Gao P, Morozowich W. Development of supersaturatable self-emulsifying drug delivery system formulations for improving the oral absorption of poorly soluble drugs. Expert Opin Drug Deliv. 2006;3(1):97–110. doi: 10.1517/17425247.3.1.97. [DOI] [PubMed] [Google Scholar]
- 19.Pouton CW. Lipid formulations for oral administration of drugs: non-emulsifying, self-emulsifying and ‘self-microemulsifying’ drug delivery systems. Eur J Pharm Sci Off J Eur Fed Pharm Sci. 2000;11(Suppl 2):S93–8. doi: 10.1016/S0928-0987(00)00167-6. [DOI] [PubMed] [Google Scholar]
- 20.Hauss DJ. Oral lipid-based formulations. Adv Drug Deliv Rev. 2007;59(7):667–76. doi: 10.1016/j.addr.2007.05.006. [DOI] [PubMed] [Google Scholar]
- 21.Pouton CW, Porter CJ. Formulation of lipid-based delivery systems for oral administration: materials, methods and strategies. Adv Drug Deliv Rev. 2008;60(6):625–37. doi: 10.1016/j.addr.2007.10.010. [DOI] [PubMed] [Google Scholar]
- 22.Cuine JF, Charman WN, Pouton CW, Edwards GA, Porter CJ. Increasing the proportional content of surfactant (Cremophor EL) relative to lipid in self-emulsifying lipid-based formulations of danazol reduces oral bioavailability in beagle dogs. Pharm Res. 2007;24(4):748–57. doi: 10.1007/s11095-006-9194-z. [DOI] [PubMed] [Google Scholar]
- 23.Aggarwal BB, Sundaram C, Prasad S, Kannappan R. Tocotrienols, the vitamin E of the 21st century: its potential against cancer and other chronic diseases. Biochem Pharmacol. 2010;80(11):1613–31. doi: 10.1016/j.bcp.2010.07.043. [DOI] [PMC free article] [PubMed] [Google Scholar]
- 24.Sen CK, Khanna S, Roy S. Tocotrienols in health and disease: the other half of the natural vitamin E family. Mol Asp Med. 2007;28(5–6):692–728. doi: 10.1016/j.mam.2007.03.001. [DOI] [PMC free article] [PubMed] [Google Scholar]
- 25.Wong RS, Radhakrishnan AK, Ibrahim TA, Cheong SK. Delta- and gamma-tocotrienols induce classical ultrastructural apoptotic changes in human T lymphoblastic leukemic cells. Microsc Microanal Off J Microsc Soc Am Microbeam Anal Soc Microsc Soc Can. 2012;18(3):462–9. doi: 10.1017/S1431927612000177. [DOI] [PubMed] [Google Scholar]
- 26.Ji X, Wang Z, Sarkar FH, Gupta SV. Delta-tocotrienol augments cisplatin-induced suppression of non-small cell lung cancer cells via inhibition of the Notch-1 pathway. Anticancer Res. 2012;32(7):2647–55. [PubMed] [Google Scholar]
- 27.Ji X, Wang Z, Geamanu A, Goja A, Sarkar FH, Gupta SV. Delta-tocotrienol suppresses Notch-1 pathway by upregulating miR-34a in nonsmall cell lung cancer cells. Int J Cancer. 2012;131(11):2668–77. doi: 10.1002/ijc.27549. [DOI] [PMC free article] [PubMed] [Google Scholar]
- 28.Fernandes NV, Guntipalli PK, Mo H. d-delta-Tocotrienol-mediated cell cycle arrest and apoptosis in human melanoma cells. Anticancer Res. 2010;30(12):4937–44. [PubMed] [Google Scholar]
- 29.Shibata A, Nakagawa K, Sookwong P, Tsuduki T, Asai A, Miyazawa T. alpha-Tocopherol attenuates the cytotoxic effect of delta-tocotrienol in human colorectal adenocarcinoma cells. Biochem Biophys Res Commun. 2010;397(2):214–9. doi: 10.1016/j.bbrc.2010.05.087. [DOI] [PubMed] [Google Scholar]
- 30.McIntyre BS, Briski KP, Gapor A, Sylvester PW. Antiproliferative and apoptotic effects of tocopherols and tocotrienols on preneoplastic and neoplastic mouse mammary epithelial cells. Proc Soc Exp Biol Med Soc Exp Biol Med. 2000;224(4):292–301. doi: 10.1046/j.1525-1373.2000.22434.x. [DOI] [PubMed] [Google Scholar]
- 31.Brooks R, Kalia P, Ireland DC, Beeton C, Rushton N. Direct inhibition of osteoclast formation and activity by the vitamin E isomer gamma-tocotrienol. Int J Vit Nutr Res Internationale Zeitschrift fur Vitamin- und Ernahrungsforschung Journal international de vitaminologie et de nutrition. 2011;81(6):358–67. doi: 10.1024/0300-9831/a000087. [DOI] [PubMed] [Google Scholar]
- 32.Zaiden N, Yap WN, Ong S, Xu CH, Teo VH, Chang CP, et al. Gamma delta tocotrienols reduce hepatic triglyceride synthesis and VLDL secretion. J Atheroscler Thromb. 2010;17(10):1019–32. doi: 10.5551/jat.4911. [DOI] [PubMed] [Google Scholar]
- 33.Constantinou C, Neophytou CM, Vraka P, Hyatt JA, Papas KA, Constantinou AI. Induction of DNA damage and caspase-independent programmed cell death by vitamin E. Nutr Cancer. 2012;64(1):136–52. doi: 10.1080/01635581.2012.630167. [DOI] [PubMed] [Google Scholar]
- 34.Kani K, Momota Y, Harada M, Yamamura Y, Aota K, Yamanoi T, et al. gamma-tocotrienol enhances the chemosensitivity of human oral cancer cells to docetaxel through the downregulation of the expression of NF-kappaB-regulated anti-apoptotic gene products. Int J Oncol. 2013;42(1):75–82. doi: 10.3892/ijo.2012.1692. [DOI] [PMC free article] [PubMed] [Google Scholar]
- 35.Gupta SC, Kim JH, Prasad S, Aggarwal BB. Regulation of survival, proliferation, invasion, angiogenesis, and metastasis of tumor cells through modulation of inflammatory pathways by nutraceuticals. Cancer Metastasis Rev. 2010;29(3):405–34. doi: 10.1007/s10555-010-9235-2. [DOI] [PMC free article] [PubMed] [Google Scholar]
- 36.Yap SP, Yuen KH, Lim AB. Influence of route of administration on the absorption and disposition of alpha-, gamma- and delta-tocotrienols in rats. J Pharm Pharmacol. 2003;55(1):53–8. doi: 10.1111/j.2042-7158.2003.tb02433.x. [DOI] [PubMed] [Google Scholar]
- 37.Abuasal B, Sylvester PW, Kaddoumi A. Intestinal absorption of gamma-tocotrienol is mediated by Niemann–Pick C1-like 1: in situ rat intestinal perfusion studies. Drug Metab Dispos Biol Fate Chem. 2010;38(6):939–45. doi: 10.1124/dmd.109.031567. [DOI] [PubMed] [Google Scholar]
- 38.Yap SP, Yuen KH, Wong JW. Pharmacokinetics and bioavailability of alpha-, gamma- and delta-tocotrienols under different food status. J Pharm Pharmacol. 2001;53(1):67–71. doi: 10.1211/0022357011775208. [DOI] [PubMed] [Google Scholar]
- 39.Alayoubi A, Satyanarayanajois SD, Sylvester PW, Nazzal S. Molecular modelling and multisimplex optimization of tocotrienol-rich self emulsified drug delivery systems. Int J Pharm. 2012;426(1–2):153–61. doi: 10.1016/j.ijpharm.2012.01.049. [DOI] [PubMed] [Google Scholar]
- 40.Narushima K, Takada T, Yamanashi Y, Suzuki H. Niemann–Pick C1-like 1 mediates alpha-tocopherol transport. Mol Pharmacol. 2008;74(1):42–9. doi: 10.1124/mol.107.043034. [DOI] [PubMed] [Google Scholar]
- 41.Abuasal BS, Qosa H, Sylvester PW, Kaddoumi A. Comparison of the intestinal absorption and bioavailability of gamma-tocotrienol and alpha-tocopherol: in vitro, in situ and in vivo studies. Biopharm Drug Dispos. 2012;33(5):246–56. doi: 10.1002/bdd.1790. [DOI] [PubMed] [Google Scholar]
- 42.Davis HR, Veltri EP. Zetia: inhibition of Niemann–Pick C1 Like 1 (NPC1L1) to reduce intestinal cholesterol absorption and treat hyperlipidemia. J Atheroscler Thromb. 2007;14(3):99–108. doi: 10.5551/jat.14.99. [DOI] [PubMed] [Google Scholar]
- 43.Yu L. The structure and function of Niemann–Pick C1-like 1 protein. Curr Opin Lipidol. 2008;19(3):263–9. doi: 10.1097/MOL.0b013e3282f9b563. [DOI] [PubMed] [Google Scholar]
- 44.Durymanov MO, Beletkaia EA, Ulasov AV, Khramtsov YV, Trusov GA, Rodichenko NS, et al. Subcellular trafficking and transfection efficacy of polyethylenimine-polyethylene glycol polyplex nanoparticles with a ligand to melanocortin receptor-1. J Control Release Off J Control Release Soc. 2012;163(2):211–9. doi: 10.1016/j.jconrel.2012.08.027. [DOI] [PMC free article] [PubMed] [Google Scholar]
- 45.Abuasal B, Thomas S, Sylvester PW, Kaddoumi A. Development and validation of a reversed-phase HPLC method for the determination of gamma-tocotrienol in rat and human plasma. Biomed Chromatogr BMC. 2011;25(5):621–7. doi: 10.1002/bmc.1493. [DOI] [PubMed] [Google Scholar]
- 46.Ali H, Nazzal M, Zaghloul AA, Nazzal S. Comparison between lipolysis and compendial dissolution as alternative techniques for the in vitro characterization of alpha-tocopherol self-emulsified drug delivery systems (SEDDS) Int J Pharm. 2008;352(1–2):104–14. doi: 10.1016/j.ijpharm.2007.10.023. [DOI] [PubMed] [Google Scholar]
- 47.Upadhyay J, Misra K. Towards the interaction mechanism of tocopherols and tocotrienols (vitamin E) with selected metabolizing enzymes. Bioinformation. 2009;3(8):326–31. doi: 10.6026/97320630003326. [DOI] [PMC free article] [PubMed] [Google Scholar]
- 48.Sontag TJ, Parker RS. Influence of major structural features of tocopherols and tocotrienols on their omega-oxidation by tocopherol-omega-hydroxylase. J Lipid Res. 2007;48(5):1090–8. doi: 10.1194/jlr.M600514-JLR200. [DOI] [PubMed] [Google Scholar]
- 49.Abuasal BS, Lucas C, Peyton B, Alayoubi A, Nazzal S, Sylvester PW, et al. Enhancement of intestinal permeability utilizing solid lipid nanoparticles increases gamma-tocotrienol oral bioavailability. Lipids. 2012;47(5):461–9. doi: 10.1007/s11745-012-3655-4. [DOI] [PubMed] [Google Scholar]
- 50.Hu Y, Litwin T, Nagaraja AR, Kwong B, Katz J, Watson N, et al. Cytosolic delivery of membrane-impermeable molecules in dendritic cells using pH-responsive core-shell nanoparticles. Nano Lett. 2007;7(10):3056–64. doi: 10.1021/nl071542i. [DOI] [PubMed] [Google Scholar]
- 51.Tomoda H, Kishimoto Y, Lee YC. Temperature effect on endocytosis and exocytosis by rabbit alveolar macrophages. J Biol Chem. 1989;264(26):15445–50. [PubMed] [Google Scholar]
- 52.Ward KW, Azzarano LM, Evans CA, Smith BR. Apparent absolute oral bioavailability in excess of 100% for a vitronectin receptor antagonist (SB-265123) in rat. I. Investigation of potential experimental and mechanistic explanations. Xenobiotica Fate Foreign Comp Biol Syst. 2004;34(4):353–66. doi: 10.1080/0049825042000205540. [DOI] [PubMed] [Google Scholar]
- 53.Ward KW, Hardy LB, Kehler JR, Azzarano LM, Smith BR. Apparent absolute oral bioavailability in excess of 100% for a vitronectin receptor antagonist (SB-265123) in rat. II. Studies implicating transporter-mediated intestinal secretion. Xenobiotica Fate Foreign Comp Biol Syst. 2004;34(4):367–77. doi: 10.1080/0049825042000205540a. [DOI] [PubMed] [Google Scholar]
- 54.Wang LH, Rothberg KG, Anderson RG. Mis-assembly of clathrin lattices on endosomes reveals a regulatory switch for coated pit formation. J Cell Biol. 1993;123(5):1107–17. doi: 10.1083/jcb.123.5.1107. [DOI] [PMC free article] [PubMed] [Google Scholar]
- 55.Rejman J, Oberle V, Zuhorn IS, Hoekstra D. Size-dependent internalization of particles via the pathways of clathrin- and caveolae-mediated endocytosis. Biochem J. 2004;377(Pt 1):159–69. doi: 10.1042/BJ20031253. [DOI] [PMC free article] [PubMed] [Google Scholar]
- 56.Karpf DM, Holm R, Garafalo C, Levy E, Jacobsen J, Mullertz A. Effect of different surfactants in biorelevant medium on the secretion of a lipophilic compound in lipoproteins using Caco-2 cell culture. J Pharm Sci. 2006;95(1):45–55. doi: 10.1002/jps.20431. [DOI] [PubMed] [Google Scholar]
- 57.Bardelmeijer HA, Ouwehand M, Malingre MM, Schellens J, Beijnen JH, van Tellingen O. Entrapment by Cremophor EL decreases the absorption of paclitaxel from the gut. Cancer Chemother Pharmacol. 2002;49(2):119–25. doi: 10.1007/s00280-001-0394-2. [DOI] [PubMed] [Google Scholar]
- 58.Rege BD, Kao JP, Polli JE. Effects of nonionic surfactants on membrane transporters in Caco-2 cell monolayers. Eur J Pharm Sci Off J Eur Fed Pharm Sci. 2002;16(4–5):237–46. doi: 10.1016/S0928-0987(02)00055-6. [DOI] [PubMed] [Google Scholar]
- 59.Shono Y, Nishihara H, Matsuda Y, Furukawa S, Okada N, Fujita T, et al. Modulation of intestinal P-glycoprotein function by cremophor EL and other surfactants by an in vitro diffusion chamber method using the isolated rat intestinal membranes. J Pharm Sci. 2004;93(4):877–85. doi: 10.1002/jps.20017. [DOI] [PubMed] [Google Scholar]
- 60.Lin Y, Shen Q, Katsumi H, Okada N, Fujita T, Jiang X, et al. Effects of Labrasol and other pharmaceutical excipients on the intestinal transport and absorption of rhodamine123, a P-glycoprotein substrate, in rats. Biol Pharm Bull. 2007;30(7):1301–7. doi: 10.1248/bpb.30.1301. [DOI] [PubMed] [Google Scholar]
- 61.Nerurkar MM, Burton PS, Borchardt RT. The use of surfactants to enhance the permeability of peptides through Caco-2 cells by inhibition of an apically polarized efflux system. Pharm Res. 1996;13(4):528–34. doi: 10.1023/A:1016033702220. [DOI] [PubMed] [Google Scholar]
- 62.Constantinides PP, Wasan KM. Lipid formulation strategies for enhancing intestinal transport and absorption of P-glycoprotein (P-gp) substrate drugs: in vitro/in vivo case studies. J Pharm Sci. 2007;96(2):235–48. doi: 10.1002/jps.20780. [DOI] [PubMed] [Google Scholar]
- 63.Kessel D. Properties of cremophor EL micelles probed by fluorescence. Photochem Photobiol. 1992;56(4):447–51. doi: 10.1111/j.1751-1097.1992.tb02187.x. [DOI] [PubMed] [Google Scholar]
- 64.Koga K, Kusawake Y, Ito Y, Sugioka N, Shibata N, Takada K. Enhancing mechanism of Labrasol on intestinal membrane permeability of the hydrophilic drug gentamicin sulfate. Eur J Pharm Biopharm: Off J Arbeitsgemeinschaft fur Pharmazeutische Verfahrenstechnik eV. 2006;64(1):82–91. doi: 10.1016/j.ejpb.2006.03.011. [DOI] [PubMed] [Google Scholar]
Associated Data
This section collects any data citations, data availability statements, or supplementary materials included in this article.
Supplementary Materials
Plasma concentration (in nanogram per milliliter) versus time (in hour) profiles after i.v. administration of (A) 10 mg/kg of δ-T3, and (B) 1 mg/kg of γ-T3, in rats (n = 4). The plots represent semi-log profiles of the i.v. data. Each value represents the mean ± SD. (JPEG 2390 kb)
Plasma concentration (in nanogram per milliliter) versus time (hour) profiles following oral administration of δ-T3 (A) 0.5 mg/kg, (B) 2.5 mg/kg, and (C) 25 mg/kg loaded in SEDDS or capsule in rats (n = 3). Each value represents the mean ± SD. (JPEG 3847 kb)
Plasma concentration (in nanogram per milliliter) versus time (hour) profiles following oral administration of γ-T3 (A) 0.05 mg/kg, (B) 0.25 mg/kg, and (C) 2.5 mg/kg loaded in SEDDS or capsule in rats (n = 3). Each value represents the mean ± SD. (JPEG 3896 kb)
(DOCX 11 kb)