Abstract
The administration of human biotherapeutics is often associated with a higher incidence of immunogenicity in preclinical species. The presence of anti-drug antibodies (ADAs) in the test samples can affect the accurate measurement of therapeutic protein (TP) in bioanalytical methods designed to support pharmacokinetic (PK) and toxicokinetic (TK) assessments. The impact can vary depending on the bioanalytical method platform and study dosing design. The goal of this study is to evaluate the impact of ADA response on the bioanalytical methods in support of PK/TK and the associated study data interpretation. Sprague Dawley rats were administered with four weekly doses of 50 mg/kg TP, a humanized monoclonal antibody. The TP in serum samples was measured using three bioanalytical methods that quantified bound and/or unbound TP to ADA. The ADA response in the animals was classified into negative, low, medium, and high based on the magnitude of the response. The presence of ADA in samples led to discrepant TP measurements between the methods, especially at time points where the TP concentrations were low. This could be due to ADA interference to the accurate measurement of ADA-bound TP concentrations. The TP concentration at last time point (Clast) was reduced by 82.8%, 98.6%, and 99.8%, respectively, for samples containing low, medium, and high levels of ADA. The interfering effects of the ADA on bioanalytical methods and exposure were evident as early as 2 weeks post-dosing. This modeling approach can provide the better understanding of ADA impact on PK exposure in multiple doses.
Key words: anti-drug antibodies, bound and unbound biotherapeutics, free vs total, PK exposure
INTRODUCTION
Administration of therapeutic proteins (TPs) such as humanized, fully human monoclonal antibodies or recombinant proteins can induce the formation of anti-therapeutic antibodies, commonly known as anti-drug antibodies (ADAs) in both preclinical animals and clinical subjects (1). The ADA can impact pharmacokinetic (PK) exposure, bioavailability of TP, and the pharmacodynamic (PD) effects depending on their distinct characteristics. These may include epitope specificity (idiotype vs non-idiotype), magnitude (titers or relative concentration), timing (early vs late onset), maturity (persistent vs transient), and affinity (IgM vs IgG) of the ADA response (1,2).
During the biotherapeutic development, we often utilize bioanalytical methods designed to measure TPs that are not bound to soluble ligands or targets using either a neutralizing anti-idiotypic pair or targeted ligands (electrochemiluminescence (ECL) in Fig. 1a). Such methods are frequently referred to as “free” methods for unbound TP measurement. Additionally, bioanalytical methods designed to measure TPs bound to ligands or targets are used and referred to as “total” methods (3) (ELISA and microfluidic platform (MFP) in Fig. 1a). While the term free can also refer to TPs that are not bound to the circulating ADAs targeted against complementary determining region (CDR) of TP (Fig. 1b), the term total does not necessarily reflect the measurement of all forms of TP-ADA immune complexes due to the complex formation via differential binding sites (Fig. 1). In this study, the term “unbound” (TPu) refers to the serum concentration of TPs not complexed to any ADAs directed against any region of the TP. The term “bound” (TPb) refers to the serum concentration of TP-ADA-bound immune complexes irrespective of if ADA binds CDR or Fc portions of TP. Additionally, the term “bound and unbound” (TPu+b) refers to both TPu and TPb complexed with ADAs (Fig. 1). Figure 1c illustrates the various forms of TPb based on the binding of the ADA to either Fc or CDR regions of TP. The inability of the ELISA and MFP platforms to detect the ADA bound TP at Fc region and ECL platform to detect the ADA bound TP at CDR region has been shown. Initially, a reference colorimetric ELISA-based method was used to measure the TPu+b using different capture and detection antibody clones (clones A and B, respectively) specific to the Fc region of human IgG. Then, a microfluidic-based platform (referred in this report as MFP) that measures the TPu+b was used. In this method, monoclonal antibody specific to the Fc region of human IgG (clone A) is used as capture and detection. Finally, an ECL-based platform that measures the TPu concentration using a pair of anti-idiotypic antibodies as capture and detection (clones 1 and 2) was employed.
Fig. 1.
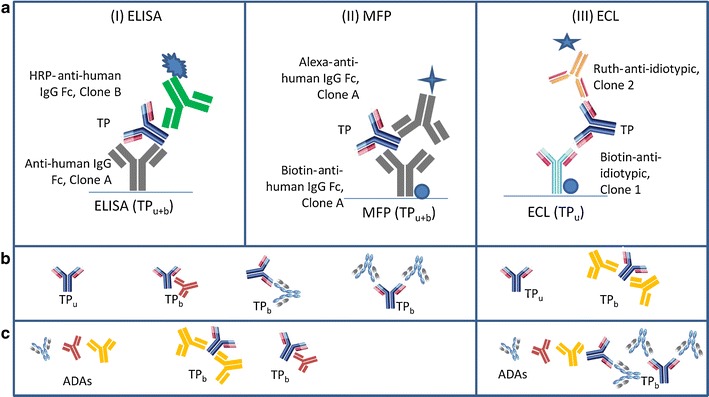
a Schematic diagram describing the three bioanalytical methods: ELISA, MFP, and ECL platforms. ELISA and MFP have anti-human IgG Fc (clone A) as the capture reagent, but use different anti-human IgG Fc clones (clone B in ELISA and clone A in MFP) for detection. b Simplified illustrations of the TP and TP with ADA immune complexes that ELISA, MFP, or ECL methods can detect. c Simplified illustrations of ADA or TP-ADA immune complexes that each method cannot detect if the ADAs are bound to the TPs where ADA binding sites overlap with that of detection antibodies. The immune complexes are identified as: TP b (TP bound to ADA targeted at different binding sites) and TP u is TP unbound to ADA. Detection reagents: HRP (horse radish peroxidase labeled), Alexa (Alexa Fluor 647 labeled), or Ruth (ruthenium labeled)
The formation of ADA can confound the PK data interpretation by either a direct interference in the bioanalytical method or in vivo by impacting the clearance profile of the TP (immune-mediated clearance). Several factors such as soluble ligand/target, nonspecific serum components, or ADA can affect the accurate measurement of TP (4). Often, the interference of ADA in the bioanalytical method to measure TP is evaluated during the pre-study method validation using the monoclonal or polyclonal antibodies against TP. These antibodies are commonly cited in the literature as “positive controls” for immunogenicity methods. However, these antibodies may not be truly representative of an in vivo ADA response in study animals. Hence, the ADA interference testing on the PK bioanalytical method generated during pre-study method validation may not directly relate to in vivo ADA impact. Consequently, the impact of ADA on PK assessment during the study must be interpreted cautiously to account for the host-specific polyclonal ADA responses.
The goals of this research study were (i) to determine the comparability of three bioanalytical methods in measuring TPs in incurred sample in the presence of rat anti-TP antibodies, (ii) to investigate the extent of ADA impact on the TPu or TPu+b measurements, and (iii) to evaluate the impact of ADAs on TP exposure in a multiple-dose study. To ensure that the observed impact on PK assessment was mediated by ADA alone, the study was performed in a rat model with a humanized IgG2 monoclonal antibody (referred to as TP) which does not recognize the endogenous target. Sprague Dawley® rat serum samples were assessed for the concentration–time profile of TP using three bioanalytical methods that could measure TPu or TPu+b. It has been noted earlier that changes in both reagents and platforms can cause non-equivalent in bioanalytical methods for PK assessment (5) or non-comparability in bioanalytical methods for biomarker assessments (6). Hence, this study investigated the effects of ADA on TP measurement across these three bioanalytical methods and their comparability related to detection of TPu or TPu+b concentrations. The study also aimed to explore the impact on TP exposure due to varying magnitudes of the ADA response in multiple-dose regimes through a modeling approach.
MATERIALS AND METHODS
ELISA Method for Measurement of TPu+b Concentration
A method to measure TPu+b had been previously reported (7). Briefly, microplates (96 wells) coated with a murine anti-human IgG Fc monoclonal antibody (clone A, Lot 2522025 # 1, Amgen Inc., CA) were used to capture the TPs. The standards (STDs), and quality controls (QCs), made by spiking the TP (Lot 0010043097, Amgen Inc., CA) into 100% Sprague Dawley® rat serum, blank, and study samples were diluted 1:30 in an assay buffer (1× phosphate-buffered saline (PBS) with 0.5 M NaCl and 0.5% Tween 20) prior to loading into a 96-well microtiter plate. After a wash step, a horse radish peroxidase (HRP)-conjugated murine anti-human IgG monoclonal antibody against a unique Fc region of TP (clone B, Lot 2324714 # 3, Amgen Inc., CA) was added to the wells. After a final wash step, the TMB peroxide substrate solution (Kirkegaard and Perry Laboratories Inc., MD) was added to the wells. The color development was stopped and the intensity of the color (optical density) was measured at 450 nm with reference to 650 nm using Molecular Devices SpectraMax 340PC microplate reader (Molecular Device, Sunnyvale, CA) equipped with SOFTmax Pro software (v5.0.1). The range of the analytical method was 0.02–2 μg/mL.
ECL-Based Method for Measurement of TPu Concentration
Standard streptavidin-coated 96-well microplates (Meso Scale Discovery® “MSD”; Gaithersburg, MD) were passively coated with the biotin-labeled murine idiotypic monoclonal antibody against the CDR region of TP antibody (clone 1, Lot 2579060 # 2, Amgen Inc., CA). The STD and QC were made by spiking the TP into 100% Sprague Dawley® rat serum and diluted 1:30 in an assay buffer (1× PBS with 0.5 M NaCl and 0.5% Tween 20) prior to loading into the wells. A ruthenium-labeled murine monoclonal antibody against CDR region of TP antibody (clone 2, Lot 2566770 # 3, Amgen, Inc. CA) was added for the detection of captured TP antibody. Both capture and detection antibodies were characterized as neutralizing clones. Following another wash step, a tripropylamine read buffer (MSD®, Gaithersburg, MD) was added to the plate. The plate was then read using the SECTOR® Imager 6000 Instrument (MSD, Gaithersburg, MD, USA) equipped with Discovery Workbench software (v3.0.18). The resulting ECL was measured and reported in ECL units. The range of this analytical method was 0.03–10 μg/mL.
MFP Method for Measurement of TPu+b Concentration
Streptavidin-coated Bioaffy 200 Compact Disks (CDs) were purchased from Gyros (Uppsala, Sweden). The STD and QC were made by spiking TP into 100% Sprague Dawley® rat serum and diluted 1:10 in assay buffer (1× PBS with 1 M NaCL, 0.5% Tween 20, and 1% BSA) prior to loading into a Bioaffy 200 CD. The biotinylated murine monoclonal antibody against human IgG Fc (clone A, Lot P49211.13, Amgen, Inc. CA) was loaded first through a common channel within the bioaffy CD as a capture reagent. Biotinylated capture reagent formed a complex with the streptavidin-coated beads. After being loaded in separate sample chambers, the TPs present in the STDs, QCs, and study samples were captured by the biotinylated antibody. The detection antibody, Alexa Fluor 647-labeled murine monoclonal antibody against human IgG Fc (clone A, Lot P49211.14, Amgen, Inc. CA), was then loaded through a common channel within the bioaffy CD allowing the immune complexes to form. The clone of these murine monoclonal antibody against human IgG Fc used as the capture and detection reagents was also used in the ELISA method, with a different label. Sample analysis was done using GyroLab xP workstation equipped with GyroLab Control (v5.2.0). The range of this analytical method was 0.05–10 μg/mL.
ADA Immunoassay—UNISA
The Universal Indirect Species-Specific Assay (UNISA) was performed as previously described (8). Briefly, the 96-well standard bind plate (MSD, Gaithersburg, MD, USA) was coated overnight with 1 μg/mL of the TP in 1× PBS (35 μL/well). The assay controls consisted of 100 and 500 ng/mL of a rat anti-hu IgG Fc chimeric antibody spiked into pooled normal rat serum (PNRS) as previously described (8). The assay (positive) controls and serum samples were diluted 1:200 in an assay buffer (5× milk diluent/block (Kirkegaard and Perry Laboratories “KPL,” Gaithersburg, MD, USA)) with three conditions: (1) untreated or no excess therapeutic; (2) therapeutic treated or 50 μg/mL of excess TP; and (3) irrelevant treated or 50 μg/mL of excess human IgG (same subclass and light chain as the TP). Samples were incubated for 30 min, to allow the immunodepletion samples (treated samples) time to react. The coated and blocked plates (blocked with assay buffer, 200 μL/well overnight) were washed on day 2 with 1× wash buffer (KPL, Gaithersburg, MD, USA) and diluted assay controls and serum sample were added (100 μL/well) to the plate and incubated for approximately 3 h. Plates were washed and ruthenylated rabbit anti-rat IgG Fc antibody was added (0.5 μg/mL, 35 μL/well) and incubated for approximately 30 min. Following another wash, 2× T read buffer (MSD, Gaithersburg, MD, USA) was added (150 μL/well). The plates were read using the SECTOR® Imager 6000 Instrument (MSD, Gaithersburg, MD, USA) utilizing the Discovery Workbench software (v2. 0 7.3). The resulting ECL was measured and reported in ECL units. The ECL response of the sample over the ECL response of the background of the assay or PNRS was captured as signal to noise (S/N). Due to the elevated PNRS response (∼400 ECLs) compared to the predose on study animals (∼100 ECLs), it was determined that a post/pre-ratio of ECL response per animals be used to accurately evaluate each animal for developing ADA. The TP-treated ECL response compared to the untreated ECL response per sample was then evaluated to determine the TP-specific percent depletion. Animals with a post/pre-ratio greater than 1.5 and a TP percent depletion value greater than 20%, based on qualified data generated during assay development and performance of the assay controls, were considered positive for TP-specific ADA. The irrelevant treated ECL response compared to the untreated ECL response per sample was hence evaluated to determine the irrelevant-specific percent depletion. Animals with a post/pre-ratio greater than 1.5 and an irrelevant percent depletion value greater than 20%, based on qualified data generated during assay development and performance of the assay controls, were considered positive for irrelevant ADA, supporting identification of an anti-Fc antibody response.
Animal and Sample Selection
Sprague Dawley® rats in a toxicokinetic study were administered with 50 mg/kg of TP weekly for 4 weeks by subcutaneous route of administration. Serum samples were collected at seven time points (24 and 168 h postdose of day 1, predose of days 15 and 22, 24 h postdose of day 22, and days 29 and 43) from each animal for TP measurement and two time points (day 1 prior to dosing and day 29 postdose) from each animal for ADA assessments. All samples were analyzed using ELISA for assessment of TP concentration–time profiles and UNISA for ADA assessment. A total of 12 out of 30 animals were selected for the equivalency of TP levels across methods and were also analyzed using ECL and MFP methods.
Statistical Analysis and Software
Data analysis was performed by using SAS V9.1 on a Windows XP Professional operating system. To evaluate the equivalence, data were log transformed before statistical analysis. The mean difference and the corresponding two-sided 90% confidence interval (CI) were calculated and were then transformed back to give the estimated ratio of the geometric means of the two methods and the 90% CI of the ratio. The p value of the method difference was also provided. The two analytical methods were considered equivalent or comparable if the 90% CI of the ratio was completely contained within the equivalence range [0.80, 1.25]. For simulation of PK profiles, parameter estimates and simulation were performed using WinNonlin Professional (version 5.1.1, Pharsight Corp., Mountain View, CA).
RESULTS
Serum TP concentrations were measured using three bioanalytical methods. The serum TPu and TPu+b levels were compared to determine the equivalence between three methods in measuring study samples.
TPu+b Measurements in the Presence of ADA Are Comparable Regardless of Platforms While ADA Affects the Measurements of TPu
TP concentrations were measured in serum samples collected from 12 animals using the ELISA, MFP, and ECL methods. All three methods showed similar concentration–time profiles, at all time points except for day 43 (Fig. 2a). Even though the measured TP concentrations were similar, a larger variability was observed for samples collected on days 15 and 22 (360 and 528 h) in both log and linear scales (Fig. 2a) across the three methods. We then performed the equivalence test using 90% CI between three bioanalytical methods. The mean concentration ratio of ELISA to MFP was 0.99% and the 90% CI is contained within the 0.80–1.25 interval indicating that no significant difference was observed for TP level measured by the TPu+b assay formats (Table I). Therefore, these two methods were considered equivalent. However, significant differences were observed between ECL (which measures TPu) and ELISA or MFP methods (Table I). The mean concentration ratios of ELISA to ECL and MFP to ECL were 1.41 and 1.43, respectively, and the 90% CI values were not contained within the 0.80–1.25 interval. Thus, both TPu+b methods were not equivalent to the TPu method (ECL) for these study samples. Specifically in the ECL-based measurement, a collection–time-dependent incomparability was observed when samples collected on days 22 and 43 were evaluated (Fig. 2b, c). The samples from 24-h postdose of days 1 and 22 showed a good correlation between TPu and TPu+b methods. A poor correlation was observed in samples that were collected prior to dosing at days 15 and 43. As the day 15 time point coincided with the development of ADA response, the ADA in the samples might be interfering and contributing to the discordance in the measurement by different methods. At day 43, the overall TP concentrations were lowered compared to the samples collected at 24 h postdose of day 22 indicating that most TPs were bound by ADA at their idiotypic regions and hence TPu could not be detected in the ECL-based method.
Fig. 2.
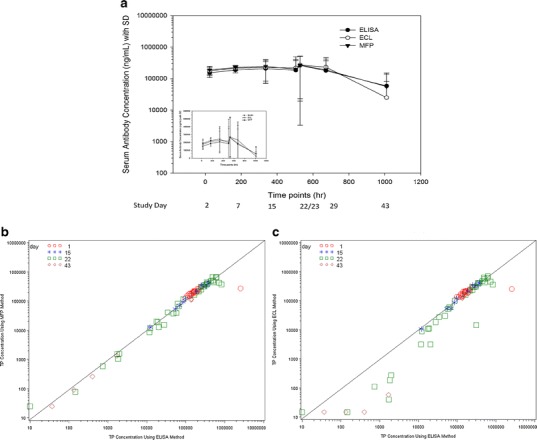
Concentration–time profiles of TP after the subcutaneous administration of 50 mg/kg in rats (a) showing in both log and linear scales (inset). TP concentrations were measured by ELISA, ECL, and MFP. Correlation of ELISA to MFP (b) or ECL (c) in measurement of serum TP concentrations with reference to samples from different collection days. Correlation was observed between ELISA and MFP (b) all the time points of day 1 24-h postdose (red open circle), day 15 predose (blue asterisk), day 22 predose and 24 h postdose of day 22 (green square), and day 43 predose (brown diamond). However, there was a lack of correlation between ELISA and ECL (c) methods for some samples collected on time points, day 22, and all samples collected on day 43
Table I.
Equivalence Testing Between Three Methods Measuring Therapeutic Protein (TP). The Equivalent Testing Using 90% Confidence Interval (CI) Indicated that there Was Incomparability Between Methods that Measure TPu and TPu+b
| Methods (method 1/2) | Geometric mean concentration measured by method 1 | Geometric mean concentration measured by method 2 | Ratio of method 1 Vs method 2 | 90% CI of ratio | p value |
|---|---|---|---|---|---|
| ELISA (TPu+b)/MFP (TPu+b) | 44,914 | 45,342 | 0.99 | [0.86, 1.14] | 0.9123 |
| ELISA (TPu+b)/ECL (TPu) | 44,914 | 31,771 | 1.41 | [1.23, 1.63] | <0.0001 |
| MFP (TPu+b)/ECL (TPu) | 45,342 | 31,771 | 1.43 | [1.24, 1.64] | <0.0001 |
Strength of ADA Response on TPu and TPu+b Measurement
During ADA assessment, all samples with postdose-to-predose ratios (post/pre) greater than 1.5 were successfully depleted with excess TP, demonstrating the specificity of the ADA response to the dosed TP (data not shown). Additionally, a few animals with post/pre ratios greater than 1.5 were also successfully depleted greater than 20% with an irrelevant antibody of the same isotype/subclass/light chain as the dosed TP, mapping the ADA response to the framework or Fc region of the TP. Based on the specificity of ADA to TP, further evaluation of the magnitude of the ADA response on the TP concentration–time profiles was explored. Then, the animals were classified into four groups based on their ADA post/pre ratios and the serum TP concentrations (Fig. 3) as follows: (1) without ADA, (2) low level of ADA with a post/pre ratio of <100, (3) a moderate level of ADA with post/pre ratio between 100 and 500, and (4) a high level of ADA with post/pre ratio >500.
Fig. 3.
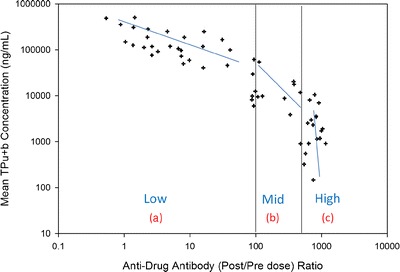
The relationship of anti-drug antibodies (ADA) response presented in postdose to predose (post/pre) to TPu+b concentration. As there were three distinct slopes for post/pre dose distribution, thus animals were grouped into four: animals without ADA, not shown in the graph, (a) animals with low level of ADA with post/predose of <100, (b) animals with mid-level of ADA with post/pre of >100 but <500, and (c) animals with high level of ADA with post/pre of >500. Only 10% of animals (3 out of 30) did not have ADA (ADA negative)
The concentration–time profiles of animals with low, moderate, and high levels of ADA (groups 2–4) were compared to group 1 with no ADA (Fig. 4a–d). The animals in group 2 had negligible impact in measurement of both TPu and TPu+b concentrations when compared to the ADA-negative animals from group 1 (Fig. 4b). Animals with the moderate and high levels of ADA in groups 3 and 4 showed reduced TP concentrations on days 15 and 43 (Fig. 4c, d). The decrease in TP concentrations was more pronounced when ECL method-derived assessments were compared to assessments performed by either ELISA or MFP methods. This is likely due to formation of complexes between TP with ADA-targeted against the idiotypic regions of TP (Fig. 1). This pronounced effect was rather masked when the moderate and high levels of ADA animals were combined with low-level ADA animals as shown in Fig. 2a. To further understand the impact of ADA responses on overall exposure, we overlaid the concentration–time profiles of TPu (measured by ECL) and TPu+b (measured by ELISA) in different ADA-containing groups (Fig. 5). Animals with moderate or high levels of ADA impacted the overall concentration–time profiles of both TPu and TPu+b more significantly than animals with low ADAs. This result indicated the presence of TP complexed with ADAs targeted against Fc portion of TP in the samples and ADAs impacted the measurement of TPu+b in moderate and high levels of ADA animals.
Fig. 4.
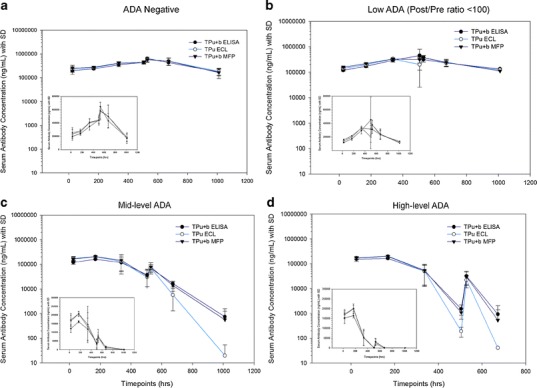
Mean serum concentration–time profiles of TP measured using three different platforms and four ADA groups (a–d): (a) animals without ADA, (b) animals with low level of ADA with post/predose ratio of <100, (c) animals with mid level of ADA with post/pre of >100 but <500, and (d) animals with high level of ADA with post/pre of >500. The TP concentration results are presented in both log and linear (inset) scales
Fig. 5.
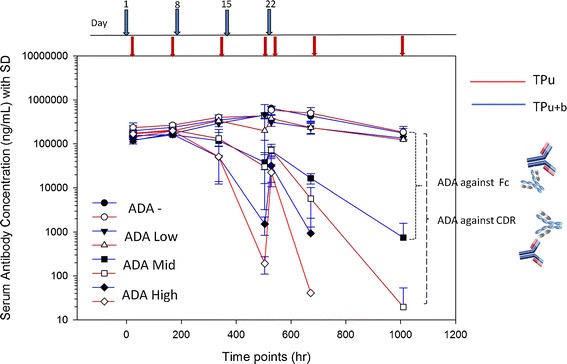
Mean serum concentration–time profiles of TPu or TPu+b in four ADA groups; without ADA, animals with low level of ADA, animals with mid level of ADA, and animals with high level of ADA. The blue and red lines represent the TPu+b and TPu concentrations, respectively. The filled circle and empty circle represent the animals which are ADA negative, filled and opened triangles represent the animals with low ADA, filled and opened squares represent the animals with mid-level ADA, and filled and opened diamonds represent the animals with high-level ADA. The dotted lines represent the interference by ADA targeted against Fc portions of TP and antigen binding region (complementary determining regions or CDR), respectively
Impact of ADA on TP Exposure in Multiple-Dose Administration
Due to the sparse sampling of time points, the true impact of ADA in multiple doses cannot be determined. Hence, a simulation of the multiple-dose PK profile was performed using the estimates of a humanized monoclonal antibody in rat (Fig. 6a). One profile modeled the observed TP concentrations of animals with ADA status grouped into positive or negative responses. The second profile overlaid the observed TP concentrations in animal groups based on low, moderate, and high magnitudes of ADA (Fig. 6b). A significant decrease in exposures in trough levels before and after the third dose was apparent among all ADA-positive groups. The reduction in the area under the curve increased as ADA magnitude increased. The concentration at the last time point (Clast) in each ADA category was reduced by 82.8%, 98.6%, and 99.8%, respectively, when it was compared to that of ADA-negative animals.
Fig. 6.
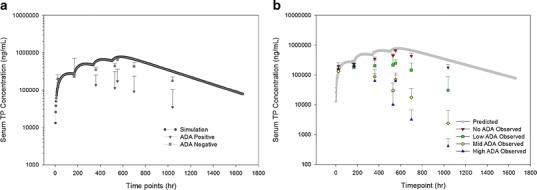
a Simulated serum concentration–time profile of a humanized IgG1 antibody in rats overlaid with observed serum concentration–time profiles of ADA-negative animals and all ADA-positive animals regardless of ADA titers. b Simulated serum concentration–time profile of a humanized IgG1 antibody in rats overlaid with observed serum concentration–time profiles of with four ADA groups
DISCUSSION
Development of ADA in test animals and human subjects can impact the accurate measurement of TPs regardless of the bioanalytical methods being used and potentially affect the data interpretation. The interference of ADA on bioanalytical methods designed to measure TP is often assessed during pre-study method validation. This involves evaluating the TP recovery in the presence of polyclonal or monoclonal antibodies spiked into the matrix of relevant species containing spiked TPs (9). Additionally, some laboratories also determine the dilutional linearity of the ADA-positive incurred samples through parallelism testing. With respect to the interference from ADA, the pre-study method validation may not reflect the breadth of the in vivo immune response. An impact of ADA on the measured TP concentration is expected, although the true degrees of impact are difficult to assess due to individual’s biological variability. The data from this study confirmed that ADA could impact both bioanalytical estimation as well as PK exposure interpretation. Hence, a thorough understanding of the impact of ADA and the choice of analytical methods employed for such measurements is important (10).
From the bioanalytical perspective, it has been shown that either the change in capture or detection reagents and/or platforms can lead to non-comparability of bioanalytical methods in measuring PK (5). In the case of biomarker methods, sample types (spiked vs incurred or study samples), in addition to reagent(s) and platform(s), have been linked to the non-comparability of methods (6). In this study, we have shown that three different methods with three different platforms designed to measure TPu or TPu+b showed comparability even though different reagents and/or clones were utilized in the absence of ADA. However, samples collected from ADA-positive animals with different magnitudes of ADA and during certain time points can lead to method incomparability. The presence of ADA in the samples affected the overall exposure of TP at the time points where concentration of TP is low or when ADA-TP immune complexes are formed. It should be kept in consideration by both bioanalytical scientists and pharmacokineticists if data are compared across studies that the methods used were same or different and if the impact of the magnitudes of ADA were evaluated.
Additionally, the TPu+b and TPu measurements in the same serum samples indicated that a significant decrease in exposure was observed in moderate and high ADA-positive groups even though the methods to measure TPu+b were implemented. It has been previously observed that the terminal half-life (t1/2) is much shorter for the TPu as it is cleared faster than ADA and TP complexes. The results from this study indicated that the shorter terminal half-life might be due to the inability of the method to measure the TP in TP-ADA complexes and not entirely due to faster clearance. Although the TP bound to the ADA was still in the circulation, the complexes were not measureable even by the methods designed to quantitate most forms of ADA-TP complexes. Moreover, even though the methods to measure both bound and unbound TP were implemented, the presence of ADA still hampered the measurable TP concentrations substantially.
There is a great deal of interest to understand the impact of ADA on PK/PD to support study interpretation (2,9,11). However, assessment of the magnitude of the ADA response on PK is limited. One common strategy employed by pharmacokineticists or toxicokineticists in exposure calculations is to exclude all the ADA-positive animals from PK or TK assessments regardless of ADA magnitudes. This all-or-nothing approach may eliminate some usable data for PK parameter estimation. One argument in support of excluding all ADA-positive animals is that PK or TK parameter estimates are often used in prediction of human exposure and estimation of safety margin. Therefore, inclusion of ADA positive animals can confound such estimations. Moreover, the rate of immunogenicity in animals does not necessarily reflect the incidence of immunogenicity in human and it is expected that clinical subjects are far less likely to have ADAs. Thus, inclusion of ADA-positive animals is not a preferred approach for PK parameter estimation. Preliminary analysis from this study indicated that data from animals with a low ADA response still have sufficient exposure and can still be useful for the analyses of PK exposure and PD effect. A conservative approach would be to calculate PK/PD parameters with all animals and then conduct another calculation with ADA-positive animals excluded. When the sufficient animal data are available, the analyses of PK exposure and PD effect in ADA-positive animals should be further explored based on their ADA responses. It should also be noted that animals with negative ADA status that are included in PK estimations might not be truly negative and might have circulating ADA levels that are present in a complexed form to TP, hence keeping the TP in circulation. Additionally, due to technical limitations, a negative ADA result might be due to inability of the immunological method to detect ADA in the presence of excess TP.
Further evaluation is needed to establish the threshold of ADA that can have minimal impact on the PK assessment. An effort is ongoing to generate a model that can complement the PK/PD models where the magnitude of ADA response with respect to PK exposure can be included as an additional covariates to delineate the different clearance mechanisms. However, there are a few challenges that will have to be considered. First, the numbers of animals/subjects in each study may be small for each dose group; therefore, the correlation cannot be evaluated to assess ADA impact on PK in every study. Second, the methodology used in detecting ADA for each TP may differ in formats or reporting values, thus meta-analysis on impact of ADA is limited. Hence, additional analyses with these different therapeutic proteins are needed to better understand and to fully delineate the ADA impact on PK assessment.
CONCLUSIONS
It is important to accurately measure the exposure of TP for PK/PD evaluation during the course of biotherapeutics development. The presence of ADA in a sample may interfere in accurate measurement of TP by the bioanalytical methods in addition to reagent, platform, and matrix differences as previously reported. Significant reduction in overall exposures due to ADA was observed although methods designed to measure both bound and unbound forms of TP were used for PK assessment. The results from this case study indicate that the impact of ADA on PK profiles of preclinical animals should be assessed in individual animals using the magnitude of the ADA response. This initial assessment can be explored to guide the exclusion or inclusion of ADA-positive animals in PK parameter estimates in the event of a high immunogenicity rate during the study. Further analyses on impact of ADA on PK will be needed to confirm if the animals/subjects with a low ADA response can be included in PK estimations and a threshold of such a response will need to be established.
Acknowledgments
Financial support for this review was provided by Amgen Inc. We would like to thank Dr. Peng Luan (Amgen Inc. Thousand Oaks, CA) for his critical review.
References
- 1.Chirmule N, Jawa V, Meibohm B. Immunogenicity to therapeutic proteins: impact on PK/PD and efficacy. AAPS J. 2012;14(2):296–302. doi: 10.1208/s12248-012-9340-y. [DOI] [PMC free article] [PubMed] [Google Scholar]
- 2.Swanson SJ, Bussiere J. Immunogenicity assessment in non-clinical studies. Curr Opin Microbiol. 2012;15(3):337–347. doi: 10.1016/j.mib.2012.05.015. [DOI] [PubMed] [Google Scholar]
- 3.Lee J, et al. Bioanalytical approaches to quantify “total” and “free” therapeutic antibodies and their targets: technical challenges and PK/PD applications over the course of drug development. AAPS J. 2011;13(1):99–110. doi: 10.1208/s12248-011-9251-3. [DOI] [PMC free article] [PubMed] [Google Scholar]
- 4.Lee J, Ma H. Specificity and selectivity evaluations of ligand binding assay of protein therapeutics against concomitant drugs and related endogenous proteins. AAPS J. 2007;9(2):E164–E170. doi: 10.1208/aapsj0902018. [DOI] [PMC free article] [PubMed] [Google Scholar]
- 5.Thway TM, et al. Experimental and statistical approaches in method cross-validation to support pharmacokinetic decisions. J Pharm Biomed Anal. 2009;49(3):613–618. doi: 10.1016/j.jpba.2008.12.008. [DOI] [PubMed] [Google Scholar]
- 6.Thway TM, et al. Model-based strategy for bioanalytical method comparison: measurement of a soluble ligand as a biomarker. J Pharm Biomed Anal. 2012;58:65–70. doi: 10.1016/j.jpba.2011.09.004. [DOI] [PubMed] [Google Scholar]
- 7.Shih JY, et al. Implementation of a universal analytical method in early-stage development of human antibody therapeutics: application to pharmacokinetic assessment for candidate selection. Bioanalysis. 2012;4(19):2357–2365. doi: 10.4155/bio.12.201. [DOI] [PubMed] [Google Scholar]
- 8.Bautista AC, Salimi-Moosavi H, Jawa V. Universal immunoassay applied during early development of large molecules to understand impact of immunogenicity on biotherapeutic exposure. AAPS J. 2012;14(4):843–849. doi: 10.1208/s12248-012-9403-0. [DOI] [PMC free article] [PubMed] [Google Scholar]
- 9.White JT, Golob M, Sailstad J. Understanding and mitigating impact of immunogenicity on pharmacokinetic assays. Bioanalysis. 2011;3(16):1799–1803. doi: 10.4155/bio.11.162. [DOI] [PubMed] [Google Scholar]
- 10.Stevenson L, et al. Paradigm of combination biologics: analytical challenges related to pharmacokinetic assays and interpretation of pharmacokinetic and immunogenicity results. Bioanalysis. 2011;3(5):487–498. doi: 10.4155/bio.10.214. [DOI] [PubMed] [Google Scholar]
- 11.International Conference on Harmonisation; addendum to International Conference on Harmonisation Guidance on S6 Preclinical Safety Evaluation of Biotechnology-Derived Pharmaceuticals; availability. Notice. Fed Regist. 2012; 77(97):29665–6. [PubMed]


