

Abstract
Background
Complex molecular events lead to development and progression of liver cirrhosis to HCC. Differentially expressed nuclear membrane associated proteins are responsible for the functional and structural alteration during the progression from cirrhosis to carcinoma. Although alterations/ post translational modifications in protein expression have been extensively quantified, complementary analysis of nuclear membrane proteome changes have been limited. Deciphering the molecular mechanism that differentiate between normal and disease state may lead to identification of biomarkers for carcinoma.
Results
Many proteins displayed differential expression when nuclear membrane proteome of hepatocellular carcinoma (HCC), fibrotic liver, and HepG2 cell line were assessed using 2-DE and ESI-Q-TOF MS/MS. From the down regulated set in HCC, we have identified for the first time a 15 KDa cytochrome b5A (CYB5A), ATP synthase subunit delta (ATPD) and Hemoglobin subunit beta (HBB) with 11, 5 and 22 peptide matches respectively. Furthermore, nitrosylation studies with S-nitrosocysteine followed by immunoblotting with anti SNO-cysteine demonstrated a novel and biologically relevant post translational modification of thiols of CYB5A in HCC specimens only. Immunofluorescence images demonstrated increased protein S-nitrosylation signals in the tumor cells and fibrotic region of HCC tissues. The two other nuclear membrane proteins which were only found to be nitrosylated in case of HCC were up regulated ATP synthase subunit beta (ATPB) and down regulated HBB. The decrease in expression of CYB5A in HCC suggests their possible role in disease progression. Further insight of the functional association of the identified proteins was obtained through KEGG/ REACTOME pathway analysis databases. String 8.3 interaction network shows strong interactions with proteins at high confidence score, which is helpful in characterization of functional abnormalities that may be a causative factor of liver pathology.
Conclusion
These findings may have broader implications for understanding the mechanism of development of carcinoma. However, large scale studies will be required for further verification of their critical role in development and progression of HCC.
Keywords: Hepatocellular carcinoma, Cytochrome b5A, Two dimensional gel electrophoresis, S-nitrosylation, Proteomics, ESI-Q-TOF MS/MS mass spectrometry
Introduction
Hepatocellular carcinoma (HCC) is the third leading cause of cancer related deaths worldwide [1-4], increasing from 1.8 to 2.5 per 100,000 patients. Hepatitis B and C viral infections are well recognized underlying cause of chronic liver disease leading to HCC whereas dietary exposure to aflatoxin B1, alcoholic liver dysfunction and autoimmune hepatitis are also renowned risk factors [5-9]. The prognosis of HCC is dismal due to underlying cirrhosis as well as poor tumor response to chemotherapeutic regimens [10-12]. Opportunity for anti-cancer therapy in early stage is overlooked just because of the lack of effective biomarkers [13,14]. Complex molecular events lead to development and progression of liver cirrhosis to HCC. Deciphering the molecular mechanism that differentiates between normal and disease state may lead to identification of biomarkers for carcinoma [15,16]. Although alterations in protein expression have been extensively quantified during progression from cirrhosis to carcinoma, complementary analysis of nuclear membrane proteome changes has been limited [17].
HCC has been associated with elevated expression of inducible nitric oxide synthase (iNOS), and has been responsible for high-output production of nitric oxide (NO). Innate immune response and inflammation, NO is often highly increased at mRNA and protein levels in patients with chronic HBV and HCV [18-20], hemochromatosis and alcoholic cirrhosis [20] all of which cause predisposition to HCC [21]. Nitrosylation is essential and an important reversible post translational modification (PTM) of proteins [22-24]. It is a potential modulator of cellular processes important for tumorigenesis, apoptotic cell death and inhibition of DNA repair [25-27]. In addition to phosphorylation, DNA repair pathways are regulated at multiple levels by NO key components that depict an important role in pathogenesis of hepatocellular carcinoma [25,28-30].
Here we interrogate the differential proteome profiling in HCC tissues of clinically diagnosed HCC patients, fibrotic liver and HepG2 cell lines as controls. We explored HCC nuclear membrane CYB5A as down regulated and nitrosylated. The altered expression of CYB5A suggests that these proteins may be used as a novel prognostic factor and possibly an attractive target for HCC. CYB5A has been associated with essential cellular processes that include cytochrome P450 mediated metabolism of xenobiotics, drugs [31-34], and homeostasis of cholesterol and steroid hormone [35-37]. Involvement of CYB5A in methemoglobin to hemoglobin reduction in erythrocytes [38], and hydroxylation of N-acetyl-neuraminic acid is also observed [39]. Additionally, naturally existing fusion enzymes include mitochondrial flavocytochrome b2 (L-lactate dehydrogenase) [40], sulfite oxidase [41], the Δ 5 and Δ 6 -fatty acid desaturases (stearyl-CoA-desaturase) [42] and yeast inosi tolphosphorylceramide oxidase also contains CYB5A as a domain component [43].
Results
Differential assessment of HCC proteome
In an effort to profile differentially expressed proteomic alterations in HCV infected liver during cancer progression, we used 2-DE coupled with ESI-QTOF MS/MS to determine the relative levels of proteins across HCC and fibrotic liver.
Approximately 864 protein spots were detected on 2DE gels, out of which 76 protein spots exhibit differential expression in HCC as compared to fibrotic liver and HepG2 cell line. The quantity of each spot was normalized as a percentage of the total quantity of all gel spots. Differentially expressed proteins were defined as statistically significant on the basis of >1.5 fold up and down regulation in HCC patients compared with cell line or more changes in expression intensity (p < 0.05). Gel analysis was performed using Progenesis SameSpots v4.5 (Nonlinear Dynamic, UK). Each sample set (n = 6) was analyzed in 5 independent mass spectrometer runs.
The data revealed, for the first time, additional proteins that were dysregulated in HCC compared with fibrotic liver and HepG2 cell line. These include significantly elevated levels of ATPB, fibrinogen beta chain (FIBB), and cytochrome b-c1 complex subunit 1(QCR1). Included among the proteins that were down-regulated and not previously reported were CYB5A, ATPD and HBB well represented in Figure 1A. The protein spots were analyzed by using ESI-QTOF MS/MS. Total of six proteins along with accession no. obtained from SWISS/Prot and sequence coverage (%) refers to the percentage of protein sequence coverage, determined by number of matched peptides, and their functions were described in Table 1, Additional file 1. Due to the functional significance of CYB5A, we focused on the decreased expression of CYB5A observed in HCC as compared to fibrotic liver. The protein expression along with MS/MS spectra and matched sequence are shown in Figure 1(B-D). In order to assess the validity of data, we examined the differentially expressed CYB5A protein by western blot. The expression of CYB5A was seen to be relatively down regulated in HCC as compared to HepG2 cell line and fibrotic liver Figure 2(A-B).
Figure 1.
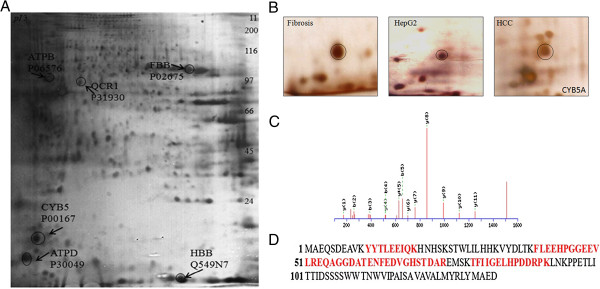
Targeting CYB5A as potential biomarker. (A): in this representative expression profile of significantly up (ATPB, FIBB, and QCR1) and down regulated (CYB5A, ATPD and HBB) proteins in HCC compared with fibrotic liver and HepG2 cell line. Focused on IPG strips pH 3–11 NL (11 cm) and separated on 12.5% gels followed by silver staining. Gel analysis was performed by using Progenesis SameSpots v4.5 (Nonlinear Dynamic, UK). The statistical analysis using Student t-test was performed and on the basis of normalized volumes spots were selected with p-values (< 0.05). (B): Representative protein spot of CYB5A (indicated by circle), showing differential expression between HCC, fibrotic liver and HepG2 cell line. The protein spots were analyzed by using ESI-QTOF MS/MS. (C): Representative MS/MS spectrum and peptide sequence of CYB5A identified by one or more high scoring peptides were considered to be true matches or with extensive homology (p < 0.05). b and y represent b ions and y ions respectively, generated during peptide fragmentation in MS/MS. (D): Amino acid sequence of CYB5A, matched peptides were expressed in red type and underline.
Table 1.
Differentially expressed HCC, fibrotic liver nuclear membrane proteins and HepG2 cell line
| Acc | Name | Abb | Thr. pI; mass | Score | Peptide matched | Cellular compartment | PTM | %age cov | Mean normalized volume fibrosis HCC /HepG2 | Ratio | Anova (P) | Fold change | |
|---|---|---|---|---|---|---|---|---|---|---|---|---|---|
| |
|
|
|
|
|
CF(1), Membrane |
|
|
|
|
|
|
|
|
P30049 |
ATP synthase subunit delta |
ATPD |
5.38; 17 |
58 |
5 |
mitochondrion |
Isopeptide bond |
17% |
0.02536 |
0.00704 |
0.277 |
0.02 |
3.6 |
| Mitochondrion |
Ubl conjugation |
|
|
|
|
|
|
||||||
| inner membrane |
|
|
|
|
|
|
|
||||||
|
P02675 |
Fibrinogen beta chain |
FIBB |
8.54; 55 |
1009 |
27 |
Secreted |
Disulfide bond |
41% |
0.03364 |
0.01628 |
0.483 |
0.05 |
2.1 |
| Glycoprotein |
|
|
|
|
|
|
|||||||
| Pyrrolidone |
|
|
|
|
|
|
|||||||
| carboxylic acid |
|
|
|
|
|
|
|||||||
|
P06576 |
ATP synthase subunit beta |
ATPB |
5.26; 56 |
670 |
18 |
CF(1), Membrane |
Acetylation |
29% |
0.03448 |
0.00913 |
0.264 |
0.04 |
3.7 |
| mitochondrion |
Phosphoprotein |
|
|
|
|
|
|
||||||
| Mitochondrion inner membrane |
|
|
|
|
|
|
|
||||||
|
Q549N7 |
Hemoglobin subunit beta |
HBB |
6.75;15 |
484 |
22 |
Heptoglobin- |
Acetylation |
61% |
0.22697 |
0.11803 |
0.520 |
0.01 |
1.9 |
| hemoglobin |
Glycation |
|
|
|
|
|
|
||||||
| complex |
Glycoprotein |
||||||||||||
| |
Phosphoprotein |
||||||||||||
| |
S-nitrosylation |
||||||||||||
|
P00167 |
Cytochrome b5 OS |
CYB5A |
4.88; 15 |
176 |
11 |
Cytoplasmic |
Acetylation |
42% |
0.01948 |
0.05883 |
3.020 |
0.04 |
3.0 |
| Endoplasmic |
|
|
|
|
|
|
|
||||||
| reticulum | |||||||||||||
| Membrane | |||||||||||||
| Microsome | |||||||||||||
| P31930 | Cytochrome b-c1 complex subunit 1 | QCR1 | 5.94; 52 | 149 | 10 | Mitochondrion |
Acetylation |
15% |
0.01607 |
0.00505 |
0.314 |
0.05 |
3.1 |
| inner membrane | Phosphoprotein | ||||||||||||
Accession no. is obtained from SWISS/Prot and percent coverage refers to the percentage of protein sequence coverage, determined by number of matched peptides. Significance was calculated from the Progenesis SameSpots v4.5 (Nonlinear Dynamic, UK), generated statistical analysis. A value of p < 0.05 was considered statistically significant. Functional classes were determined by searching the UniProt database (http://www.uniprot.org).
The proteins were separated on 2DE gels and identified by ESI-QTOF MS/MS.
Figure 2.

Immunoblot analysis confirms changes in protein expression of CYB5A. (A): representative western blot analysis of CYB5A in HCC, fibrotic liver and HepG2 cell line. For this, 100μg of nuclear membrane samples were loaded onto a 12% SDS-PAGE. Expression level was analyzed using the primary antibody CYB5A (1:1000 dilution) and horse raddish peroxidase (HRP) - conjugated secondary antibody (1: 5000 dilution). Β-actin and GAPDH were used as a loading control. (B): representative graphical expression of validated proteins by western blotting. Digital images were taken by gel documentation system (Bio-Rad). Quantification and intensity measurement of protein bands were analyzed by Quantity One gel analysis software (Bio-Rad). Statistical significance (p- value > 0.05) was calculated using SPSS statistics version 17.
CYB5A is an S-Nitrosylated protein
CYB5A a key determinant of our study was observed to be differentially S-nitrosylated in HCC, fibrotic liver and even HepG2 cell lines. An increased intensity of S- nitrosylation in the fibrotic tissue is revealed by 2-DE-IP and western blot analysis, relatively low intensity in HCC and very low in case of cell lines Figure 3(A-B) respectively.
Figure 3.
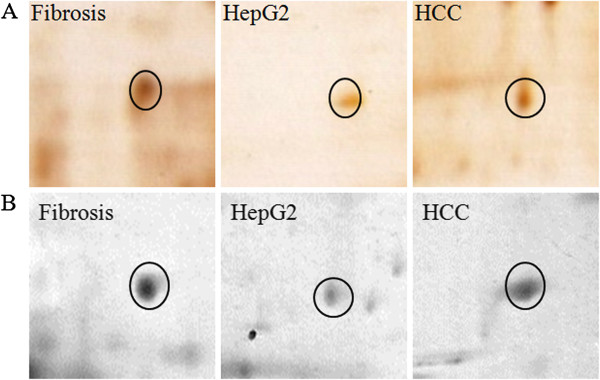
Antibody based identification of CYB5A as S-nitrosylated protein. (A): 2DE Spot representative differential expression level of CYB5A as S-nitrosylated protein in HCC compared with respective fibrotic liver and HepG2 cell line. The proteins were immuno-precipitated with anti SNO-Cys antibody, focused on IPG strips (pI 3-11NL; 7 cm) and separated on 12.5% gel followed by silver staining. (B): Representative spots of CYB5A immuno-precipitated with anti SNO-Cys antibody. 100 μg proteins were focused using pI 3-11NL (7 cm) IPG strips and separated on 12.5% gel followed by western blotting described in material and methods. Densitrometric analysis was performed using Progenesis SameSpots v4.5 (Nonlinear Dynamic, UK).
Immunohistolocalization of CYB5A
IHC analysis of the CYB5A shows significant expression in malignant hepatocytes. However, no expression was observed in portal vein Figure 4(A-B). We also studied disseminated intravascular coagulation (DIC) images, created with Adobe Photoshop CS2 images that exposed the histology and morphology of cells on the same sections. Both immunofluorescence and DIC images were stacked in Figure 4(B). All information related to microscope and camera setting is provided in the supplementary data (Additional file 2).
Figure 4.

Immunofluorescence analysis of CYB5A in HCC. The IHC image of CYB5A staining in control (A) and hepatocellular carcinoma (C &E) formalin fixed paraffin embedded (FFPE) section. The section was pre-treated using heat mediated antigen retrieval with sodium citrate buffer for 30min. The section was then incubated with CYB5A, 5 μg/ml, for 1hr at 40oC. The secondary antibody (green) was Alexa Fluor® 488 goat anti-mouse IgG (H+L) used at a 1/1000 dilution for 30min at 40oC. DAPI was used to stain the cell nuclei (blue) at a concentration of 1.43 μM. (B, D & F): combination of DIC images and IHC of control and HCC respectively, work done by Adobe Photoshop CS2. (C=Portal tract; H=Normal hepatocytes; T=Malignant hepatocytes; Original magnification= 20X). IHC: Immunohistolocalization.
Immunohistolocalization of S-nitrosylated protein
Increased S-nitrosylation signal was observed in tumor and fibrous region of HCC tissue as compared to controls Figure 5(A, B & C). A significant increase in S-nitrosylation intensity of CYB5A is also evident in this regions (Tumor and Fibrosis), revealed by immunofluorescence images Figure 5(C, D & E). The results presents a massive disruption of lobular manner, portal tract expansion with inflammatory cells in the sinusoids, lymphoid aggregate and hepatocellular apoptosis in the regions with hyper S-nitrosylation signals. The histological and morphological defects were assessed in these regions using Hemotoxylin and Eosin (H&E) staining prior to the immunoflorescence analysis.
Figure 5.

Evidence of S-nitrosylation in HCC: Increased S-nitrosylation is evident in the fibrous portion and tumor cells in HCC. Anti SNO-Cys antibody was used to reveal the distribution of S-nitrosylation signals in the HCC and controls. Significant increase CYB5A is also evident in both fibrous and tumor cells similar to S-nitrosylation. Figure A &D represents control liver on the other side B, C, E, F explained strong S- nitrosylation signals in HCC.
The predicted functional association network of CYB5A
The functional association network of the identified proteins was generated through protein interaction network STRING 8.3. The interaction patterns will be helpful to have a better understanding of the protein functional activities. As the identified proteins are involved in various cellular/metabolic pathways the close interaction pattern, evident with the high confidence score > 0.7 are helpful to explicate disease related consequences due to structural and functional perturbations of the expressed protein Figure 6. CYB5A is a membrane bound hemoprotein strongly interacting with its class member CYB4R3 (cytochrome b5 reductase 3), CYP17A1 (Cytochrome P450 family 17, subfamily A, polypeptide 1), CYP3A5 (Cytochrome P450 family 3, subfamily A, polypeptide 5). Possible strong interaction with FADS2 (fatty acid desaturase 2), SCD (stearoyl-CoA desaturase), ACSL1, L2, L3 and L4 (acyl-CoA synthetase, long chain family member 1, 2, 3and 4 respectively) are also observed Figure 6.
Figure 6.
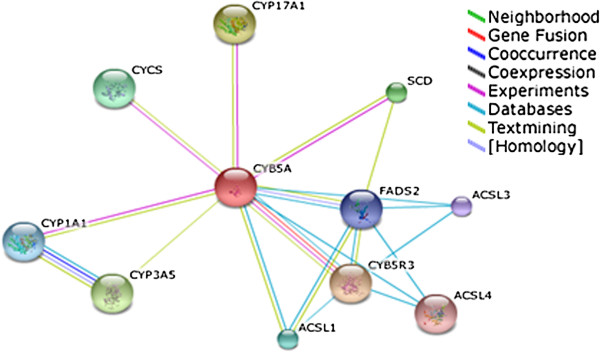
Functional association network of CYB5A. High-confidence protein-protein interaction network of identified nuclear membrane proteins derived from the STRING database (http://string-db.org/). Each protein is represented as a node with edged interactions. (CYB4R3: cytochrome b5 reductase 3; CYP17A1: Cytochrome P450 family 17 subfamily A polypeptide 1; CYP3A5: cytochrome P450 family 3, subfamily A, polypeptide 5; FADS2: fatty acid desaturase 2; SCD: stearoyl-CoA desaturase; ACSL1, L2, L3 and L4: acyl-CoA synthetase, long chain family member 1, 2, 3 and 4 respectively).
Pathway enrichment analysis related to HCC pathology
Having validated our Mass spectrometry result of CYB5A, we delineated the biological function associated with this elevated protein alterations based on the known protein functions according to SWISS-PROT (http://www.expasy.org), classifications provided in the KEGG database (http://www.genome.jp/kegg), GO annotation (http://www.geneontology.org), Reactome, Uniprot, ENSEMBL, PINC analysis pathway and Panther classification system. This process allowed us to identify pathways that are deregulated during HCC development and progression. This exercise revealed the involvment of CYB5A in vitamin C (ascorbate) metabolism, metabolism of water-soluble vitamins and cofactors, metabolism of vitamins and cofactors, transport, L-ascorbic acid metabolic process, electron transport chain, small molecule metabolic process, aldo-keto reductase (NADP) activity, amino sugar and nucleotide sugar metabolism http://www.reactome.org.
Discussion
The current study identifies novel nuclear membrane biomarkers for HCC. Out of 76 differentially expressed proteins, six proteins ATPD, FIBB, ATPB, HBB, CYB5A, and QCR1 were quantified across the specimens and delineated into liver fibrosis and carcinoma specific proteins. CYB5A trapped our main focused not only because of lack of information regarding its sub cellular location and down regulation in nuclear membrane of HCC compared to fibrotic liver and HepG2 cell lines, but also because of S-nitrosylation of this protein. Interestingly, CYB5A is characterized by the presence of 3 well-defined phosphorylation sites as demonstrated by the insilico analysis (NetPhosK 1.0). It is likely that incomplete phosphorylation, (may be due to nitrosylation) i.e. not all monomers are phosphorylated, may interfere with protein function. Emerging data suggests that CYB5A and other nuclear proteins are involved in HCC progression [44-46]. Further study will be required to clarify how phosphorylation and nitrosylation influence HCC and the consequent expression of proteins.
Validation by western blotting, immunoprecipitation and immunohistochemical studies revealed the characterized pattern in malignant cells and nuclei but was absent in portal tract. These results allow us to propose sub cellular localization of CYB5A as down regulated nuclear membrane protein with a mechanism proposed in various pathophysiological conditions as aberrant S-nitrosylation, caused by altered NO production. So we can say that, decreased expression could leave the liver predisposed to the oncogenic effects of nitrosative stress. Additional study is needed to determine whether NO production induces post-translational modifications of protein and modulates protein function in HCC cell. However, due to the absence of cysteine residue in the CYB5A protein sequence, we propose that the other thiol groups are nitrosylated in the studied HCC specimens.
Understanding towards the disease progression requires complete knowledge interrelated to different pathways and their involvement with the altered proteins.
We conducted STRING 8.3 generated patterns which demonstrated direct interaction of these metabolic proteins with other associated proteins, CYB4R3, CYP17A1, CYP3A5 FADS2 SCD and ACSL1, has an essential role in the oxidative reaction, anabolic metabolism of fat and steroids, catabolism of xenobiotics and endogenous metabolism [47]. It also has a rather complex interaction with Cytochrome P450 and stimulates its related metabolism [33,48,49].
Insilico studies revealed the role of CYB5A in aldo-keto reductase (NADP) activity, cytochrome-c oxidase activity, enzyme binding, heme binding as reflected by the KEGG/REACTOME pathway analysis. Its involvement in respiratory electron transport chain, lipid metabolic pathway was further elaborated by Panther classification (http://www.panther.com). Several lines of evidence provide insight into potential mechanism by which CYB5A may affect HCC progression and associated pathological condition [25,27]. In our case, the presence of 15 -KDa CYB5A fragment in the HCC specimens compared to fibrotic liver and HepG2 cell lines clearly indicates the possible role of this protein in cancer progression. The novel discovery of a membrane protein CYB5A down regulation and its localization coupled with the observation of intense nitrosylation signals in the regional architecture of cirrhotic tissue strongly suggests a major role of CYB5A in the physiology and pathophysiology of HCC.
Conclusion
Our study suggests that nuclear membrane proteins may have a role in progression from fibrosis to liver carcinogenesis. The molecular mechanisms controlling CYB5A expression and function are of paramount importance. Moreover, target protein activation may be influenced by nitrosylation, might represent a mechanism insuring that a cirrhotic tissue development process was underway where CYB5A and other different proteins can be applied to post translation regulation. In this regard recent studies are beginning to establish biochemical connections between different proteins and cell signaling molecules. Further work must be performed to determine whether these changes are essential and appropriate for HCC diagnosis and prognosis.
Material and methods
Tissue procurement
The Institutional Review Board of University of Kansas Medical Center (USA) and University of Karachi, Pakistan approved this study on discovery of nuclear membrane proteome of liver cancer. Well characterized HCV-associated HCC liver tissues (n = 50) were by Kansas Medical Center (KUMC) Liver Bank, USA and Karachi hospitals [male 25 age in mean + SD 53 ± 7.06); female = 25 (51.1 ± 3.35)] while the fibrotic liver tissue [n = 65; male = 45 (49.4 ± 5.8) & female = 20 (47.4 ± 5.4)] were collected only from Karachi, Pakistan with confirmed clinical and genotype report. Tissues were snap-frozen in dry ice and stored at −80°C.
Extraction of protein from HCV infected liver
For protein extraction, samples [HCC (n = 50) fibrotic liver (n = 65)] were immersed into PBS (phosphate buffer saline) buffer and washed. Homogenized in adequate volume of homogenization medium (0.25 M sucrose and 10 mM HEPES, pH 7.5), and centrifuged at 1000xg for 10 min. The pellet and supernatant were collected and the supernatant resuspended with buffer A (0.3 M sucrose, 50 mM tris, and 3 mM MgCl2, pH 7.5) and buffer B (1.98 M sucrose, 50 mM tris, 1 mM MgCl2, pH 7.5), centrifuged at 70,000xg for 90 min (Optima L-100 XP, Beckman Coulter, USA).Protease (Cocktail tablet, Roche, Germany) and phosphatase inhibitors (0.2 mM sodium orthovanidate Na3Vo4 and 1 mM sodium fluoride NaF) were added at every step [17]. The pellet containing nuclei fraction was collected and resuspended in lysis buffer (7 M urea, 2 M thiourea, 4% CHAPS, 30 mM tris-Cl, pH 8.5, protease inhibitor mixture), stored at −80°C. Total protein content was measured using the Bradford protein assay.
Cell culture and cell lysis
HepG2 cell line grown in Dulbecco’s modified Eagle medium (DMEM) containing 10% fetal calf serum (FCS) was used. Briefly, cells were rinsed with DMEM and removed from the flask by incubating with a solution containing trypsin (0.5 g/l) and EDTA (0.2 g/l). The cells were detached from the surface of the flask by squirting the solution onto the cells. The suspension was centrifuged at 1000xg for 5 min and the cells washed with DMEM without FCS. After centrifugation and removal of DMEM, cells were mixed and solubilized. The cells were washed twice by centrifugation in PBS and transferred to sterile tubes for storage at −80°C until further analysis.
Two dimensional gel electrophoresis (2DE)
Isoelectric focusing was performed on Multiphor II system (Amersham GE-Health, Sweden). Briefly, 300 μg nuclear membrane protein of HCC, fibrotic liver and HepG2 cell line were dissolved in rehydration buffer (7 M urea, 2 M Thiourea, 4% CHAPS (3-[(3-cholamidopropyl) dimethylammonio]-1-propanesulfonate), 0.2% Ampholyte, 15 mM DTT (Dithiothreitol) and trace amount of bromophenol blue) and applied to IPG strips (11 cm, pH 3–10, NL) allowing to rehydrate overnight. The focusing was carried out at 20°C, following gradient change in voltage: 500 V for 1 h, gradient up to 1000 V over 1 h, gradient to 5000 V over 1 h, and focusing was continued at 5000 V for 8.5 h to give a total of 64kVh. Later the IPG strips were subjected to a two step reduction and alkylation by equilibrating the strips for 20 min in 50 mM Tris–HCl, pH 8.8, 6 M urea, 30% glycerol, 2% SDS, bromophenol blue, and 0.5% DTT, followed by another 20 min in 50 mM Tris–HCl, pH 8.8, 6 M urea, 30% glycerol, 2% SDS (sodium dodecyl sulphate), bromophenol blue and 4.5% iodoacetamide (IAA) at room temperature. Second dimension was conducted in 1 mm thick 12.5% polyacrylamide gels at 100 V for 6 h. The gels were visualized by silver staining [50], each sample were performed in triplicate. Digital images of the gels were taken by gel documentation system (BioRad, USA).
Western blotting
Nuclear fractionated proteins (100 μg) were transferred electrophoretically (100 V for 4 hr) onto PVDF (Polyvinylidene fluoride) membrane (Amersham, GE Health, Sweden). The membranes were blocked with 5% BSA (bovine serum albumin) for 1 h at 4°C and incubated overnight with primary antibody anti- cytochrome b5A (ABCAM-UK) (1:1000 dilutions). The blots were washed three times with TBST (Tris-buffered saline with Tween) buffer and incubated for 1 hr at 4°C with goat polyclonal rabbit IgG (ABCAM-UK) (1: 5000 dilutions). Immunoblots signals were developed by chromomeric substrate-3, 3’-diaminobenzidine (DAB, Sigma-UK).
Immunoprecipitation and 2DE (IP-2DE)
Tissue homogenates were prepared with hand homogenizer (Pyrex, Japan) by suspending the tissues in lysis buffer (7 M urea, 2 M thiourea, 0.4% CHAPS) `containing protease and phosphatase inhibitors (Roche, Germany). Sepharose G beads suspension (50 μl) (Protein-G sepharose 4 fast Flow, GE Healthcare, Life Sciences, Sweden), was centrifuged at 2000–3000 rpm for 2 min. The pellet was mixed with 450 μl HEPES (4-(2-hydroxyethyl)-1-piperazineethanesulfonic acid) buffer (50 mM HEPES pH 7.6, 200 mM NaCl, 0.4% CHAPS) and centrifuged again. The washing steps were repeated four times and HEPES buffer (450 μl) was added to the pellet and vortex again. Protein extract (0.4 mg/ml) was diluted with HEPES buffer to a final volume of 300 μl and washed protein G sepharose (200 μl) was added and incubated for 30 min at 4°C with continuous shaking. The sample was then centrifuged at 13000 rpm at 4°C for 5 min. The supernatant was incubated overnight with 5 μl of anti-S-nitroso-cysteine (SNO-Cys) antibody (ABCAM, UK) at 4°C. Activated protein G sepharose beads (140 μl) was added and mixed for 4 h at 4°C with continuous shaking and centrifuged for 2-3 min at 15000 rpm (4°C). The pellet was washed with HEPES buffer, four times and mixed with 140 μl lysis buffer (7 M urea, 2 M thiourea, 0.4% CHAPS, 1%Ampholyte) for 1 h with continuous shaking at room temperature. The sample was centrifuged at 13000 rpm at 4°C for 5 min and the pull-down was solubilized in rehydration buffer and separated by 2DE on 7 cm pH 3–10 NL immobilized pH gradients (IPG) strips. The strips were rehydrated overnight at room temperature. Isoelectric focusing was started at 500 V for 1 h, 1000 V for 1 h with gradual increase to 5000 V and kept constant for a total of 12000Vh. The gel strips equilibration and second dimension was performed as mentioned above.
Immunoblotting using S-nitrosothiol specific antibody
Total protein extracts were also used for immunoblotting using SNO-Cys antibody. 100 μg protein was dissolved in rehydration buffer and IPG strips (7 cm, 3–10 NL) were rehydrated overnight. 2-DE was performed according to the same procedure as in section of Immuno-precipitation (IP-2D). The separated proteins were electrotransferred to PVDF membranes at 30 mA for 2 h on Wet Blot (Bio-Rad, USA) that later blocked with 5% TBST/milk for 1 h at room temperature. After blocking reaction, the blot was incubated in anti SNO-Cys antibody (1:2000) overnight at 4°C. Secondary antibody goat anti rabbit IgG HRP was applied (1:1000) for 1 h. The blots were thoroughly washed and developed with ECL (Amersham GE), detected on exposure film (Amersham GE, Sweden) and scanned with Canon flatbed scanner (Canon, UK).
Imaging and statistical analysis
Gels were analyzed by Progenesis SameSpots v4.5 (Nonlinear Dynamic, UK) according to manufacture recommendation. Protein spots that were differentially expressed in tissue specimen and cell line were marked. Only spots altered consistently were selected for identification. Statistical analysis was performed using the SPSS statistics version 17.
Immunofluorescence Staining
After de-paraffinization and rehydration by xylol different percentage of isopropanol, heat induced antigen retrieval was performed by immersing HCC liver section slides in a pre-heated steamer containing citrate buffer (95-100°C) for 30 min. Sections were blocked with Roti block (Roth, Karlsruhe, Germany) with 1:10 dilution, later washed with PBS (Phosphate buffer saline) and incubated with anti CYB5A antibody (ABCAM, UK) for 1 h at 40°C. After several steps washing membrane was incubated with secondary antibody, Alexa 488 anti-rabbit (ScantaCruze, California) for 30 min. Another slide of same samples were incubated with anti SNO-Cys antibody for 1 hr at 40°C followed by incubation with secondary antibody, Alexa 488 anti-rabbit for 1 h while nuclei were stained with DAPI for 2 min. Microscopic examination was performed on Eclipse TE2000E epi-flourescence microscope (Nikon, Japan). Images were acquired by DS-Qi1 processed using NIS-Elements software (Nikon Japan).
Protein identification by electrospray ionization quadrupole time of flight tandem mass spectrometry (ESI-QTOF MS/MS)
Peptide analyses were carried out on an ESI-QTOF-tandem MS system (Waters) and in-gel digestion was performed as described [51] with slight modification. Briefly, gel slices were destained with the mixture of 15 mM K3Fe (CN)6 and 50 mM Na2S2O3, washed with deionized water and dehydrated with ACN. The spots were incubated with 100 mM ammonium bicarbonate, washed again and vacuum dried. Proteins were in-gel digested with sequencing grade modified trypsin (The slices were rehydrated for digestion with 40 μl trypsin (10 ng/ μl in 100 mM ammonium bicarbonate, pH 7.4; Promega, Mannhein, Germany) for 45 min. Excess trypsin solution was removed and the volume replaced with 100 mM ammonium bicarbonate without trypsin) overnight at 37°C. Tryptic peptides were extracted with 50% ACN/ 0.1% TFA with moderate sonication for 15 min. The extracted solutions were pooled, vacuum dried and re-dissolved in 0.1% TFA followed by injecting to the Q-TOF Ultima Global mass spectrometer (Micromass, Manchester, UK) as described before [52].
The data were acquired with the MassLynx (v 4.0) software on a Windows NT PC and further processed using ProteinLynx Global Server (PLGS, v 2.2, Micromass, Manchester, UK) as PKL (peak list) under the following settings; Electrospray, centroid 80% with minimum peak width 4 channel, noise reduction 10%, Savitzky-Golay, MSMS, medium deisotoping with 3% threshold, no noise reduction and no smoothing. The peak lists were searched using the online MASCOT (http://www.matrixscience.com) algorithm against the SwissProt 55.5 (389046 sequences; 139778124 residues).
The data were retrieved against the whole database with search parameters set as follows: enzyme, trypsin; allowance of up to one missed cleavage peptide; mass tolerance ±0.5 Da and MS/MS tolerance ±0.5 Da; modifications of cysteine carboamidomethylation and methionine oxidation when appropriate with auto hits allowed only significant hits to be reported.
Protein data Set and pathway enrichment analysis
Swiss-Prot accession numbers of identified differentially expressed membrane proteins, retrieved by MASCOT were used to investigate similarities in protein expression alterations between stages. To investigate enrichment of specific pathways in the altered/PTMed protein expression data set, “WEB-based GEneSeTAnaLysis Toolkit” (WEBGESTALT) at http://bioinfo.vanderbilt.edu/webgestalt/ was used [53]. Protein expression changes are not isolated events, we therefore hypothesized that differentially expressed CYB5A protein may interact with others and play a role in oncogenesis. STRING 8.3 (http://string-db.org/) was used to explore the biological associations among the differentially expressed proteins [54].
Abbreviations
HCC: Hepatocellular carcinoma; ESI-Q-TOF MS/MS: Electrospray ionization quadrupole time of flight tandem mass spectrometry; CYB5A: Cytochrome b5A; ATPD: ATP synthase subunit delta; HBB: Hemoglobin subunit beta; KEGG: Kyoto encyclopedia of genes and genomes; iNOS: Nitric oxide synthase; PTM: Post translational modification; FIBB: Fibrinogen beta chain; QCR1: Cytochrome b-c1 complex subunit 1; CYB4R3: Cytochrome b5 reductase 3; CYP17A1: Cytochrome P450 family 17, subfamily A, polypeptide 1; CYP3A5: Cytochrome P450 family 3, subfamily A, polypeptide 5; FADS2: Fatty acid desaturase 2; SCD: Stearoyl-CoA desaturase; ACSL: Acyl-CoA synthetase; NO: Nitric oxide.
Competing interests
The authors declare that they have no competing interests.
Authors’ contributions
NA and MAR designed the study, experiments, acquisition of data and finalized the manuscript. RK performed all experimental work (two dimensional electrophoresis, Immunohistochemistry, western blotting, MS), data analysis, interpretation and draft of the manuscript. YJYW, JF, ABAK and AMN provided samples and clinical data. AZ provided lab facility. SZ involved in S-nitrosylation technique development. All authors read and approved the final manuscript.
Supplementary Material
Expression graphs and MS/MS of differentially expressed proteins in HCC along with peptide sequence identified.
Microscope and Camera Setting.
Contributor Information
Rizma Khan, Email: rizmakhan@ymail.com.
Saadia Zahid, Email: saadiazahid@hotmail.com.
Yu-Jui Yvonne Wan, Email: yjywan@ucdavis.edu.
Jameson Forster, Email: jforster@kumc.edu.
A-Bashar Abdul Karim, Email: babdulkarim@kumc.edu.
Atta M Nawabi, Email: anawabi@kumc.edu.
Abid Azhar, Email: abid.azhar@kibge.edu.pk.
M Ataur Rahman, Email: marahman_ku@yahoo.com.
Nikhat Ahmed, Email: nikhat_ahmed14@yahoo.co.uk.
Acknowledgments
The authors gratefully acknowledged excellent technical assistance and expert opinion regarding ESI-QTOF MS/MS provided by AR Asif (Department of Clinical Chemistry, University Medical Center Goettingen, Goettingen, Germany) and the working facility provided by KIBGE, University of Karachi. The work was fully supported by the Higher Education Commission (HEC), Pakistan Grant No. 725 to MA. R and N A.
References
- Llovet JM, Burroughs A, Bruix J. Hepatocellular carcinoma. Lancet. 2003;10:1907–1917. doi: 10.1016/S0140-6736(03)14964-1. [DOI] [PubMed] [Google Scholar]
- Okuda K. Hepatocellular carcinoma. J Hepatol. 2000;10:225–237. doi: 10.1016/s0168-8278(00)80428-6. [DOI] [PubMed] [Google Scholar]
- El-Serag HB, Mason AC. Rising incidence of hepatocellular carcinoma in the United States. N Engl J Med. 1999;10:745–750. doi: 10.1056/NEJM199903113401001. [DOI] [PubMed] [Google Scholar]
- Di Bisceglie AM, Simpson LH, Lotze MT, Hoofnagle JH. Development of hepatocellular carcinoma among patients with chronic liver disease due to hepatitis C viral infection. J Clin Gastroenterol. 1994;10:222–226. doi: 10.1097/00004836-199410000-00011. [DOI] [PubMed] [Google Scholar]
- Marquardt JU, Galle PR, Teufel A. Hepatocellular carcinoma: molecular pathogenesis and novel targets for therapy. Dtsch Med Wochenschr. 2012;10:855–860. doi: 10.1055/s-0032-1304843. [DOI] [PubMed] [Google Scholar]
- el Tazi M, Essadi I, M'rabti H, Touyar A, Errihani PH. Systemic treatment and targeted therapy in patients with advanced hepatocellular carcinoma. N Am J Med Sci. 2011;10:167–175. doi: 10.4297/najms.2011.3167. [DOI] [PMC free article] [PubMed] [Google Scholar]
- Dumpis U, Kovalova Z, Jansons J, Cupane L, Sominskaya I, Michailova M, Karayiannis P, Gardovska D, Viazov S, Ross S, Roggendorf M, Pumpens P. An outbreak of HBV and HCV infection in a paediatric oncology ward: epidemiological investigations and prevention of further spread. J Med Virol. 2003;10:331–338. doi: 10.1002/jmv.10293. [DOI] [PubMed] [Google Scholar]
- Seow TK, Liang RC, Leow CK, Chung MC. Hepatocellular carcinoma: from bedside to proteomics. Proteomics. 2001;10:1249–1263. doi: 10.1002/1615-9861(200110)1:10<1249::AID-PROT1249>3.0.CO;2-1. [DOI] [PubMed] [Google Scholar]
- Shin BK, Hong W, Hanash S. Proteomics approaches to uncover the repertoire of circulating biomarkers for breast cancer. J Mammary Gland Biol Neoplasia. 2002;10:407–413. doi: 10.1023/A:1024038132381. [DOI] [PubMed] [Google Scholar]
- Song P, Tobe RG, Inagaki Y, Kokudo N, Hasegawa K, Sugawara Y, Tang W. The management of hepatocellular carcinoma around the world: a comparison of guidelines from 2001 to 2011. Liver Int. 2012;10:1053–1063. doi: 10.1111/j.1478-3231.2012.02792.x. [DOI] [PubMed] [Google Scholar]
- Steel LF, Mattu TS, Mehta A, Hebestreit H, Dwek R, Evans AA, London WT, Block T. A proteomic approach for the discovery of early detection markers of hepatocellular carcinoma. Dis Markers. 2001;10:179–189. doi: 10.1155/2001/963023. [DOI] [PMC free article] [PubMed] [Google Scholar]
- Berg T, von Wagner M, Nasser S, Sarrazin C, Heintges T, Gerlach T, Buggisch P, Goeser T, Rasenack J, Pape GR, Schmidt WE, Kallinowski B, Klinker H, Spengler U, Martus P, Alshuth U, Zeuzem S. Extended treatment duration for hepatitis C virus type 1: comparing 48 versus 72 weeks of peginterferon-alfa-2a plus ribavirin. Gastroenterology. 2006;10:1086–1097. doi: 10.1053/j.gastro.2006.02.015. [DOI] [PubMed] [Google Scholar]
- Zhou G, Li H, DeCamp D, Chen S, Shu H, Gong Y, Flaig M, Gillespie JW, Hu N, Taylor PR, Emmert-Buck MR, Liotta LA, Petricoin EF 3rd, Zhao Y. 2D differential in-gel electrophoresis for the identification of esophageal scans cell cancer-specific protein markers. Mol Cell Proteomics. 2002;10:117–124. doi: 10.1074/mcp.M100015-MCP200. [DOI] [PubMed] [Google Scholar]
- Mínguez B, Lachenmayer A. Diagnostic and prognostic molecular markers in hepatocellular carcinoma. Dis Marker. 2011;10:181–190. doi: 10.1155/2011/310675. [DOI] [PMC free article] [PubMed] [Google Scholar]
- Chan DW, Colantonio DA. Clinical proteomics:cancer diagnostics? J Clin Ligand Assay. 2005;10:35–37. [Google Scholar]
- Zhang Z, Chan DW. Cancer proteomics:in pursuit of “true” biomarker discovery. (Editorial). cancer epidemiol. Biomark Prevent. 2005;10:2283–2286. doi: 10.1158/1055-9965.EPI-05-0774. [DOI] [PubMed] [Google Scholar]
- Song Y, Hao Y, Sun A, Li T, Li W, Guo L, Yan Y, Geng C, Chen N, Zhong F, Wei H, Jiang Y, He F. Sample preparation project for the subcellular proteome of mouse liver. Proteomics. 2006;10:5269–5277. doi: 10.1002/pmic.200500893. [DOI] [PubMed] [Google Scholar]
- Lee TY, Chen YJ, Lu TC, Huang HD, Chen YJ. SNOSite: exploiting maximal dependence decomposition to identify cysteine S-nitrosylation with substrate site specificity. PLoSOne. 2011;10:e21849. doi: 10.1371/journal.pone.0021849. [DOI] [PMC free article] [PubMed] [Google Scholar]
- Majano PL, García-Monzón C, López-Cabrera M, Lara-Pezzi E, Fernández-Ruiz E, García-Iglesias C, Borque MJ, Moreno-Otero R. Inducible nitric oxide synthase expression in chronic viral hepatitis. Evidence for a virus-induced gene upregulation. J Clin Invest. 1998;10:1343–1352. doi: 10.1172/JCI774. [DOI] [PMC free article] [PubMed] [Google Scholar]
- Rahman MA, Dhar DK, Yamaguchi E, Maruyama S, Sato T, Hayashi H, Ono T, Yamanoi A, Kohno H, Nagasue N. Coexpression of inducible nitric oxide synthase and COX-2 in hepatocellular carcinoma and surrounding liver: possible involvement of COX-2 in the angiogenesis of hepatitis C virus- positive cases. Clin Cancer Res. 2001;10:1325–1332. [PubMed] [Google Scholar]
- Hussain SP, Raja K, Amstad PA, Sawyer M, Trudel LJ, Wogan GN, Hofseth LJ, Shields PG, Billiar TR, Trautwein C, Hohler T, Galle PR, Phillips DH, Markin R, Marrogi AJ, Harris CC. Increased p53 mutation load in nontumorous human liver of wilson disease and hemochromatosis: oxyradical overload diseases. Proc Natl Acad Sci USA. 2000;10:12770–12775. doi: 10.1073/pnas.220416097. [DOI] [PMC free article] [PubMed] [Google Scholar]
- Bogdan C. Nitric oxide and the immune response. Nat Immunol. 2001;10:907–916. doi: 10.1038/ni1001-907. [DOI] [PubMed] [Google Scholar]
- Gaston B, Singel D, Doctor A, Stamler JS. S -nitrosothiol signaling in respiratory biology. Am J Respir Crit Care Med. 2006;10:1186–1193. doi: 10.1164/rccm.200510-1584PP. [DOI] [PMC free article] [PubMed] [Google Scholar]
- Foster MW, Hess DT, Stamler JS. Protein S - nitrosylation in health and disease: a current perspective. Trends Mol Med. 2009;10:391–404. doi: 10.1016/j.molmed.2009.06.007. [DOI] [PMC free article] [PubMed] [Google Scholar]
- Wei W, Li B, Hanes MA, Kakar S, Chen X, Liu L. S -nitrosylation from GSNOR deficiency impairs DNA repair and promotes hepatocarcinogenesis. Sci Transl Med. 2010;10(19):19ra13. doi: 10.1126/scitranslmed.3000328. [DOI] [PMC free article] [PubMed] [Google Scholar]
- Hess DT, Matsumoto A, Kim SO, Marshall HE, Stamler JS. Protein S-nitrosylation: purview and parameters. Nat Rev Mol Cell Biol. 2005;10:150–166. doi: 10.1038/nrm1569. [DOI] [PubMed] [Google Scholar]
- Liu L, Xu-Welliver M, Kanugula S, Pegg AE. Inactivation and degradation of O(6)-alkylguanine-DNA alkyltransferase after reaction with nitric oxide. Cancer Res. 2002;10:3037–3043. [PubMed] [Google Scholar]
- Fukumura D, Kashiwagi S, Jain RK. The role of nitric oxide in tumour progression. Nat Rev Cancer. 2006;10:521–534. doi: 10.1038/nrc1910. [DOI] [PubMed] [Google Scholar]
- Pedrazzini E, Villa A, Longhi R, Bulbarelli A, Borgese N. Mechanism of residence of cytochrome b(5), a tail-anchored protein, in the endoplasmic reticulum. J Cell Biol. 2000;10:899–914. doi: 10.1083/jcb.148.5.899. [DOI] [PMC free article] [PubMed] [Google Scholar]
- Pandey AV, Miller WL. Regulation of 17, 20 lyase activity by cytochrome b5 and by serine phosphorylation of P450c17. J Biol Chem. 2005;10:13265–13271. doi: 10.1074/jbc.M414673200. [DOI] [PubMed] [Google Scholar]
- Stringer RA, Strain-Damerell C, Nicklin P, Houston JB. Evaluation of recombinant cytochrome P450 enzymes as an in vitro system for metabolic clearance predictions. Drug Metab Dispos. 2009;10:1025–1034. doi: 10.1124/dmd.108.024810. [DOI] [PubMed] [Google Scholar]
- Schenkman JB, Jansson I. The many roles of cytochrome b5. Pharmacol Ther. 2003;10:139–152. doi: 10.1016/S0163-7258(02)00327-3. [DOI] [PubMed] [Google Scholar]
- Porter TD. The roles of cytochrome b5 in cytochrome P450 reactions. J Biochem Mol Toxicol. 2002;10:311–316. doi: 10.1002/jbt.10052. [DOI] [PubMed] [Google Scholar]
- Yamazaki H, Nakamura M, Komatsu T, Ohyama K, Hatanaka N, Asahi S, Shimada N, Guengerich FP, Shimada T, Nakajima M, Yokoi T. Roles of nadph-p450 reductase and apo- and holo-cytochrome b5 on xenobiotics oxidations catalyzed by 12 recombinant human cytochrome p450s expressed in membranes of Escherichia coli. Protein Expr Purif. 2002;10:329–337. doi: 10.1006/prep.2001.1578. [DOI] [PubMed] [Google Scholar]
- Miller WL, Auchus RJ. The molecular biology, biochemistry, and physiology of human steroidogenesis and its disorders. Endocr Rev. 2011;10:81–151. doi: 10.1210/er.2010-0013. [DOI] [PMC free article] [PubMed] [Google Scholar]
- Blanc M, Hsieh WY, Robertson KA, Watterson S, Shui G, Lacaze P, Khondoker M, Dickinson P, Sing G, RodrÃguez-MartÃn S, Phelan P, Forster T, Strobl B, Muller M, Riemersma R, Osborne T, Wenk MR, Angulo A, Ghazal P. Host defense against viral infection involves interferon mediated down-regulation of sterol biosynthesis. PLoS Biol. 2011;10:e1000598. doi: 10.1371/journal.pbio.1000598. [DOI] [PMC free article] [PubMed] [Google Scholar]
- Finn RD, McLaughlin LA, Hughes C, Song C, Henderson CJ, RolandWolf C. Cytochrome b null mouse: a new model for studying inherited skin disorders and the role of unsaturated fattyacids in normal homeostasis. Transgenic Res. 2011;10:491–502. doi: 10.1007/s11248-010-9426-1. [DOI] [PMC free article] [PubMed] [Google Scholar]
- Abe K, Kimura S, Kizawa R, Anan FK, Sugita Y. Amino acid sequences of cytochrome b5 from human, porcine, and bovine erythrocytes and comparison with liver microsomal cytochrome b5. J Biochem. 1985;10:1659–1668. doi: 10.1093/oxfordjournals.jbchem.a135224. [DOI] [PubMed] [Google Scholar]
- Takematsu H, Kawano T, Koyama S, Kozutsumi Y, Suzuki A, Kawasaki T. Reaction mechanism underlying CMP-N-acetylneuraminic acid hydroxylation in mouse liver: formation of a ternary complex of cytochrome b5, CMP-N-acetylneuraminic acid, and a hydroxylation enzyme. J Biochem. 1994;10:381–386. doi: 10.1093/oxfordjournals.jbchem.a124347. [DOI] [PubMed] [Google Scholar]
- Guiard B, Groudinsky O, Lederer F. Homology between bakers’ yeast cytochrome b2 and liver microsomal cytochrome b5. Proc Natl Acad Sci USA. 1974;10:2539–2543. doi: 10.1073/pnas.71.6.2539. [DOI] [PMC free article] [PubMed] [Google Scholar]
- Guiard B, Lederer F. The “b5-like” domain from chicken- liver sulfite oxidase: a new case of common ancestral origin with liver cytochrome b5 and bakers’ yeast cytochrome b5 core. Eur J Biochem. 1977;10:181–190. doi: 10.1111/j.1432-1033.1977.tb11379.x. [DOI] [PubMed] [Google Scholar]
- Yantsevich AV, Gilep AA, Usanov SA. Mechanism of electron transfer in fusion protein cytochrome b5–NADH_cytochrome b5 reductase. Biochemistry (Mosc) 2008;10:1096–1107. doi: 10.1134/S0006297908100052. [DOI] [PubMed] [Google Scholar]
- Dunn TM, Haak D, Monaghan E, Beeler TJ. Synthesis of monohydroxylated inositolphosphorylceramide (IPC-C) in Saccharomyces cerevisiae requires Scs7p, a protein with both a cytochrome b5-like domain and a hydroxylase/desaturase domain. Yeast. 1998;10:311–321. doi: 10.1002/(SICI)1097-0061(19980315)14:4<311::AID-YEA220>3.0.CO;2-B. [DOI] [PubMed] [Google Scholar]
- Wai PY, Kuo PC. Intersecting pathways in inflammation and cancer: Hepatocellular carcinoma as a paradigm. World J Clin Oncol. 2012;10:15–23. doi: 10.5306/wjco.v3.i2.15. [DOI] [PMC free article] [PubMed] [Google Scholar]
- Hanash SM. Biomedical applications of two dimensional electrophoresis using immobilized pH gradients: Current status. Electrophoresis. 2000;10:1202–1209. doi: 10.1002/(SICI)1522-2683(20000401)21:6<1202::AID-ELPS1202>3.0.CO;2-I. [DOI] [PubMed] [Google Scholar]
- Reymond MA, Sanchez JC, Hughes GJ, Günther K, Riese J, Tortola S, Peinado MA, Kirchner T, Hohenberger W, Hochstrasser DF, Köckerling F. Standardized characterization of gene expression in human colorectal epithelium by two dimensional electrophoresis. Electrophoresis. 1997;10:842–848. doi: 10.1002/elps.1150181520. [DOI] [PubMed] [Google Scholar]
- Keyes SR, Alfano JA, Jansson I, Cinti DL. Rat liver microsomal elongation of fattyacids. J Biochem. 1979;10:7778–7784. [PubMed] [Google Scholar]
- Gan L, von Moltke LL, Trepanier LA, Harmatz JS, Greenblatt DJ, Court MH. Role of NADPH-cytochrome P450 reductase and cytochrome-b5/NADH-b5 reductase in variability of CYP3A activity in human liver microsomes. Drug Metab Dispos. 2009;10:90–96. doi: 10.1124/dmd.108.023424. [DOI] [PMC free article] [PubMed] [Google Scholar]
- Lewis DF, Ito Y. Human cytochromes P450 in the metabolism of drugs: new molecular models of enzyme-substrate interactions. Expert Opin Drug Metab Toxicol. 2008;10:1181–1186. doi: 10.1517/17425255.4.9.1181. [DOI] [PubMed] [Google Scholar]
- Blum H, Beier H, Gross HJ. Silver staining of proteins in polyacrylamide gels. Electrophoresis. 1987;10:93–99. doi: 10.1002/elps.1150080203. [DOI] [Google Scholar]
- Shevchenko A, Wilm M, Vorm O, Mann M. Mass spectrometric sequencing of proteins silver-stained polyacrylamide gels. Anal Chem. 1996;10:850–858. doi: 10.1021/ac950914h. [DOI] [PubMed] [Google Scholar]
- Asif AR, Oellerich M, Amstrong VW, Gross U, Reichard U. Analysis of the cellular Aspergillusfumigatus proteome that reacts with sera from rabbits developing an acquired immunity after experimental aspergillosis. Electrophoresis. 2010;10:1947–1958. doi: 10.1002/elps.201000015. [DOI] [PubMed] [Google Scholar]
- Zhang B, Kirov S, Snoddy J. WebGestalt: an integrated system for exploring gene sets in various biological contexts. Nucleic Acids Res. 2005;10:741–748. doi: 10.1093/nar/gki475. [DOI] [PMC free article] [PubMed] [Google Scholar]
- Jensen LJ, Kuhn M, Stark M, Chaffron S, Creevey C, Muller J, Doerks T, Julien P, Roth A, Simonovic M, Bork P, von Mering C. STRING 8-a global view on proteins and their functional interactions in 630 organisms. Nucleic Acids Res. 2009;10:412–416. doi: 10.1093/nar/gkn760. [DOI] [PMC free article] [PubMed] [Google Scholar]
Associated Data
This section collects any data citations, data availability statements, or supplementary materials included in this article.
Supplementary Materials
Expression graphs and MS/MS of differentially expressed proteins in HCC along with peptide sequence identified.
Microscope and Camera Setting.