Abstract
Objectives
To test the hypothesis that the amount and distribution of glaucomatous damage along the entire retinal ganglion cell–axonal complex (RGC-AC) can be quantified and to map the RGC-AC connectivity in early glaucoma using automated image analysis of standard spectral-domain optical coherence tomography.
Methods
Spectral-domain optical coherence tomography volumes were obtained from 116 eyes in 58 consecutive patients with glaucoma or suspected glaucoma. Layer and optic nerve head (ONH) analysis was performed; the mean regional retinal ganglion cell layer thickness (68 regions), nerve fiber layer (NFL) thickness (120 regions), and ONH rim area (12 wedge-shaped regions) were determined. Maps of RGC-AC connectivity were created using maximum correlation between regions’ ganglion cell layer thickness, NFL thickness, and ONH rim area; for retinal nerve fiber bundle regions, the maximum “thickness correlation paths” were determined.
Results
The mean (SD) NFL thickness and ganglion cell layer thickness across all macular regions were 22.5 (7.5) μm and 33.9 (8.4) μm, respectively. The mean (SD) rim area across all ONH wedge regions was 0.038 (0.004) mm2. Connectivity maps were obtained successfully and showed typical nerve fiber bundle connectivity of the RGC-AC cell body segment to the initial NFL axonal segment, of the initial to the final RGC-AC NFL axonal segments, of the final RGC-AC NFL axonal to the ONH axonal segment, and of the RGC-AC cell body segment to the ONH axonal segment.
Conclusions
In early glaucoma, the amount and distribution of glaucomatous damage along the entire RGC-AC can be quantified and mapped using automated image analysis of standard spectral-domain optical coherence tomography. Our findings should contribute to better detection and improved management of glaucoma.
Glaucoma causes degeneration of the retinal ganglion cell, including axons at the optic nerve head (ONH) and the retinal ganglion cell axons in the nerve fiber bundles (NFBs), and at the retinal ganglion soma via apoptotic cell death.1 We define the retinal ganglion cell–axonal complex (RGC-AC) as a set of neighboring ganglion cells in the retinal ganglion cell layer (GCL), together with their axons, forming an NFB in the retinal nerve fiber layer (NFL) until their exit from the eye in the ONH. An RGC-AC has multiple segments, including a cell body segment located in the retinal GCL, multiple NFB segments located in the retinal NFL between the cell body and the ONH, and an ONH segment located in the neural rim of the ONH. The distribution and path of the RGC-AC have been studied by visually examining the histologic structure of stained retina2–5 and of its NFB part by examining patterns of visual field defects.6,7 More recently, Jansonius et al8 mathematically modeled the NFB trajectories using manual tracings in fundus photographs of patients with glaucoma. Detailed knowledge of the exact amount and distribution of glaucomatous damage to the entire RGC-AC is required for a topographically precise prediction of circumscribed visual field loss and has the potential to improve the diagnosis and management of glaucoma.9
Spectral-domain optical coherence tomography (SD-OCT) allows unprecedented 3-dimensional spatial resolution at specific retinal locations relevant to the RGC-AC. In particular, using automated 3-dimensional image analysis in patients with glaucoma, ONH cupping can be quantified,10,11 NFB defects can be quantified with 2-dimensional NFL thickness at macular and peripapillary locations,12 and retinal ganglion cell degeneration can be quantified from GCL thickness.12,13
We hypothesized that the amount and distribution of glaucomatous damage along the entire RGC-AC can be quantified or mapped using automated 3-dimensional image analysis of standard SD-OCT. A necessary condition to confirm this hypothesis is that focal damage to the RGC-AC cell body segments, NFB segments, and axons in the ONH can be detected and quantified at each location with sufficient precision. The objectives of this study were to test this hypothesis and to map the amount and distribution of glaucomatous damage along the entire RGC-AC in patients with glaucoma or suspected glaucoma using automated image analysis of SD-OCT.
METHODS
PARTICIPANTS
Patient data were obtained prospectively in both eyes. The study participants were recruited consecutively from the outpatient glaucoma service at the University of Iowa. Patients with primary and secondary (pigmentary or exfoliative) open-angle glaucoma or suspected glaucoma were included in the study; patients with angle-closure and combined mechanism glaucoma were excluded. Glaucoma was defined as optic disc cupping consistent with glaucoma (diffuse or focal thinning of the neu-roretinal rim or NFL defects) and visual field defects consistent with optic disc cupping, with or without elevated intraocular pressure. Suspected glaucoma was defined as ocular hypertension (> 21 mm Hg) without evidence of glaucomatous optic neuropathy or suspicious optic discs (vertical cup-disc ratio > 0.7 or > 0.2 asymmetry between fellow eyes) with normal visual fields (Humphrey 24-2 SITA [Swedish Interactive Thresholding Algorithm]; Carl Zeiss Meditec),14 defined as glaucoma hemifield test results within normal limits with normal (P > .05) global indexes (mean deviation and pattern standard deviation).
Fifty-eight consecutive patients were included (mean [SD] age, 62.9 [12.5] years), and 20 of 58 (34%) were male. The study cohort included 54 patients of white race/ethnicity, 3 African American, and 1 Hispanic. Of 58 patients, 31 were diagnosed as having glaucoma, and 27 had suspected glaucoma. The Humphrey visual field analyzer mean (SD) deviation was −1.90 (3.03) dB, and the mean (SD) pattern standard deviation was 3.29 (2.97) dB. The study was approved by the institutional review board of the University of Iowa and adhered to the tenets of the Declaration of Helsinki; all participants gave written informed consent.
IMAGE ACQUISITION
Two macula-centered and 2 ONH-centered SD-OCT volumes (Cirrus; Carl Zeiss Meditec) were acquired (2×2 volumes per patient). Each SD-OCT volume was 200 × 200 × 1024 voxels, corresponding to dimensions of 6 × 6 × 2 mm3. Only patients with acceptable quality of both macular and peripapillary OCT images (with signal strength ≥ 5) were included in the study.
The mean (SD) NFL thickness on a circle with a diameter of 3.46 mm centered at the optic disc from the analysis provided by the manufacturer (version 5.1) was 77.3 (13.9) μm. The mean (SD) rim area and cup-disc ratio provided by the manufacturer were 0.97 (0.30) mm2 and 0.65 (0.14), respectively.
Both eyes from 58 patients were used in the analysis, and left eye images were flipped in a standard fashion. As such, the presented results are based on analysis of 232 SD-OCT volumes. Macular and peripapillary SD-OCT volumes were registered for each patient along the x-axis and y-axis with a previously published algorithm15 using the similarity transformation, including translation, rotation, and scaling.
MACULAR, PERIMACULAR, AND ONH GRIDS AND COMPUTATION OF REGION VARIABLES
The following 3 grids were used to divide the macular and ONH images into regions that are functionally and structurally relevant and suitable for analysis: the NFB grid, the macular grid, and the ONH grid, shown in Figure 1. The NFB grid, with 120 square regions, is shown in white. To compensate for the individual differences in the distance between the fovea and the optic disc, the size of the regions differed slightly among patients based on a scaling factor d (defined as the distance between the fovea and the center of the neural canal opening [NCO] for each individual patient). The width and height of the NFB grid are defined in terms of d as follows: 7.2 mm times (2/3)d mm divided by 3.0 mm and 6.0 mm times (2/3)d mm divided by 3.0 mm, respectively, where (2/3)d mm divided by 3.0 mm is a ratio. The macular grid consists of a subset of 68 regions of the NFB grid and resembles the visual field grid (Humphrey 10−2); it is shown in cyan. The ONH grid, centered on the NCO center, is composed of 12 wedge-shaped regions; each subtending 15° rim region is shown in green. Grids are slightly rotated based on the axis between the fovea and the NCO center, which decreased the thickness variability in preliminary studies.
Figure 1.
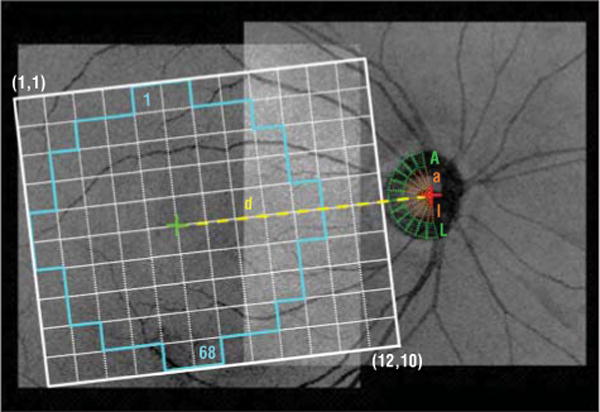
Registered projection image overlaid with the nerve fiber bundle grid showing regions (1, 1) through (12, 10) (white), the macular grid (regions 1–68 [cyan]), the optic nerve head grid that includes the optic cup regions (regions a through l [orange]), and the optic nerve head wedge regions (regions A through L [green]). The green and red cross marks show the foveal center and the neural canal opening centroid, respectively. The nerve fiber bundle grid has been slightly tilted, which decreased the thickness variability in preliminary studies. The scaling factor d is the distance between the fovea and the center of the neural canal opening.
Automated Segmentation of Intraretinal Layers
Within each of the macular volumes, 11 surfaces were segmented in 3 dimensions using a previously published graph-theoretic approach.12 Five of these surfaces (Figure 2) were used to define the NFL (between surfaces 1 and 2), the GCL (between surfaces 2 and 3), and the combined layer of the outer segment and the retinal pigment epithelium complex (between surfaces 7 and 11).
Figure 2.
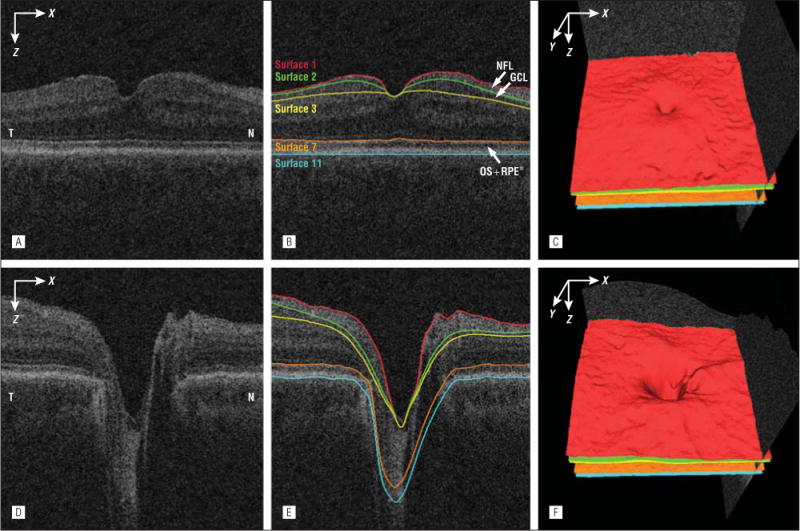
Segmentation of the nerve fiber layer (NFL), ganglion cell layer (GCL) and combined layer of the outer segment (OS) and retinal pigment epithelium (RPE) from macular and peripapillary spectral-domain optical coherence tomography volumes. A, Flattened and cropped B-scan image of the macular spectral-domain optical coherence tomography volume. B, Image A overlaid with the layer segmentation results. C, Three-dimensional rendering of the surfaces segmented in B. D, Flattened and cropped B-scan image of the peripapillary spectral-domain optical coherence tomography volume. E, Image D overlaid with the layer segmentation results. F, Three-dimensional rendering of the surfaces segmented in image E. N indicates nasal; RPE*, RPE complex; and T, temporal
Quantification of ONH Grid Variables
Within each ONH-centered SD-OCT volume, the NCO was segmented by finding the boundary at the level of the retinal pigment epithelium-Bruch membrane complex using a 2-dimen-sional graph search method.10 The ONH rim tissue surface projection and the optic disc cup were detected with a voxel column classification algorithm using features of retinal morphologic structure and OCT voxel intensities.11,16 The final neu-roretinal rim was estimated by excluding the cup area from the NCO area. An OCT projection image was created by averaging in the z direction (A-scan) the OCT subvolume between surfaces 7 and 11. Figure 3 shows the segmentation results of the optic cup, neuroretinal rim, and NCO from the peripapillary SD-OCT volume in the B-scan and projection images. The fovea location was estimated as the A-scan with the smallest distance between surfaces 1 and 7 in the z direction; the center of the NCO was estimated as its centroid. The regional mean rim width was calculated by averaging the distances between the inner and outer rim boundaries in each ONH grid region. The regional rim area was the area of the rim in each region. The regional rim volume was the OCT subvolume in the neuroretinal rim segmentation between surface 1 (internal limiting membrane) and the reference surface fitted to surface 11 (outer boundary of the retinal pigment epithelium), excluding the NCO region. The regional cup-NCO ratio was calculated by dividing the regional optic cup area by the sum of the regional optic cup and neuroretinal rim areas.
Figure 3.
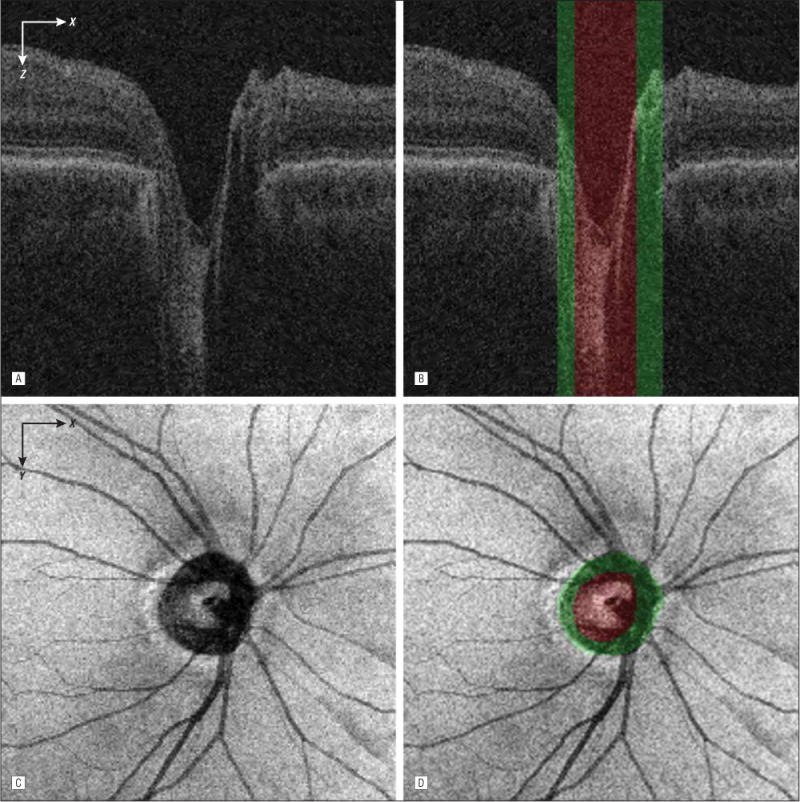
Segmentation of the optic cup, neuroretinal rim, and neural canal opening from the peripapillary spectral-domain optical coherence tomography volume. A, Flattened and cropped B-scan image. B, Image A overlaid with the cup (green regions) and rim (red region) segmentation results. The neural canal opening segmentation result is the combined region of the cup and rim. C, Spectral-domain optical coherence tomography projection image. D, Image C overlaid with the cup and rim segmentation results.
Quantification of GCL and NFB Grid Variables
The mean GCL thickness and NFL thickness for each macular NFB grid region were estimated from registered macular and peripapillary SD-OCT volumes using the macular grid and the NFB grid, respectively. The regional mean GCL thickness was measured by averaging the GCL thickness for all A-scans in a grid region and similarly for the mean NFL thickness. The regional mean GCL thickness and NFL thickness in regions that overlapped (in macular and ONH SD-OCT volumes) were the mean of the regions in both volumes after registration.
MAPPING THE CONNECTIVITY OF THE GCL TO THE ONH NEURAL RIM
The only assumption for mapping the connectivity of the GCL to the ONH neural rim is that the RGC-AC segment in the GCL is connected to the RGC-AC segment within the ONH (which makes up the neural rim). For each macular region, we determined the correlation of its GCL thickness with the rim area of each of 12 ONH wedge-shaped regions and selected the ONH region that has the highest correlation. For each of 68 local macular regions on the grid, we computed the squared Pearson product moment correlation coefficients (r2 values) of GCL thickness with each of 12 ONH wedge-shaped regions’ rim width, rim area, rim volume, and cup-NCO ratio. The wedge-shaped region for each of the ONH measures with the highest r2 value is selected as the ONH wedge region most closely associated with the damage to the macular GCL region under study. The connectivity map is created by displaying each of 12 ONH wedge regions with a separate color and by coloring each of 68 macu-lar regions with the wedge color selected for it.
MAPPING THE CONNECTIVITY OF THE GCL TO THE INITIAL NFB SEGMENT AND THE FINAL NFB SEGMENT TO THE ONH NEURAL RIM
We also mapped the connectivity of the GCL to the initial NFB segment and the final NFB segment to the ONH neural rim. The only assumptions for this mapping are that the RGC-AC cell body segment in the GCL is connected to at least 1 “nearby” initial RGC-AC NFB segment somewhere in the NFL (in the macula or even outside [and a single NFB region may be connected to multiple GCL regions]) and that the final RGC-AC NFB segment in the macula is connected to an RGC-AC segment within the ONH (which makes up the neural rim). For each GCL region, we determined the correlation to the 5×5 neighboring NFB regions’ NFL thickness and then selected the NFB region with maximum correlation. In other words, for each region we test its association with the 25 closest NFB regions, determining the maximum r2 value between each regional mean GCL thickness and its 5 × 5 neighboring regional mean NFL thicknesses. The region at (x, y) with regional mean GCL thickness GCL (x, y) is associated with the region at (x + i, y + j) (where i and j indicate the x- and y-directional displacement of the regional mean NFL thickness, respectively) with regional mean NFL thickness NFL (x + i, y + j), if and only if GCL (x, y) and NFL (x + i, y + j) had the maximum r2 values of all pairwise Pearson product moment correlation coefficients, where (1 ≤ x, x + i ≤ 12; 1 ≤ y, y + j ≤ 10; −2 ≤ i, j ≤ 2). The connectivity map is created by drawing an arrow from the center of each GCL region to the center of its associated NFL region as already determined, with the r2 value coded in color. Similarly, to map the connectivity of the RGC-AC final NFB segment to the RGC-AC ONH neural rim segment, we correlate the regional NFL thickness of the most nasal NFB regions to the rim area of the ONH wedge regions.
MAPPING THE CONNECTIVITY OF THE NFBs
The only assumptions for mapping the connectivity of the NFBs are that each RGC-AC NFB segment is connected to at least 1 other RGC-AC NFB segment and that the final NFB segment is the most nasal column of the NFB regions. Otherwise, no assumptions are made about the location, trajectory, shape, or path of the RGC-AC NFB segments. For each NFB region, we located the path of neighboring NFB regions (ie, RGC-AC segments) that had the highest cumulative correlation among all possible RGC-AC paths. The most nasal regions were excluded from this computation. We use an A graph search method17 that is capable of finding an optimal path with the minimum “cost” (highest r2 value) from a starting node to one of the ending nodes. Each region of the NFB grid represents a “node” in the graph; starting nodes were node (x, y) (1 ≤ x ≤ 11, 1 ≤ y ≤ 10), and ending nodes were node (x, y) (x = 12, 1 ≤ y ≤ 10). Using arcs, a graph was constructed by connecting node (x, y) with nodes (x + 1, y−2), (x + 1, y −1), (x + 1, y), (x + 1,y + 1), and (x + 1, y + 2) (1 ≤ x ≤ 11; 1 ≤ y−2, y−1, y, y + 1, y + 2 ≤ 10). The cost of each edge in the graph was calculated as follows: Cost (a, b) = 1-r2(a, b), where r2(a, b) is the Pearson product moment correlation coefficient of the regional mean NFL thickness between nodes a and b. The connectivity map is created by displaying the minimum cost path for each NFL region as a line, with the color corresponding to the magnitude of the r2 value.
RESULTS
The mean (SD) scaling factor d (distance between the center of the fovea and the center of the NCO) was 4.16 (0.34) mm. The mean (SD) NFL thickness and GCL thickness across all macular regions were 22.5 (7.5) μm and 33.9 (8.4) μm, respectively. The mean (SD) rim width, rim area, rim volume, and cup-disc ratio across all ONH wedge regions were 138.1 (40.6) μm, 0.038 (0.004) mm2, 0.0067 (0.0021) mm3, and 0.711 (0.030), respectively.
The mean (SD) maximum r2 value between the regional GCL thickness and the ONH rim area was 0.147 (0.078) (range, 0.035–0.350). The mean (SD) maximum r2 values for patients with glaucoma and suspected glaucoma were 0.123 (0.052) and 0.091 (0.046), respectively. Figure 4 shows the emergent RGC-AC connectivity maps calculated for the cell body segment of the RGC-AC (in the GCL) to the ONH neural rim segment of the RGC-AC. Figure 5 shows the scatterplots for each region of GCL thickness and the rim area of all ONH rim wedges.
Figure 4.
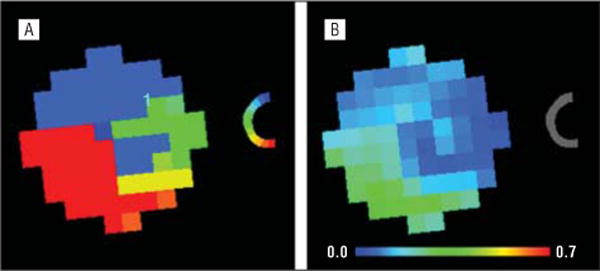
Retinal ganglion cell–axonal complex connectivity maps for the cell body segment (in the ganglion cell layer) to the optic nerve head neural rim segment. Shown are color-coded correspondence (A) and highest r2 value (B) maps.
Figure 5.
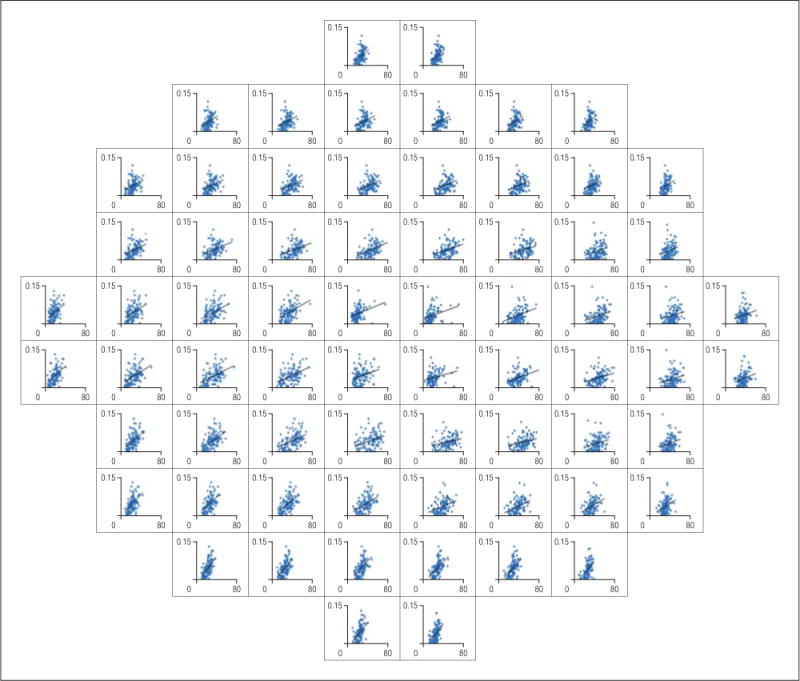
Scatterplots for the highest r2 values between the regional mean macular ganglion cell layer thickness (x-axis, 0–80 μm) and the regional optic nerve head rim area (y-axis, 0–0.15 mm2).
The mean (SD) maximum r2 value between the macu-lar regional GCL thickness and the neighboring regional NFL thickness was 0.358 (0.171) (range, 0.012–0.661). The mean (SD) maximum r2 values for patients with glaucoma and suspected glaucoma were 0.406 (0.154) and 0.293 (0.182), respectively. Figure 6A shows the emergent RGC-AC connectivity maps calculated for the cell body segment of the RGC-AC to the initial NFB segment of the RGC-AC.
Figure 6.
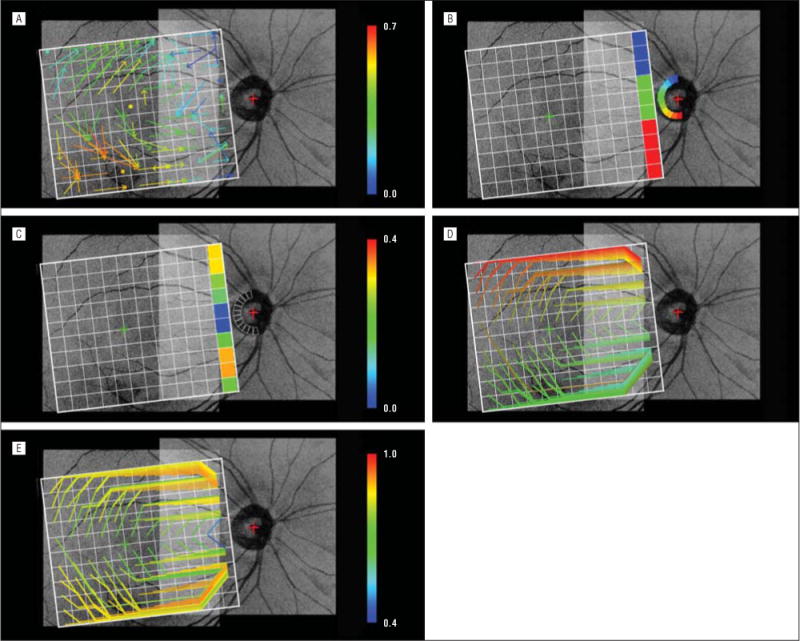
Emergent retinal ganglion cell–axonal complex connectivity maps overlaid on a registered projection image from a single patient for illustrative purposes. A, Connectivity from the macular ganglion cell layer regions to “close” initial nerve fiber bundle regions. The arrow starting in each macular grid region ends at one of 5 × 5 neighboring nerve fiber bundle grid regions that exhibits the maximum Pearson product moment correlation coefficient as indicated by the color of the arrow. A dot located in a specific grid square denotes that the highest correlation was between the macular and nerve fiber bundle regions in the same location. B, Connectivity from the most nasal nerve fiber bundle regions to the optic nerve head wedge regions. The nerve fiber bundle region and the optic nerve head wedge region exhibiting the maximum r2 values are coded with the same color. C, Same as B except that the pseudocolors show their maximum r2 value D, Connectivity of individual nerve fiber bundle regions (retinal ganglion cell–axonal complex segments in the nerve fiber layer) from the initial (anywhere in the nerve fiber bundle grid) to the most nasal nerve fiber bundle grid regions. The line starting from each nerve fiber bundle grid region (except for the most nasal regions) and ending at one of the most nasal nerve fiber bundle regions is the minimum cost path, or the highest overall correlation among all possible nerve fiber bundle segment nerve fiber layer thicknesses. The color shows the starting position in the nerve fiber bundle grid. The top and bottom paths follow the top and bottom boundaries of the nerve fiber bundle grid because information is available outside the registered spectral-domain optical coherence tomography images. E, Same as D except that the color shows the aggregate Pearson product moment correlation coefficient of the nerve fiber bundle region nerve fiber layer thicknesses.
The mean (SD) maximum r2 value between the NFL thickness of the most nasal NFB regions and the rim area of the ONH wedges was 0.136 (0.086) (range, 0.013–0.336). The mean (SD) maximum r2 values for patients with glaucoma and suspected glaucoma were 0.169 (0.102) and 0.160 (0.075), respectively. Figure 6B shows the emergent RGC-AC connectivity maps calculated for the most nasal NFB segment of the RGC-AC and the ONH segment of the RGC-AC. Figure 6C shows their maximum r2 values.
An A* graph search for each of 110 NFB regions using regional NFL thickness, excluding the 10 most nasal regions, found 1 minimum cost path for each, resulting in 110 minimum cost paths. The mean (SD) maximum r2 value of these paths was 0.833 (0.078) (range, 0.439–0.925). The mean (SD) maximum r2 values for patients with glaucoma and suspected glaucoma were 0.836 (0.088) and 0.805 (0.059), respectively. Figure 6D shows the emergent RGC-AC connectivity maps calculated for the entire (initial to final) NFB segments of the RGC-AC. Figure 6E shows the magnitude of the correlation for these maximum correlation NFB paths.
COMMENT
Our results show that retinal ganglion cell body damage in glaucoma is accompanied by corresponding nerve fiber and ONH axonal loss. In addition, we demonstrate that the amount and distribution of glaucomatous damage along the entire RGC-AC can be quantified and mapped using automated image analysis of standard SD-OCT.
We find it striking how RGC-AC connectivity maps emerge “spontaneously” using these methods based on minimum rudimentary anatomic assumptions. These emergent structural maps display the course of the RGC-ACs from their origin in a region of the retinal GCL, following a specific path along the NFB in the NFL and ending up in a specific region of the ONH (the limit of visibility on SD-OCT). These paths are similar to the distribution of NFBs established from histologically stained retina2–5 and from patterns of visual field defects6,7 (NFBs only). The map is constructed from structural thickness correlations along the RGC-AC using the following assumptions: (1) the segment of the RGC-AC that is in the GCL projects to a limited number of 25 close NFL regions, (2) the NFB segments of the RGC-AC each connect to at least 1 neighboring segment, and (3) the most nasal NFB segments of the RGC-AC are connected to the segment of the RGC-AC that is in the ONH.
As expected, the structural correlation within the RGC-AC was greater in patients with glaucoma than in patients with suspected glaucoma. The most obvious explanation is that tissue loss and thinning also progress as glaucoma advances, leading to increasing structural correlation as additional RGC-ACs are damaged by the disease.
The emergence of the connectivity maps from glaucomatous damage supports the notion that the RGC-AC manifests damage along its entire retinal pathway (ie, all segments). This suggests that, if the ganglion cell bodies in a specific RGC-AC are affected, the axonal segments that form the retinal NFB are also affected, as is the segment within the ONH, because otherwise the connectivity would not emerge from our correlation analysis. Our results also suggest that the damage seems to be limited to specific RGC-ACs (the RGC, NFB, and ONH paths), while others remain intact, at least in our patients with early stages of the disease (Humphrey visual field analyzer mean deviation of −1.90 dB and mean pattern standard deviation of 3.29 dB).
The results are based on the analysis of 116 eyes in 58 consecutive patients with glaucoma or suspected glaucoma. When left eye or right eye images were analyzed independently, the obtained patterns were similar to those in Figure 6 but exhibited higher levels of noise. A comparison of left eye results vs results of both eyes (Figure 7) shows that using both eyes did not change the general form of the relationships but clearly contributed to less noisy correlations.
Figure 7.
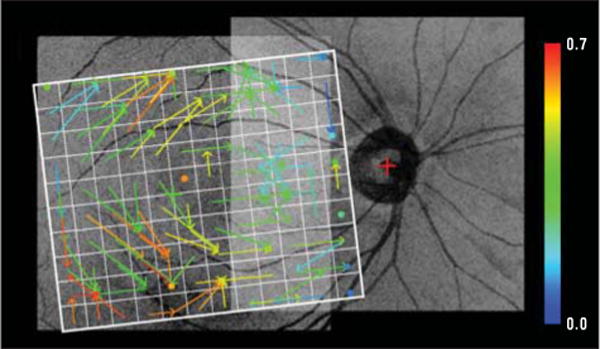
Connectivity map from the macular regions to the initial nerve fiber bundle regions as in Figure 6A but based on left eye spectral-domain optical coherence tomography data only. The overall pattern of connections is similar to that shown in Figure 6A, but the connectivity is more noisy based on half the data as in Figure 6A. Similar results were obtained for the left eye only that corresponded to the other panels in Figure 6.
Accumulating evidence suggests that GCL layer thickness correlates well with glaucomatous damage. Recently, investigators have reported thinner macular inner retinal layers in patients with suspected glaucoma compared with healthy control subjects.18 Schulze et al19 found significant reduction of ganglion cell complex layer thickness in the macula among patients with glaucoma compared with healthy control subjects or patients with ocular hypertension. They also reported that cup-disc ratio and retinal nerve fiber layer mean thickness were good discriminators between the study groups. Kim et al20 found differences in ganglion cell complex loss between study groups with primary open-angle glaucoma vs normal-tension glaucoma. Garas et al21 showed that retinal nerve fiber layer and ganglion cell complex variables have moderate sensitivity with high specificity for detecting glaucoma. Other investigators have correlated structural changes with visual function. Horn et al22 divided the visual field and peripapillary NFL circle into 6 regions and found good correlation between corresponding areas of function and structure using SD-OCT. Hood and Raza23 and Raza et al24 recently reported good correlation of macular GCL thickness with a corresponding visual field map within the central 7.2° when retinal ganglion cell displacement around the fovea was taken into account.
Our results have practical clinical implications. So far, investigations have shown low correlation of structural damage measures with measures of functional damage, such as visual field thresholds. Because of the high correspondence of structural damage measures along the RGC-AC, combining the structural measures along the entire RGC-AC has the potential for more reliable and robust assessment of the structural changes and for better correlation with functional measures.
There are several limitations to this study. First, the size of each SD-OCT volume was limited to 6 × 6 mm2, which is too small to cover both the macular and ONH regions, and the 2 images needed to be registered. Large SD-OCT volumes with isotropic spatial resolution in the x direction and y direction would allow measurements without registration of SD-OCT volumes. Second, the GCL was partially truncated in several macular SD-OCT volumes. In these cases, the GCL thickness was excluded in the truncated SD-OCT regions. No truncation was observed in the NCO regions of the peripapillary SD-OCT volumes. Third, motion artifacts between 2 adjacent B-scan images of the SD-OCT volume contribute to errors in measurement of the variables. After overcoming these limitations, a more accurate measurement would be possible. An ongoing study25 of imaging retinal NFBs is using OCT with adaptive optics, providing higher image resolution than current commercial OCT machines. Such an increase in image resolution may help determine the distribution of NFBs in individual patients.
In summary, among patients with early glaucoma or suspected glaucoma, retinal ganglion cell body damage is accompanied by corresponding nerve fiber and ONH axonal loss. The amount and distribution of glaucomatous damage along the entire RGC-AC can be quantified and mapped using automated image analysis of standard SD-OCT. Our findings should contribute to better detection and improved management of glaucoma.
Acknowledgments
Funding/Support: This study is supported by grants EY018853, R01 EY019112, and R01 EB004640 from the National Institutes of Health and by the Department of Veterans Affairs, Research to Prevent Blindness, an American Glaucoma Society Midcareer Physician Scientist Award (Dr Kwon), and the Marlene S. and Leonard A. Hadley Glaucoma Research Fund.
Footnotes
Author Contributions: Drs Lee, Sonka, and Abràmoff had full access to all the data in the study and take responsibility for the integrity of the data and the accuracy of the data analysis.
Financial Disclosure: Drs Garvin, Sonka, and Abràmoff are inventors of the graph-theoretic approach used to segment the intraretinal layers in this work, for which a patent application exists.
Additional Contributions: Marilyn E. Long, BS, acquired and organized the imaging data, and Zhihong Hu, PhD, segmented the neural canal openings.
References
- 1.Danias J, Shen F, Kavalarakis M, et al. Characterization of retinal damage in the episcleral vein cauterization rat glaucoma model. Exp Eye Res. 2006;82(2):219–228. doi: 10.1016/j.exer.2005.06.013. [DOI] [PMC free article] [PubMed] [Google Scholar]
- 2.Fitzgibbon T, Reese BE. Organization of retinal ganglion cell axons in the optic fiber layer and nerve of fetal ferrets. Vis Neurosci. 1996;13(5):847–861. doi: 10.1017/s095252380000910x. [DOI] [PubMed] [Google Scholar]
- 3.Fitzgibbon T, Taylor SF. Retinotopy of the human retinal nerve fibre layer and optic nerve head. J Comp Neurol. 1996;375(2):238–251. doi: 10.1002/(SICI)1096-9861(19961111)375:2<238::AID-CNE5>3.0.CO;2-3. [DOI] [PubMed] [Google Scholar]
- 4.Ballantyne A. The nerve fiber pattern of the human retina. Trans Ophthalmol Soc U K. 1947;66:179–191. [Google Scholar]
- 5.Vrabec F. The temporal raphe of the human retina. Am J Ophthalmol. 1966;62(5):926–938. doi: 10.1016/0002-9394(66)91920-9. [DOI] [PubMed] [Google Scholar]
- 6.Weber J, Ulrich H. A perimetric nerve fiber bundle map. Int Ophthalmol. 1991;15(3):193–200. doi: 10.1007/BF00153928. [DOI] [PubMed] [Google Scholar]
- 7.Garway-Heath DF, Poinoosawmy D, Fitzke FW, Hitchings RA. Mapping the visual field to the optic disc in normal tension glaucoma eyes. Ophthalmology. 2000;107(10):1809–1815. doi: 10.1016/s0161-6420(00)00284-0. [DOI] [PubMed] [Google Scholar]
- 8.Jansonius NM, Nevalainen J, Selig B, et al. A mathematical description of nerve fiber bundle trajectories and their variability in the human retina. Vision Res. 2009;49(17):2157–2163. doi: 10.1016/j.visres.2009.04.029. [DOI] [PMC free article] [PubMed] [Google Scholar]
- 9.Chauhan BC, McCormick TA, Nicolela MT, LeBlanc RP. Optic disc and visual field changes in a prospective longitudinal study of patients with glaucoma: comparison of scanning laser tomography with conventional perimetry and optic disc photography. Arch Ophthalmol. 2001;119(10):1492–1499. doi: 10.1001/archopht.119.10.1492. [DOI] [PubMed] [Google Scholar]
- 10.Hu Z, Abràmoff MD, Kwon YH, Lee K, Garvin MK. Automated segmentation of neural canal opening and optic cup in 3D spectral optical coherence tomography volumes of the optic nerve head. Invest Ophthalmol Vis Sci. 2010;51(11):5708–5717. doi: 10.1167/iovs.09-4838. [DOI] [PMC free article] [PubMed] [Google Scholar]
- 11.Abràmoff MD, Lee K, Niemeijer M, et al. Automated segmentation of the cup and rim from spectral domain OCT of the optic nerve head. Invest Ophthalmol Vis Sci. 2009;50(12):5778–5784. doi: 10.1167/iovs.09-3790. [DOI] [PMC free article] [PubMed] [Google Scholar]
- 12.Garvin MK, Abràmoff MD, Wu X, Russell SR, Burns TL, Sonka M. Automated 3-D intraretinal layer segmentation of macular spectral-domain optical coherence tomography images. IEEE Trans Med Imaging. 2009;28(9):1436–1447. doi: 10.1109/TMI.2009.2016958. [DOI] [PMC free article] [PubMed] [Google Scholar]
- 13.Abràmoff MD, Garvin MK, Sonka M. Retinal imaging and image analysis. IEEE Rev Biomed Eng. 2010;3:169–208. doi: 10.1109/RBME.2010.2084567. [DOI] [PMC free article] [PubMed] [Google Scholar]
- 14.Kwon YH, Adix M, Zimmerman MB, et al. Variance owing to observer, repeat imaging, and fundus camera type on cup-to-disc ratio estimates by stereo planimetry. J Glaucoma. 2009;18(4):305–310. doi: 10.1097/IJG.0b013e318181545e. [DOI] [PubMed] [Google Scholar]
- 15.Niemeijer M, Garvin MK, Lee K, van Ginneken B, Abràmoff MD, Sonka M. Registration of 3-D spectral OCT volumes using 3D SIFT feature point matching. Proc SPIE. 2009;7259:e7259-1I. http://spiedigitallibrary.org/proceedings/resource/2/psisdg/7259/1/72591I_1?isAuthorized=noAccessed March 12, 2012. [Google Scholar]
- 16.Lee K, Niemeijer M, Garvin MK, Kwon YH, Sonka M, Abràmoff MD. Segmentation of the optic disc in 3-D OCT scans of the optic nerve head. IEEE Trans Med Imaging. 2010;29(1):159–168. doi: 10.1109/TMI.2009.2031324. [DOI] [PMC free article] [PubMed] [Google Scholar]
- 17.Hart PE, Nilsson NJ, Raphael B. A formal basis for the heuristic determination of minimum cost paths. IEEE Transactions on Systems Science and Cybernetics SSC4. 1968;4(2):100–107. [Google Scholar]
- 18.Nakano N, Hangai M, Nakanishi H, et al. Macular ganglion cell layer imaging in preperimetric glaucoma with speckle noise-reduced spectral domain optical coherence tomography. Ophthalmology. 2011;118(12):2414–2426. doi: 10.1016/j.ophtha.2011.06.015. [DOI] [PubMed] [Google Scholar]
- 19.Schulze A, Lamparter J, Pfeiffer N, Berisha F, Schmidtmann I, Hoffmann EM. Diagnostic ability of retinal ganglion cell complex, retinal nerve fiber layer, and optic nerve head measurements by Fourier-domain optical coherence tomography. Graefes Arch Clin Exp Ophthalmol. 2011;249(7):1039–1045. doi: 10.1007/s00417-010-1585-5. [DOI] [PubMed] [Google Scholar]
- 20.Kim NR, Hong S, Kim JH, Rho SS, Seong GJ, Kim CY. Comparison of macular ganglion cell complex thickness by Fourier-domain OCT in normal tension glaucoma and primary open-angle glaucoma [published online June 22, 2011] J Glaucoma. 2011 doi: 10.1097/IJG.0b013e3182254cde. [DOI] [PubMed] [Google Scholar]
- 21.Garas A, Vargha P, Holloó G. Diagnostic accuracy of nerve fibre layer, macular thickness and optic disc measurements made with the RTVue-100 optical coherence tomograph to detect glaucoma. Eye (Lond) 2011;25(1):57–65. doi: 10.1038/eye.2010.139. [DOI] [PMC free article] [PubMed] [Google Scholar]
- 22.Horn FK, Mardin CY, Laemmer R, et al. Correlation between local glaucomatous visual field defects and loss of nerve fiber layer thickness measured with polarimetry and spectral domain OCT. Invest Ophthalmol Vis Sci. 2009;50(5):1971–1977. doi: 10.1167/iovs.08-2405. [DOI] [PubMed] [Google Scholar]
- 23.Hood DC, Raza AS. Method for comparing visual field defects to local RNFL and RGC damage seen on frequency domain OCT in patients with glaucoma. Biomed Opt Express. 2011;2(5):1097–1105. doi: 10.1364/BOE.2.001097. [DOI] [PMC free article] [PubMed] [Google Scholar]
- 24.Raza AS, Cho J, de Moraes CG, et al. Retinal ganglion cell layer thickness and local visual field sensitivity in glaucoma. Arch Ophthalmol. 2011;129(12):1529–1536. doi: 10.1001/archophthalmol.2011.352. [DOI] [PMC free article] [PubMed] [Google Scholar]
- 25.Kocaoglu OP, Cense B, Jonnal RS, et al. Imaging retinal nerve fiber bundles using optical coherence tomography with adaptive optics. Vision Res. 2011;51(16):1835–1844. doi: 10.1016/j.visres.2011.06.013. [DOI] [PMC free article] [PubMed] [Google Scholar]


