

Abstract
Objectives
To test whether data extracted from full text patient visit notes from an electronic medical record (EMR) would improve the classification of PsA compared to an algorithm based on codified data.
Methods
From the > 1,350,000 adults in a large academic EMR, all 2318 patients with a billing code for PsA were extracted and 550 were randomly selected for chart review and algorithm training. Using codified data and phrases extracted from narrative data using natural language processing, 31 predictors were extracted and three random forest algorithms trained using coded, narrative, and combined predictors. The receiver operator curve (ROC) was used to identify the optimal algorithm and a cut point was chosen to achieve the maximum sensitivity possible at a 90% positive predictive value (PPV). The algorithm was then used to classify the remaining 1768 charts and finally validated in a random sample of 300 cases predicted to have PsA.
Results
The PPV of a single PsA code was 57% (95%CI 55%–58%). Using a combination of coded data and NLP the random forest algorithm reached a PPV of 90% (95%CI 86%–93%) at sensitivity of 87% (95% CI 83% – 91%) in the training data. The PPV was 93% (95%CI 89%–96%) in the validation set. Adding NLP predictors to codified data increased the area under the ROC (p < 0.001).
Conclusions
Using NLP with text notes from electronic medical records improved the performance of the prediction algorithm significantly. Random forests were a useful tool to accurately classify psoriatic arthritis cases to enable epidemiological research.
Psoriatic arthritis (PsA) is an inflammatory arthritis with a reported prevalence between 0.1% and 0.2% in the general population. [1–3] Because the disease is rare, locating large collections of validated cases for research remains a challenge.
Although electronic clinical repositories contain valuable data, the diagnostic codes can be inaccurate. [4–6] The PPV of a single code has been reported at 56% and 63% for rheumatoid arthritis in the UK and USA, respectively, [4, 5] 60% in osteoarthritis, [6] and 39% in systemic lupus erythematosus [7] and 83% in a small study of 20 patients with a single code for PsA. [8] These findings suggest that when using codes to select cases of PsA it is important to quantify the accuracy of the coded data before using it for clinical studies.
Human review of records remains the gold standard for confirming the accuracy of coded data, but it is expensive and time consuming. Computer classification algorithms utilizing electronic medical records offer a less expensive, quick method for case-finding. Commonly used methods for developing classification algorithms include logistic regression, recursive partitioning and neural networks. Although widely used, logistic regression assumes linear effects and becomes unstable if too many predictors are used. Tree based procedures such as the recursive partitioning classification trees, while effective in incorporating non-linear effects, also suffer from instability and thus unsatisfactory accuracy when the number of predictors is not small. [9] In recent years, ensemble procedures such as bagging and the random forest have emerged as stable non-parametric alternatives that often yield significant improvement in classification accuracy. [10] We chose the random forest method to allow the use of a larger number of predictors to construct stable rules for classifying PsA. [10]
We aimed to identify cases of PsA using electronic medical records to select potential predictors, construct an algorithm in a training sample and validate a prediction model in a test sample. We tested the hypothesis that adding variables extracted from narrative data from electronic medical records to codified data could improve the classification of PsA patients. The gold standard was the diagnosis of PsA documented in rheumatology clinic notes at a large academic medical center determined by chart review. The random forest predictions were validated by chart review in a randomly selected sample of predicted cases.
Materials and Methods
Data source
The Research Patient Data Registry (RPDR) is a centralized electronic clinical data registry which includes information on more than 1,365,000 patients seen at the Brigham and Women’s hospital (BWH) and its outpatient clinics. Among the data in the RPDR are all coded diagnoses and procedures based on billing codes. The RPDR also makes available for research all electronic clinic notes, collected since 1995. Because of the large rheumatology practice located at the BWH, this data set is a rich resource for locating patients with rare rheumatologic disorders.
Creating the training and validation data sets
All patients age ≥ 18 years with an ICD9 (696.0) billing code for PsA who had been seen at the BWH from January 1995 through December 2007 were included. Clinic notes, billing codes, encounter information, provider information, lab values, and radiology reports were extracted from the RPDR. This resulted in a study population of 2318 patients with at least one code for PsA recorded during the study period. A set of 550 patients were randomly selected for chart review (Figure 1).
Figure 1.
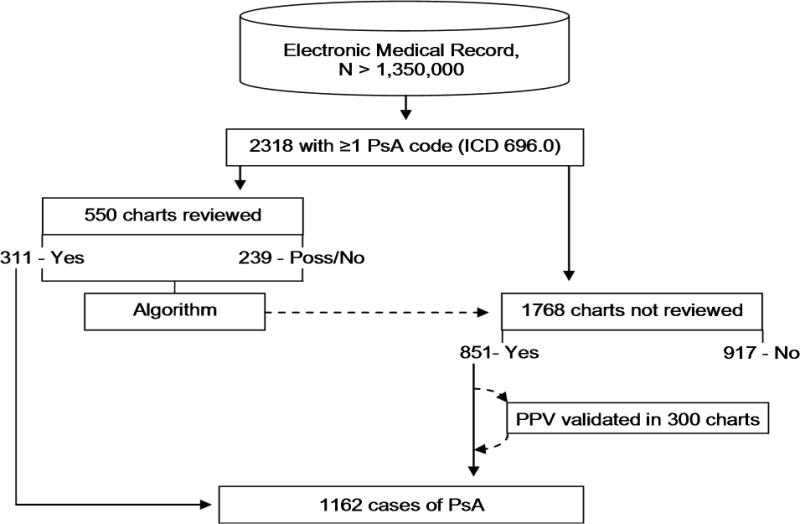
The process of algorithm training, validation and use.
Determining case status
While there are multiple classification criteria available for research purposes, including the recently published CASPAR criteria, [11] the gold standard in practice remains the clinical diagnosis. [11–13]A recent study suggests that the sensitivity of CASPAR is much lower in early disease [14]. Considering that length of follow up in our database varied from 0–12 years, and validation methods using a rheumatologist’s diagnosis as the gold standard in other rheumatic diseases [4, 15], we used the diagnosis of psoriatic arthritis by a board certified rheumatologist as the gold standard for this study. Using customized software [16] written using a programming environment [17], a rheumatology fellow reviewed the charts to document the rheumatologist’s diagnosis and classify each patient as positive, negative or possible PsA. A case was determined to be definite PsA only if a rheumatologist documented an unequivocal diagnosis in a clinical note. If a note indicated the diagnosis had been considered but was not definite, possible PsA was entered. If a rheumatologist made another diagnosis, or no rheumatologist diagnosis was found, the designation No PsA was chosen. The chart review results were used as the gold standard outcome to obtain both training and validation datasets.
Predictor variables
For each patient, the 31 variables listed in table 1 were selected as potential predictors. Of these, 15 were based on coded data and lab values and 16 were based on simplified natural language processing (NLP) extraction from clinic notes. The number of times a code for rheumatoid arthritis (RA), osteoarthritis (OA), psoriasis (Pso), and PsA occurred during the study period was recorded.
Table 1.
Comparison of demographic and predictor variables between training cases and the cases the prediction algorithm was applied to.
| Training set N = 550 |
Remaining set N = 1768 |
p | |
|---|---|---|---|
| Year of birth | 1951 [1939, 1962] | 1952 [1941, 1962] | 0.602 |
| Males % [95% CI] | 45% [41% – 49%] | 47% [45% – 49%] | 0.494 |
| Race (White / Black / Hispanic / Other or unknown) | 376 / 13 / 12 / 149 | 1195 / 32 / 51 / 490 | 0.677 |
| Confirmed disease on chart review % [95% CI] | 57% [52% – 61%] | N/A** | N/A** |
| Number of PsA codes | 3 [1, 10] | 3 [1, 12] | 0.153 |
| Number of osteoarthritis codes | 0 [0, 2] | 0 [0, 2] | 0.542 |
| Number of psoriasis codes | 0 [0, 1] | 0 [0, 1] | 0.954 |
| Number of rheumatoid arthritis codes | 0 [0, 2] | 0 [0, 2] | 0.363 |
| Number of psoriasis topicals prescribed | 0 [0, 0] | 0 [0, 0] | 0.108 |
| Number of clinic visits to any clinic | 28 [8, 77] | 30 [9, 78] | 0.457 |
| Number of rheumatology clinic visits | 6 [1, 21] | 6 [2, 22] | 0.188 |
| Number of clinic notes from any clinic | 14 [4, 42] | 16 [4, 45] | 0.202 |
| Number of rheumatology notes | 5 [1, 18] | 6 [1, 20] | 0.092 |
| Highest erythrocyte sedimentation rate | 11 [0, 40] | 14 [0, 42] | 0.061 |
| Highest C-reactive protein titer | 0 [0, 6.4] | 0.3 [0, 7.1] | 0.187 |
| Patient has a primary care physician at BWH % [95% CI] | 12% [9% – 15%] | 11% [10% – 12%] | 0.528 |
| Rheumatoid factor (RF) (Pos / Neg / NoLab) | 30 / 146 / 374 | 94 / 422 / 1252 | 0.424 |
| Anti-citrullinated cycl. prot. (aCCP) (Pos / Neg / NoLab) | 8 / 69 / 473 | 25 / 244 / 1499 | 0.753 |
| Seropositive (either aCCP or RF positive) % [95% CI] | 6% [4% – 8%] | 6% [5% – 7%] | 0.883 |
| Number of mentions of PsA in problem list | 0 [0, 1] | 0 [0, 1] | 0.190 |
| Number of pathology notes mentioning psoriasis | 0 [0, 0] | 0 [0, 0] | 0.720 |
| Number of clinic notes mentioning PsA | 1 [0, 8] | 2 [0, 10] | 0.009 * |
| Number of clinic notes mentioning osteoarthritis | 0 [0, 1] | 0 [0, 1] | 0.797 |
| Number of clinic notes mentioning RA | 0 [0, 1] | 0 [0, 1] | 0.815 |
| Number of rheumatology notes mentioning PsA | 1 [0, 6] | 2 [0, 7] | 0.003 * |
| Number of rheum. notes specifying no PsA | 0 [0, 0] | 0 [0, 0] | 0.448 |
| Number of rheumatology notes mentioning OA | 0 [0, 0] | 0 [0, 1] | 0.119 |
| Number of rheumatology notes mentioning RA | 0 [0, 0] | 0 [0, 0] | 0.833 |
| Number of clinic notes mention seronegative | 0 [0, 0] | 0 [0, 0] | 0.004 * |
| Number of clinic notes mention a topical agent | 0 [0, 0] | 0 [0, 0] | 0.904 |
| Number of clinic notes mentioning nail dystrophy | 0 [0, 0] | 0 [0, 0] | 0.191 |
| Number of clinic notes mentioning dactylitis | 0 [0, 0] | 0 [0, 1] | 0.104 |
| Number of Xrays mentioning features of PsA | 0 [0, 0] | 0 [0, 0] | 0.765 |
| Number of Xrays mentioning pencil in cup | 0 [0, 0] | 0 [0, 0] | 0.852 |
| Number of Xrays mentioning sacroiliitis | 0 [0, 0] | 0 [0, 0] | 0.593 |
Data are presented as the median with inter-quartile ranges, except for categorical values as noted in the table.
p < 0.05,
As only the training sample was reviewed, the confirmed disease rate cannot be calculated for the remaining cases.
Random forests
The random forest method, an extension of recursive partitioning that grows multiple trees rather than one, was used to train a classification algorithm. [10] Each tree is trained using a bootstrap sample from the training dataset. The trees are then grown using a randomly selected subset of predictors at each node. The proportion of trees that predict the class of interest is then used as a score to predict individual case status. Finally, predictive performance is estimated using the observations left out of the bootstrap sample, termed the out-of-bag (OOB) observations.
Since the results were not sensitive to the number of randomly selected predictors used at each node, the square root of the number of predictors was used as recommended [10] and 10,000 trees were grown to strike a balance between algorithm stability and available computing resources. The mean decrease in classification accuracy was used to estimate the importance of individual predictors. The benefits and limitations of random forests have been described in detail by its inventors, [10] and the method has been applied to a range of classification problems. [18–23]
Algorithm training and selection
Three algorithms were trained. The first used only the 15 codified predictor variables, the second used only the 16 NLP variables, and the third combined all 31 variables to predict case status, definite PsA case vs. non-case (including non-cases and possible cases).
The receiver operating characteristic (ROC) curves were used to evaluate the performance of the classification algorithms. The difference in the area under the ROC curve (AUC) was used to compare algorithms and was estimated based on DeLong et al, [24] as implemented in the ucR package. [25] The algorithm with the largest AUC was considered the optimal algorithm.
Multi dimensional scaling (MDS) plots reduce the dimensions of multidimensional data and show the relative position of objects with the axes representing the eigenvectors of the dissimilarity matrix. MDS plots in one and two dimensions were drawn to illustrate the separation of cases from non cases, and to show how grouping possible cases with non-cases might affect algorithm performance.
Selection of cut-point
To identify PsA cases with a high positive predictive value (PPV), we select the cut-off value by minimizing false positives. Using cohort studies as a model, a PPV of 80% would result in no more than a 7.5% reduction in the detectable relative risk (RR) when the true RR is anywhere from 1 to 4. [26] The goal was set at finding a cut-point that achieved the maximum sensitivity possible with a PPV of 90%.
The formula for PPV can be used to calculate the specificity needed to achieve that goal PPV at any given sensitivity for a known prevalence. [27] This results in a straight line that can be overlaid on the ROC curve with the region above the line representing all possible combinations of sensitivity and specificity when the desired PPV will be met or exceeded at a given prevalence. Thus the target cut-off value is at the first intersection between this line and the ROC reading from right to left.
Validation of the Prediction Rule
The prediction rule derived from the random forest algorithm with the largest AUC using the cut-off value described above was applied to all of the charts that were not in the training set. To validate the PPV of the prediction rule the medical records of a random sample of 300 cases predicted to have PsA were reviewed for the gold standard case status.
Statistical tools
All statistical tests, algorithms, and plots were generated using the statistical software R version 2.8.1. [28] The Wilcoxon rank-sum test and the Pearson’s chi-square test were used to calculate p values for comparing the distributions of the predictors among those with and without PsA. Random forests and associated calculations, including importance measures and MDS plots, were generated using the randomForest package for R. [29] Confidence intervals for sensitivity, specificity and PPV were based on an exact binomial distribution, as implemented in the Hmisc package for R. [30] All data were processed and queried using the open source mySQL database environment.
Results
Table 1 shows the demographic features and 31 predictor variables for the 550 randomly selected training cases, and compares them to the remaining 1768 cases. Of the 31 variables used for algorithm training, three had statistically significantly different medians, of which two were variations of the same variable, after applying simple Bonferroni correction for multiple testing none of the three variables remained significantly different between the two groups (data not shown).
Of the 550 charts reviewed, 311 were confirmed to have PsA diagnosed by a rheumatologist, a prevalence of 57% (95% CI 52%–61%) among patients with at least one billing code for PsA. Of the 239 cases grouped as no PsA, 68 had possible PsA. Figure 2 is an MDS plot showing how the cases classified as PsA separated quite well from those without PsA, while the possible PsA cases clustered at the intersection between the two. In particular the possible PsA cases did not separate well from the definite PsA cases. This was reflected in the validation step described below, where of the 21 cases that were incorrectly classified as having definite PsA, on review 17 had possible PsA while only 4 had been found to have no PsA on chart review.
Figure 2.
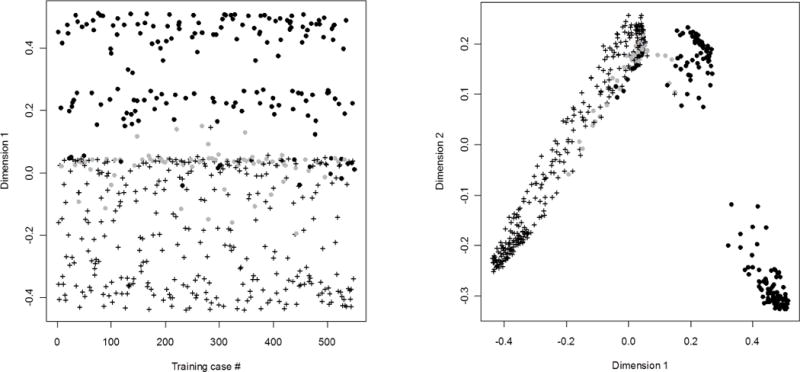
MDS plots showing distances between the 550 training cases reduced to one and two dimensions. The axes of the MDS plots represent no real sizes and are therefore marked as dimension 1 and 2 without a unit.
Cases were separated into definite (crosses), possible (grey circles) and not (black circles) psoriatic arthritis on chart review. The algorithm was trained to separate the cases into psoriatic arthritis (crosses) or not (circles).
Panel A shows the separation of cases in one dimension, illustrating how lack of separation between possible (grey circles) and definite (crosses) psoriatic arthritis may have limited the positive predictive value of the prediction rule.
Panel B illustrates in two dimensions how there were at least two separate clusters of patients that were classified as not having PsA, suggesting that the algorithm used many methods to determine case status.
Both panels illustrate well how the possible (grey circles) PsA cases failed to separate from definite (crosses) PSA cases.
The most common reason for a diagnostic code for psoriatic arthritis not being confirmed on chart review was that it was based on the opinion of a non-rheumatologists (26%), with the second and third most common reason being that the rheumatologist had not made a definitive diagnosis (18%), or there was no rheumatologic diagnosis at all (18%). Rheumatoid arthritis was the diagnosis in 8%, osteoarthritis in 7%, other spondyloarthropathy in 5%, and connective tissue disease in 4%. Polymyalgia rheumatica and/or GCA were seen in 3%, mechanical pain in 2%, and arthralgias in 2%. Gout, Lyme disease or fibromyalgia were the diagnosis in 1% or less, each.
The random forests method was used to generate three algorithms: coded predictors only, NLP only, and all predictors. The ROC curves for each of the algorithms are shown in figure 3, along with a line identifying at what specificity the PPV of the algorithm reaches 90% for any given sensitivity. The AUCs for the three algorithms were: 0.925 (95% CI 0.914 – 0.936) for coded, 0.938 (95% CI 0.929 – 0.947) for NLP, and 0.950 (95% CI 0.940 – 0.960) for all. The improvement achieved by combining NLP with coded data over using coded data alone was statistically significant, p = 0.0007. As the algorithm using all the predictors had the largest AUC, it was selected for use in the prediction model. The importance of individual predictors was evaluated and the resulting importance score for each predictor is shown in figure 4.
Figure 3.
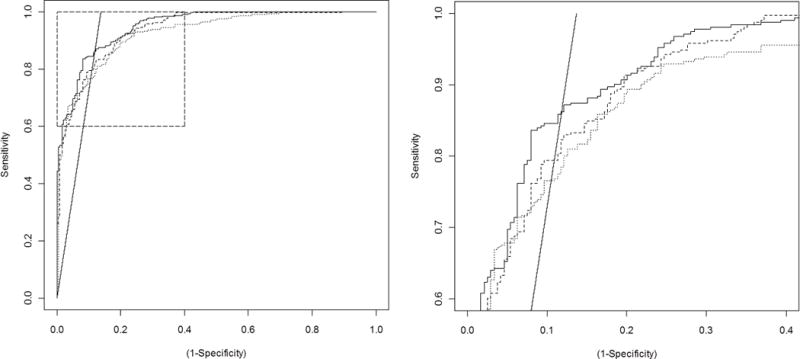
ROC curves for the three algorithms trained The dotted line represents coded predictors (AUC = 0.9254), the dashed line is based on natural language processing of electronic notes (AUC = 0.9376), and the solid line is based on coded and natural language processing predictors combined (AUC = 0.9500). The straight line represents the specificity needed to achieve 90% positive predictive value at any given sensitivity. Panel B shows a magnification of the area in panel A indicated by the box. focusing on where the ROC curve for the combined algorithm and the 90% PPV line intersect, representing the optimal cut point of the prediction rule.
Figure 4.
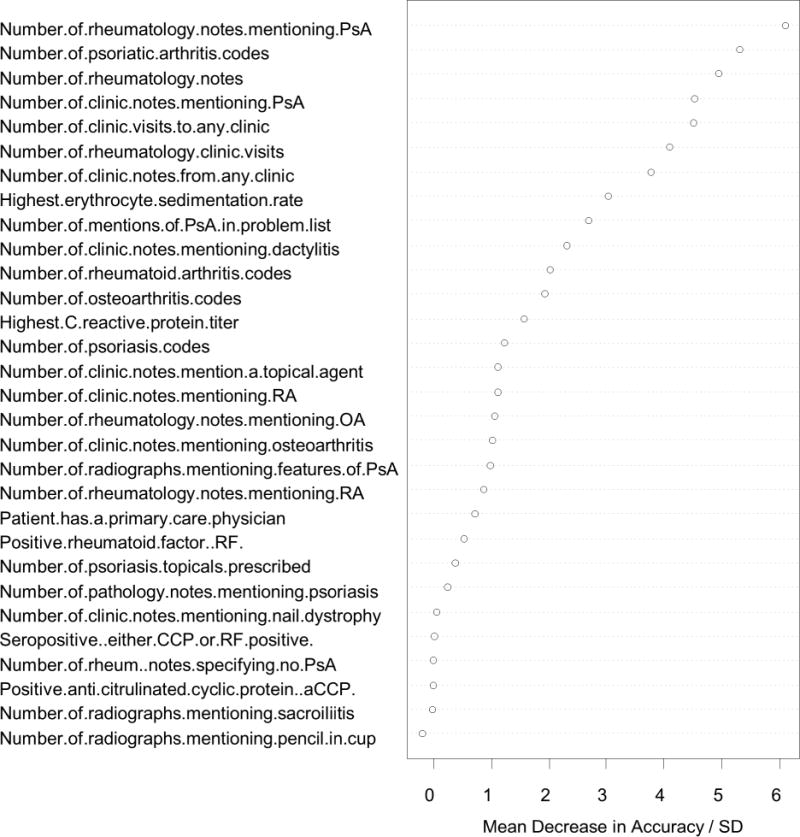
Importance of the individual predictors. The importance is measured as the mean decrease in accuracy after randomly permuting the predictor values, with a higher mean decrease in accuracy suggesting greater importance for the predictor. The importance measure is scaled by dividing the mean decrease in accuracy with its standard deviation (SD).
A cut-point for the algorithm with the largest AUC was selected to achieve the highest sensitivity possible at a PPV of 90%, corresponding to the intersection between the straight line and the solid ROC curve in figure 3. The prediction rule had a sensitivity of 87% (95% CI 83% – 91%) and a specificity of 87% (95%CI 83% – 91%), with a PPV of 90% (95% CI 86% – 93%). At this sensitivity and specificity, and using the prevalence of PsA from the training sample, we estimated that the algorithm would identify between 831 and 905 cases of PsA among the 1768 charts not used for training. When applied, the prediction rule actually identified 851 charts as having PsA, which was within the expected range. Based on the performance of the prediction rule in the training set, 766 (95% CI 735 – 792) of these were expected to be true cases, and the remaining 85 (95% CI 59 – 116) false positives.
To validate the PPV of the algorithm, 300 cases were randomly selected for chart review from among predicted PsA cases. The resulting calculated PPV was 93% (95% CI 89% – 96%) (Table 2)
Table 2.
Sensitivity, specificity and positive predictive values as observed for a coded diagnosis of psoriatic arthritis (PsA), as estimated based on training data, and as validated in a new dataset.
| Sens | [95% CI] | Spec | [95% CI] | PPV | [95% CI] | |
|---|---|---|---|---|---|---|
| Coded diagnosis of PsA | 65% * | [63%–67%] | 99,9% * | [99.9%–99.9%] | 57% | [55%–58%] |
| Predicted based on training set | 87% | [83%–91%] | 87% | [83%–91%] | 90% | [86%–93%] |
| Actual performance in validation set | 79% ** | [77%–82%] | 93% ** | [91%–94%] | 93% | [90%–96%] |
Sens = Sensitivity, Spec = Specificity, PPV = Positive predictive value.
Sensitivity and specificity for diagnostic codes are derived from an estimated population prevalence of psoriatic arthritis of 0.15%
Sensitivity and specificity for the validation set are derived from the observed prevalence of psoriatic arthritis in the training set
Combining the 311 definite cases from chart review with 851 predicted cases resulted in 1162 patients identified as having PsA with an estimated proportion of false positive cases of 5% (95% CI 4% – 7%).
Discussion
Using text mining techniques to abstract data from electronic clinic notes augments the information from diagnostic codes for PsA and results in an algorithm with a PPV of 93% (89% – 96%) when validated in new data, a substantial improvement from the baseline PPV of 57% (52% – 61%) for a single billing code. This was done while maintaining a sensitivity of 79% (77% – 82%), with stable results when applied to new data. These results show that including data from text notes with billing data increases classification accuracy in PsA. Further, the novel analytic approach using random forest methods can be applied to an electronic medical record to reliably identify cases. The methods used were entirely based on free software tools available on the internet, and terms from clinic notes were identified in medical records using the standard SQL query language. Therefore, the methods presented in this report should be transferable to other projects and do not require major infrastructure investments.
In the specific context presented here, combining the results of the chart review with the results from the algorithm resulted in an estimated 84% of true cases of PsA being extracted from a database of 2318 possible cases using a prediction model derived from a random forest classification algorithm. This validation study was achieved by reviewing about a third of the charts in the database, with an estimated false positive proportion of 5%. The final database thus contains information on 1162 patients, and based on the validated performance characteristics, 1104 (95% CI 1081 – 1116) of these are true cases of PsA.
Natural language processing was used in a simple form in this project through searches for terms within clinical notes. This simple approach resulted in a statistically significant improvement in the predictive capability of the algorithm generated as illustrated by the improvement in the AUC. for coded predictors alone to coded and NLP predictors. This demonstrates the value of utilizing electronic medical record notes as a research tool.
As suggested by figure 2, the main obstacle to improving the PPV of the algorithm was separating the possible cases of PsA from definite cases of PsA. Combining the possible cases with the non-cases was a conservative approach to algorithm development. In further analysis we found that by classifying possible cases with definite cases it was easy to improve performance of the algorithm greatly in terms of sensitivity, specificity and PPV (data not shown). However, the choice of classification of possible cases depends on the goal of the research study. If the goal were to find a good subset of charts for high yield human chart review, grouping the possible cases with the definite cases should be considered.
We chose to define PsA based on chart review for the diagnosis of PsA rather than based on classification criteria such as CASPAR. Considering that length of follow up in our database varied from 0–12 years, we were concerned that using these criteria would result in a low sensitivity [14] and a bias towards established, long-standing disease, and would therefore limit the utility of the resulting dataset for epidemiological research.
Another important point is the influence of the prevalence of the feature of interest on the effectiveness of any algorithm. The higher the prevalence the more likely an algorithm is to result in a high PPV. However, in databases where the feature of interest has a very low prevalence it becomes nearly impossible to create an algorithm that has a high PPV. Table 2 illustrates this problem well, as a billing code for PsA among all 1,350,000 patients in the RPDR has 99.9% specificity, but with a sensitivity of 65% and an estimated underlying prevalence of 0.15%, [1–3] the positive predictive value is only 57%.
The option of using only the number of PsA codes to predict disease as previously reported [8] was explored in sensitivity analyses using the training data set. The goal PPV of 90% could be reached by using 6 occurrences of PsA codes or more as the cut-point, with a PPV of 90.8%. However, the sensitivity achieved at this level was 64% (95% CI 58%–69%), compared to 87% (95% CI 83% – 91%) using the optimal random forest algorithm. In the example presented here, using PsA codes alone would have missed 363 cases of PsA, while the optimal algorithm was expected to miss 131. The difference of 232 missed cases is not trivial in a database of 1768 individuals predicted to contain 1008 cases.
To our knowledge this is the first example where the random forest methodology has been used to identify cases of a disease in an electronic medical record system. One group attempted to predict the case status of rheumatoid arthritis patients and controls using genetic data and random forests as well as traditional regression methods, but with limited success, [22] while another group showed that the method works well to predict outcomes in lupus based on medical record information. [23] This report therefore presents a novel application of a recently developed statistical method. The results suggest that random forests can be used to accurately identify rare disorders in large databases. This tool is able to make reliable predictions in future data without relying on user determined weights or tuning parameters and can make simultaneous use of all predictors without loss of accuracy. These qualities should make it an attractive tool for medical researchers studying clinical databases.
It is important to note that the algorithms presented here are not intended to be diagnostic algorithms, nor do they serve as a definition of what constitutes PsA. It is also worth noting that the predictors used here should be considered illustrative and may not apply directly to other databases. Our results provide a proof-of-concept methodology that can be applied to study rare diseases in large databases. The entire process can be completed using free and/or open source software and does not require any computational resources beyond a regular desktop computer. However, it should be noted that this method relies on the presence of an electronic medical record database that can be accessed by researchers, in this case the RPDR. To use NLP such a database must contain full text electronic notes as well as coded data.
In summary, this report shows how the random forests method can be a useful way to train an algorithm to accurately identify true cases of PsA among those patients who have been assigned that billing code in an electronic medical record, and that the resulting prediction rule is valid when tested on a separate set of cases.
Key messages.
Psoriatic arthritis can be accurately identified in large research databases.
Processing electronic clinic notes can improve classification accuracy.
This method can be applied to the study of other rare rheumatic conditions.
Acknowledgments
The authors thank Shawn Murphy and Henry Chueh and the Partners Health Care Research Patient Data Registry group for facilitating use of their database.
Footnotes
The corresponding author hereby declares on behalf of all authors, that none of the authors have any conflicts of interest to declare regarding the content of this manuscript.
Contributor Information
Thorvardur Jon Love, Thorvardur Jon Love, MD, Brigham and Women’s Hospital, Harvard Medical School Boston, Massachusetts 02115, USA, tlove2@partners.org, tel: 617-525-8717, fax: 617-812-2429.
Tianxi Cai, Harvard School of Public Health, Boston, Massachusetts 02115, USA.
Elizabeth W. Karlson, Brigham and Women’s Hospital, Harvard Medical School Boston, Massachusetts 02115, USA.
References
- 1.Shbeeb M, Uramoto KM, Gibson LE, O’Fallon WM, Gabriel SE. The epidemiology of psoriatic arthritis in Olmsted County, Minnesota, USA, 1982–1991. The Journal of rheumatology. 2000 May;27(5):1247–50. [PubMed] [Google Scholar]
- 2.Madland TM, Apalset EM, Johannessen AE, Rossebo B, Brun JG. Prevalence, disease manifestations, and treatment of psoriatic arthritis in Western Norway. The Journal of rheumatology. 2005 Oct;32(10):1918–22. [PubMed] [Google Scholar]
- 3.Love TJ, Gudbjornsson B, Gudjonsson JE, Valdimarsson H. Psoriatic arthritis in Reykjavik, Iceland: prevalence, demographics, and disease course. The Journal of rheumatology. 2007 Oct;34(10):2082–8. [PubMed] [Google Scholar]
- 4.Singh JA, Holmgren AR, Noorbaloochi S. Accuracy of Veterans Administration databases for a diagnosis of rheumatoid arthritis. Arthritis and rheumatism. 2004 Dec 15;51(6):952–7. doi: 10.1002/art.20827. [DOI] [PubMed] [Google Scholar]
- 5.Thomas SL, Edwards CJ, Smeeth L, Cooper C, Hall AJ. How accurate are diagnoses for rheumatoid arthritis and juvenile idiopathic arthritis in the general practice research database? Arthritis and rheumatism. 2008 Sep 15;59(9):1314–21. doi: 10.1002/art.24015. [DOI] [PubMed] [Google Scholar]
- 6.Gabriel SE, Crowson CS, O’Fallon WM. A mathematical model that improves the validity of osteoarthritis diagnoses obtained from a computerized diagnostic database. Journal of clinical epidemiology. 1996 Sep;49(9):1025–9. doi: 10.1016/0895-4356(96)00115-1. [DOI] [PubMed] [Google Scholar]
- 7.Arbuckle MR, McClain MT, Rubertone MV, Scofield RH, Dennis GJ, James JA, et al. Development of autoantibodies before the clinical onset of systemic lupus erythematosus. The New England journal of medicine. 2003 Oct 16;349(16):1526–33. doi: 10.1056/NEJMoa021933. [DOI] [PubMed] [Google Scholar]
- 8.Singh JA, Holmgren AR, Krug H, Noorbaloochi S. Accuracy of the diagnoses of spondylarthritides in veterans affairs medical center databases. Arthritis and rheumatism. 2007 May 15;57(4):648–55. doi: 10.1002/art.22682. [DOI] [PubMed] [Google Scholar]
- 9.Terrin N, Schmid CH, Griffith JL, D’Agostino RB, Selker HP. External validity of predictive models: a comparison of logistic regression, classification trees, and neural networks. Journal of clinical epidemiology. 2003 Aug;56(8):721–9. doi: 10.1016/s0895-4356(03)00120-3. [DOI] [PubMed] [Google Scholar]
- 10.Breiman L. Random Forests. Machine Learning. 2001;45(1):27. 2001. [Google Scholar]
- 11.Taylor W, Gladman D, Helliwell P, Marchesoni A, Mease P, Mielants H. Classification criteria for psoriatic arthritis: development of new criteria from a large international study. Arthritis and rheumatism. 2006 Aug;54(8):2665–73. doi: 10.1002/art.21972. [DOI] [PubMed] [Google Scholar]
- 12.McGonagle D, Tan AL. Are the classification criteria for psoriatic arthritis better than existing criteria for diagnosing psoriatic arthritis? Comment on the article by Taylor et al. Arthritis and rheumatism. 2007 Feb;56(2):699–700. doi: 10.1002/art.22411. author reply. [DOI] [PubMed] [Google Scholar]
- 13.Chandran V, Schentag CT, Gladman DD. Sensitivity of the classification of psoriatic arthritis criteria in early psoriatic arthritis. Arthritis and rheumatism. 2007 Dec 15;57(8):1560–3. doi: 10.1002/art.23104. [DOI] [PubMed] [Google Scholar]
- 14.D’Angelo S, Mennillo GA, Cutro MS, Leccese P, Nigro A, Padula A, et al. Sensitivity of the classification of psoriatic arthritis criteria in early psoriatic arthritis. The Journal of rheumatology. 2009 Feb;36(2):368–70. doi: 10.3899/jrheum.080596. [DOI] [PubMed] [Google Scholar]
- 15.Katz JN, Barrett J, Liang MH, Bacon AM, Kaplan H, Kieval RI, et al. Sensitivity and positive predictive value of Medicare Part B physician claims for rheumatologic diagnoses and procedures. Arthritis and rheumatism. 1997 Sep;40(9):1594–600. doi: 10.1002/art.1780400908. [DOI] [PubMed] [Google Scholar]
- 16.Love TJ. Medical Record Browser. 0.4. 2008. [Google Scholar]
- 17.Embarcadero. Turbo Delphi 2006 Explorer. In: Embarcadero, editor. 2006:RAD Environment. 2006. [Google Scholar]
- 18.Bureau A, Dupuis J, Falls K, Lunetta KL, Hayward B, Keith TP, et al. Identifying SNPs predictive of phenotype using random forests. Genetic epidemiology. 2005 Feb;28(2):171–82. doi: 10.1002/gepi.20041. [DOI] [PubMed] [Google Scholar]
- 19.Bureau A, Dupuis J, Hayward B, Falls K, Van Eerdewegh P. Mapping complex traits using Random Forests. BMC genetics. 2003;4(Suppl 1):S64. doi: 10.1186/1471-2156-4-S1-S64. [DOI] [PMC free article] [PubMed] [Google Scholar]
- 20.Perdiguero-Alonso D, Montero FE, Kostadinova A, Raga JA, Barrett J. Random forests, a novel approach for discrimination of fish populations using parasites as biological tags. International journal for parasitology. 2008 Oct;38(12):1425–34. doi: 10.1016/j.ijpara.2008.04.007. [DOI] [PubMed] [Google Scholar]
- 21.Sikic M, Tomic S, Vlahovicek K. Prediction of protein-protein interaction sites in sequences and 3D structures by random forests. PLoS computational biology. 2009 Jan;5(1):e1000278. doi: 10.1371/journal.pcbi.1000278. [DOI] [PMC free article] [PubMed] [Google Scholar]
- 22.Sun YV, Cai Z, Desai K, Lawrance R, Leff R, Jawaid A, et al. Classification of rheumatoid arthritis status with candidate gene and genome-wide single-nucleotide polymorphisms using random forests. BMC proceedings. 2007;1(Suppl 1):S62. doi: 10.1186/1753-6561-1-s1-s62. [DOI] [PMC free article] [PubMed] [Google Scholar]
- 23.Ward MM, Pajevic S, Dreyfuss J, Malley JD. Short-term prediction of mortality in patients with systemic lupus erythematosus: classification of outcomes using random forests. Arthritis and rheumatism. 2006 Feb 15;55(1):74–80. doi: 10.1002/art.21695. [DOI] [PubMed] [Google Scholar]
- 24.DeLong ER, DeLong DM, Clarke-Pearson DL. Comparing the areas under two or more correlated receiver operating characteristic curves: a nonparametric approach. Biometrics. 1988 Sep;44(3):837–45. [PubMed] [Google Scholar]
- 25.Lindbäck J. rocTest. 0.3-0. Uppsala: 2009. [Google Scholar]
- 26.Copeland KT, Checkoway H, McMichael AJ, Holbrook RH. Bias due to misclassification in the estimation of relative risk. American journal of epidemiology. 1977 May;105(5):488–95. doi: 10.1093/oxfordjournals.aje.a112408. [DOI] [PubMed] [Google Scholar]
- 27.Kelly H, Bull A, Russo P, McBryde ES. Estimating sensitivity and specificity from positive predictive value, negative predictive value and prevalence: application to surveillance systems for hospital-acquired infections. The Journal of hospital infection. 2008 Jun;69(2):164–8. doi: 10.1016/j.jhin.2008.02.021. [DOI] [PubMed] [Google Scholar]
- 28.Team RDC. R: A language and environment for statistical computing. Vienna, Austria: 2008. [Google Scholar]
- 29.Liaw A, Wiener M. Classification and Regression by randomForest. R News. 2002;2(3):18–22. [Google Scholar]
- 30.Harrell FE. In: Harrell Miscellaneous. 3.6-0. Dupont C, editor. 2009. [Google Scholar]