Abstract
To quantify OCT images of rectal tissue for clinic diagnosis, the scattering coefficient of the tissue is extracted by curve fitting the OCT signals to a confocal single model. A total of 1000 measurements (half and half of normal and malignant tissues) were obtained from 16 recta. The normal rectal tissue has a larger scattering coefficient ranging from 1.09 to 5.41 mm–1 with a mean value of 2.29 mm–1 (std: ± 0.32), while the malignant group shows lower scattering property and the values ranging from 0.25 to 2.69 mm–1 with a mean value of 1.41 mm–1 (std: ± 0.18). The peri-cancer of recta has also been investigated to distinguish the difference between normal and malignant rectal tissue. The results demonstrate that the quantitative analysis of the rectal tissue can be used as a promising diagnostic criterion of early rectal cancer, which has great value for clinical medical applications.
1. Introduction
Rectal cancer is the common malignant tumor of the gastrointestinal tract. The incidence of colorectal cancer has been rising dramatically following economic development and industrialization. Currently, colorectal cancer is the third leading cause of cancer deaths in both males and females in the world (Giovannucci and Wu 2006, American Cancer Society 2010); the morbidity is second to gastric carcinoma and oesophageal carcinoma. Each year about 40 000–50 000 people die from the disease. The early stages of rectal cancer are asymptomatic, but a series of symptoms appear with focal carcinomas that increase gradually, such as hemafecia, the phenomena of the intestinal tract becoming narrow and obstruction, anal ache and anal incontinence. It is predominantly diagnosed in the middle and advanced stages due to the lack of distinctive symptoms early on. The pathology is nubilous and considers the presence of rectal polyps, chronic inflammation and genetic factors. The existing diagnostic approaches for rectal cancer are endoscopy including digital rectal examination (DRE), sigmoidoscopy and fiber colonoscopy, double contrast radiography and computed tomography. DRE is the most fundamental and most important examination method. However, the cancer located in the middle and upside of rectum is unable to be touched using fingers. In this case, sigmoidoscopy or fiber colonoscopy can be used to examine a cancer focus and obtain a biopsy for histopathologic diagnosis. With this method, tissue with a suspected tumor must be excised for histopathologic diagnosis, which is a cumbersome process. The other methods cannot be used for early diagnosis. As a result, there is an urgent need to develop more sensitive tools to effectively evaluate the rectum during minimally invasive surgery so that a surgeon can determine if an early-stage cancer is present, and thus avoid removal of normal tissues.
Spectral domain optical coherence tomography (SDOCT), a high-resolution structural imaging technology based on low coherence interferometry using a spectrometer, which measures backscattered light generated from the tissue, has shown great promise in disease diagnosis, including differentiation between benign and malignant lesions (Hsiung et al 2007). As an interferometric technique, OCT typically employs near-infrared light, and allows for achieving micron-scale cross-sectional images of the biological samples (Huang et al 1991). OCT studies in various organs have demonstrated the capability of differentiating between normal and pre-malignant conditions. For example, ovarian cysts, masses and abnormal tissue have successfully been imaged with laparoscopic OCT (Hariri et al 2009). Laryngeal dysplasia and malignancy have been imaged with OCT probes during laryngoscopy (Kraft et al 2008). Malignant and inflammatory lymph nodes have been differentiated with OCT (McLaughlin et al 2010). Recently, to give new diagnostic information, quantitative analysis of OCT images has been studied (Faber et al 2004, Liu et al 2010, Gao et al 2011, Adegun et al 2011, Yi et al 2011). In addition to obtaining high-resolution morphological images, OCT is capable of quantitatively estimating the total attenuation coefficient (μt) by fitting the A-line measurements (Lee et al 2010, Faber et al 2004, Levitz et al 2004). The total attenuation coefficient (μt) is the summation of the absorption coefficient (μa) and the scattering coefficient (μs). When light is transmitted into the tissue, most of it is scattered, and the rest is absorbed. As a result, μs is almost equal to μt and is a good estimate of the local scattering properties. In this study, we use the quantitative technology of SDOCT to distinguish the normal and malignant rectal tissue, which can be used as a promising diagnostic criterion of early rectal cancer.
2. Principle and methods
2.1. SDOCT system and principle
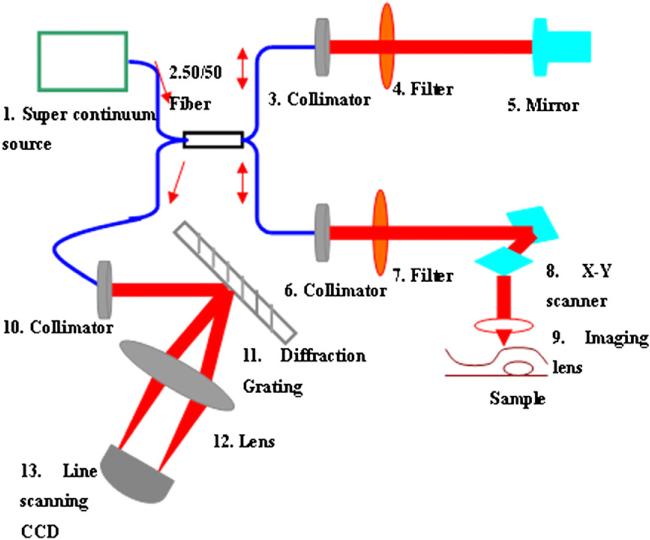
The SDOCT system used for this study was described in our previous publication (Zhang et al 2011) and the setup is shown in figure 1. Light from a supercontinumm source (Fianum-SC450-FC, 450–1800 nm) is split by a 50:50 fiber coupler into separate paths for the reference and sample arms. Two filters are used in the reference and sample arms to get a spectral bandwidth of 40 nm with the centre wavelength at 850 nm. In the reference arm, the collimated beam from the single-mode fiber passes the filter onto the reference mirror and reflects back from the same direction. In the sample arm, light from the single-mode fiber is collimated with a fiber collimator to produce the parallel illumination upon the focusing lens (f 35 mm) and is then focused on the sample. The interference signals are detected by an=in-house developed spectrometer, including a fiber collimator, a diffraction grating (1200 lines mm–1), an achromatic lens and a line scanning CCD (e2v AViiVA SM2 CL, 4096 × 1, 10 μm) in the detection arm and transferred into the computer to implement fast Fourier transform by the camera link of CCD. In our system, the axial resolution determined by the bandwidth of the light source is ~7.97 μm and the lateral resolution is ~9.5 μm.
Figure 1.
Schematic diagram of the SDOCT system.
The SDOCT system was used to acquire depth information from the samples, obtaining images with 2048 axial and 500 transverse pixels. To avoid the influence from the mirror image, light was focused on the surface of the scattering medium during the process of imaging.
2. 2. The OCT model
In the literature (Lee et al 2010, Faber et al 2004, Levitz et al 2004, Kah et al 2009, van der Meer et al 2005, Schmitt et al 1993, Schmitt and Knüttel 1997, van Staveren et al 1991), there are two models mainly used for the description of the OCT signals: the single-backscattering model and the multiple-scattering model. In the single-backscattering model, only light that has been backscattered once contributes to the OCT signal and the OCT signal is given by Beer's law:
| (1) |
where I(z) is the intensity of the interference signal; the factor 2 is due to the round trip attenuation.
In actual applications, the single-backscattering model is suitable for dynamic focusing due to ignoring the effect of confocal properties. As a result, the effect of confocal properties of the sample arm optics should be considered. To give a more accurate model, an axial confocal PSF for the OCT system was introduced by Faber et al (2004). Therefore, the OCT signal containing the confocal PSF is given by
| (2) |
where zcf is the position of the focal plane and zR is the ‘apparent’ Rayleigh length.
In our system, the numerical aperture of the objective lens is 0.08, which is low for a fixed focusing OCT system (Yi et al 2011). It means the focal zone is long enough for the superficial scanning depth. For weakly scattering media (μs < 8 mm–1), the single-backscattering model with the confocal feature is suitable to extract the scattering coefficient. To confirm our choice, tissue phantoms with known optical properties were prepared. Intralipid liquid is a kind of tissue-mimicking liquid and is used clinically as an intravenous nutrient. It is a homogeneous suspension and usually used as a tissue phantom (van Staveren et al 1991, Giusto et al 2003, Zaccanti 2003). We used the Intralipid with the concentrations of 1%, 3%, 5%, 7%, 9% and 10% diluted with distilled water by 20% Intralipid to study the scattering features. It is known that the scattering coefficient becomes larger with Intralipid concentration. The single-backscattering model considering the confocal PSF was used to fit the scattering coefficient of different concentration of Intralipid in our system. The fitting model using the standard deviation as weights is based on equation (2) with an added offset A1 and multiplier A0. For each fit, A1, A0 and μt (μt ≈ μs) were the three running parameters. The fitting form is given as follows:
| (3) |
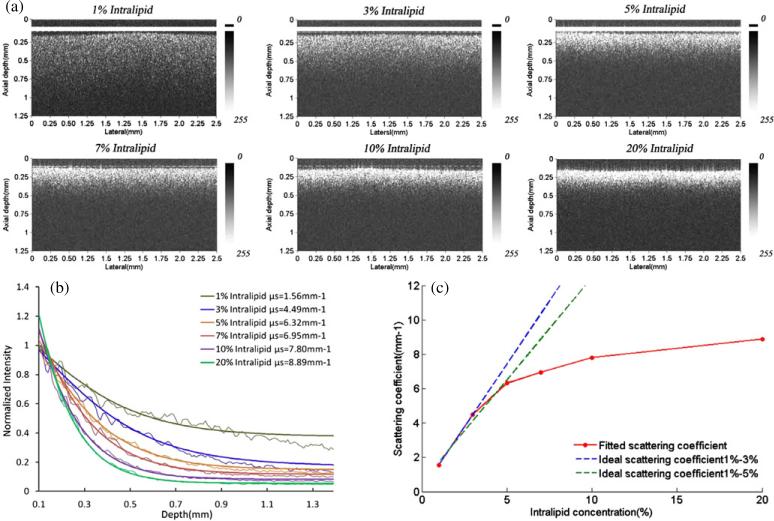
First, we select a transverse region of interest (ROI) from a given OCT image, consisting of several adjacent depth scans. These adjacent depth scans are averaged along the lateral direction and a smoothing algorithm with a 5-pixel kernel is applied along the depth direction. The smoothing algorithm used in this paper is running average to smooth the averaged curve for better fitted results. The depth pixels can be fitted using the selected scattering model with the smoothed, averaged A-scan. However, to remove the specular reflection, the pixels near the interface between the scattering and non-scattering media are excluded from the fit. The results are 1.56, 4.49, 5.32, 6.95, 7.62 and 7.80 mm–1 with the concentration of 1%, 3%, 5%, 7%, 9% and 10%, respectively, which is in accordance with the results of Kah (Kah et al 2009). Figure 2 shows (a) the OCT images of Intralipid with different concentrations and (b) the corresponding curve fitting results with the single backscattering considering the confocal PSF. The detecting depth of Intralipid decreases along with the increase in concentration given in figure 2(a). Figure 2(c) gives the relationship between the concentration and scattering coefficient of Intralipid. The blue dotted line is the linear fitting result of the concentration from 1% to 3%, which gives the result that the relation of the scattering coefficient and concentration of the Intralipid solution is linear. However, the green line is the linear fitting result of the concentration from 1% to 5%, which shows the nonlinear relation between the scattering coefficient and concentration (Kah et al 2009). The results demonstrate that the μs of Intralipid increases proportionately with lower concentrations. For the higher concentration of Intralipid, the μs does not obey the linear relations the same as for the low concentration (Kah et al 2009).
Figure 2.
(a) The OCT images of Intralipid, (b) the fitted curve based on the single-backscattering considering the confocal PSF to extract the sample μs and (c) the relation of Intralipid concentration and scattering coefficient μs.
3. The quantitative analysis of rectal cancer
The recta were imaged immediately after surgical excision. To get enough data, 16 recta with normal and malignant tissues from 16 patients (the age ranges from 45 to 80) were studied. The detailed patient information is given in table 1. The study protocol was approved by the ethical committee of Nankai University Affiliated Hospital and signed informed consents were obtained from all patients. On every rectum, we acquired 20–30 measurements of normal and malignant tissues, respectively. In total, we obtained a total of 1000 measurements (half and half of normal and malignant tissues) to implement the quantitative analysis of the rectal diseases.
Table 1.
The detailed information of the patients.
| Information |
|||||
|---|---|---|---|---|---|
| Patients numbera | Gender | Age | Admitting diagnosis (AD) | Operation information | Pathological diagnosis |
| 146291 | Male | 59 | Rectal tumor | Miles | Moderately differentiated adenocarcinoma, T2N0Mx Ducks A |
| 146251 | Female | 58 | Rectal cancer | Rectal low anterior resection | Moderately differentiated adenocarcinoma, |
| 146333 | Male | 75 | Rectal tumor | Miles | Rectal mucous adenocarcinoma |
| 146698 | Male | 53 | Rectal tumor | Right hemicolectomy; rectal low anterior resection | Rectum: high school differentiated adenocarcinoma, T2N1Mx Ducks C colon: Moderately differentiated adenocarcinoma, T3N0Mx Ducks B |
| 147214 | Female | 51 | Rectal cancer | Laparoscopic resection of rectal cancer | High school differentiated adenocarcinoma, T2N0Mx Ducks A |
| 147446 | Male | 61 | Rectal cancer | Laparoscopic resection of rectal cancer | Rectal adenocarcinoma |
| 146904 | Male | 61 | Rectal cancer | Miles; Rectal tumor biopsy surgery | Rectal adenocarcinoma |
| 147868 | Male | 48 | Rectal tumor | Miles | Rectal adenocarcinoma, T2N0M0 Dukes C |
| 145232 | Male | 64 | Rectal tumor | Rectal cancer resection | Moderately differentiated adenocarcinoma, T3N1Mx Ducks C |
| 148556 | Male | 80 | Rectal cancer | Rectal low anterior resection | Rectal adenocarcinoma |
| 149118 | Female | 53 | Rectal tumor | Miles | High school differentiated adenocarcinoma, T3N0Mx Ducks B |
| 149304 | Male | 72 | Rectal cancer resection | Laparoscopic ultra-low anterior | Rectal adenocarcinoma |
| 149397 | Female | 54 | Rectal tumor | Rectal anterior resection | Rectal adenocarcinoma, Dukes B |
| 149764 | Female | 50 | Rectal cancer | Rectal low anterior resection | Rectal adenocarcinoma |
| 149837 | Male | 59 | Rectal tumor | Laparoscopic resection of rectal cancer | Rectal adenocarcinoma, T3N1M0 Dukes C |
| 150104 | Male | 54 | Rectal tumor | Laparoscopic low anterior resection | High school differentiated adenocarcinoma, T3N0Mx Ducks B |
The patients’ number is coded by Nankai University Affiliated Hospital.
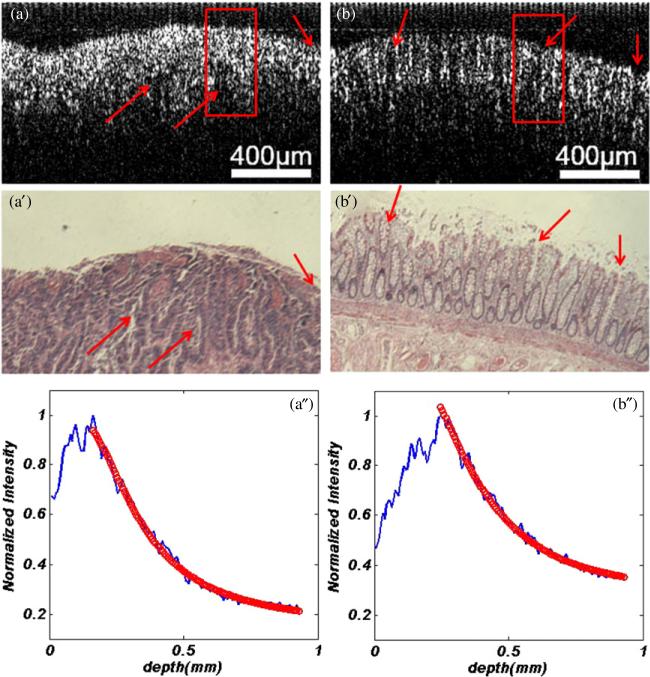
In the process of imaging, we put the surface of recta at the focal plane of the objective lens. OCT images with 600 A-scans of 4096 points were acquired. After imaging, a 200 μm ROI consisting of 100 A-lines was selected for averaging, which is representing the focal carcinoma in cancer tissue and the corresponding area in normal tissue. In the same OCT image, several ROIs may be selected for extracting the scattering coefficient. To avoid the surface curvature and interface signals, the signals about 20 μm below the tissue surface were used for curve fitting. For comparison, excised tissue samples were processed histologically. After the OCT imaging, the recta were fixed in formalin, embedded in paraffin, sectioned to 5 μm thickness, and stained with hematoxylin and eosin (H&E). Figure 3 shows the OCT and pathological images of one set of recta with normal and malignant tissues.
Figure 3.
One set of recta with (a) malignant tissue and (b) normal. (a) and (b) OCT images, (a′) and (b′) pathological images. The curving fitting of image (a) and (b) were shown in (a″) and (b″). The arrows in (a), (b), (a′) and (b′) indicate the similar locations in pathological and OCT images.
The μs extracted from the OCT images as shown in figures 3(a) and (b) are 1.40 mm–1 and 2.30 mm–1, respectively. The process of curve fitting with an averaged A-line was carried out as plotted in figures 3(a″) and (b″). From the pathological images (figures 3(a′) and (b′)), we can see that the region of cancer is composed of dense, irregular and twisty glands due to the cell differentiation and deterioration. Figure 3(a′) shows that the surface of the cancer tissue is full of erosion and ulcer. In addition, the goblet cells and muscularis mucosa of tissue disappear. However, the normal rectal mucous membrane (figure 3(b′)) gives regular glands formed by goblet cells located above muscularis mucosa. The OCT images give the same features as the pathological images shown in figures 3(a) and (b), respectively.
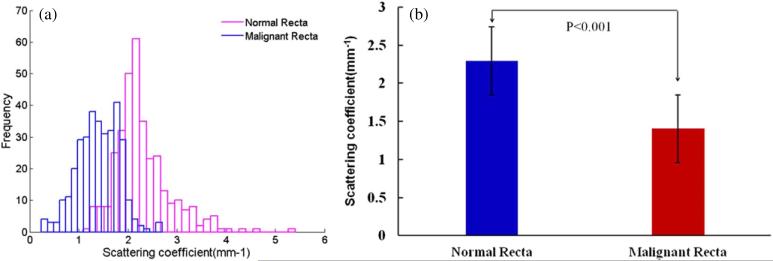
After extracting the μs values from the total measurements, figure 4(a) gives the histograms of the normal and malignant recta. From the figure, we can see that the normal recta tissue has a larger scattering coefficient ranging from 1.09 to 5.41 mm–1 with a mean value of 2.29 mm–1 (std: ± 0.32), while the malignant group shows a lower scattering property and the values ranging from 0.25 to 2.69 mm–1 with a mean value of 1.41 mm–1 (std: ±0.18). To test the statistical significance of the results, the standard error of each fitted parameter (μs) is calculated. From the standard errors, 95% confidence intervals are calculated which are more insightful as uncertainty estimates: if the fitting is repeated on another ROI from the same sample, the best-fit value of the parameter (μs) is expected to fall within these confidence intervals 95 times out of a 100. After calculating, the standard deviation per rectum in the normal group varies from 0.30 to 0.84 mm–1 and the malignant group ranging from 0.27 to 0.49 mm–1. Figure 4(b) shows the statistical significance (P < 0.001) of the two groups by the Student's t-test.
Figure 4.
(a) The histograms and (b) the statistical significance (P < 0.001) of the normal (mean ± std: 2.29 ± 0.32 mm–1) and malignant recta (mean ± std: 1.41 ± 0.18 mm–1).
The peri-cancer tissues of recta have also been studied. The scattering coefficient from the extraction of peri-cancer images is found between the normal and malignant recta ranging from 0.43 to 3.34 mm–1 with an average of 1.80 mm–1(std: ± 0.29). To analyze the difference of these three cases, the normalized percentages were calculated and have been shown in table 2.
Table 2.
Normalized percentages of OCT images of normal, peri-cancer and malignant recta that lies within each interval of scattering coefficient.
| Ranges of scattering coefficient (mm–1) | Normal Recta | Peri-cancer Recta | Malignant Recta |
|---|---|---|---|
| 0~0.5 | 0 | 1.2% | 1.8% |
| 0.5~1 | 0 | 6.8% | 14.0% |
| 1~1.5 | 4.2% | 17.9% | 42% |
| 1.5~2.0 | 24.1% | 39.5% | 37.5% |
| 2.0~2.5 | 44% | 26.5% | 3.6% |
| 2.5~3.0 | 16.1% | 6.8% | 0.9% |
| 3.0~3.5 | 7.4% | 1.2% | 0 |
| 3.5~4.0 | 3.0% | 0 | 0 |
| 4.0–4.5 | 0.3% | 0 | 0 |
From the data given above, we can see that the normal, peri-cancer and malignant recta can be distinguished by the scattering coefficient extracted from OCT images. As a result, it is a promising diagnostic criterion of early recta cancer for clinical practices. Due to the feasibility of endoscopic OCT, the disease can be diagnosed in real time and in vivo, which is an attractive apparatus for clinical medicine.
4. Summary
In this paper, we used the scattering coefficient to quantify the difference between normal and malignant recta. The results show that the malignant recta tissue has a lower scattering property than normal tissue. The scattering coefficient of tissue can be used as a promising diagnostic criterion of early rectal cancer, which has great value for clinical medical applications. Meanwhile, the OCT system can detect diseases in real time and in vivo, which is an attractive apparatus for clinical medicine.
Acknowledgments
This work was partially supported by the Ministry of Science and Technology of China under National Basic Research Program of China (973) grant no. 2010CB327702.
References
- Adegun OK, Tomlins PH, Hagi-Pavli E, Mckenzie G, Piper K, Bader DL, Fortune F. Quantitative analysis of optical coherence tomography and histopathology images of normal and dysplastic oral mucosal tissues. Lasers Med. Sci. 2011;27:795–804. doi: 10.1007/s10103-011-0975-1. [DOI] [PubMed] [Google Scholar]
- American Cancer Society . Cancer Facts and Figures. American Cancer Society; Atlanta, GA: 2010. http://www.cancer.org/Research/CancerFactsFigures/index. [Google Scholar]
- Faber D, van der Meer F, Aalders M, van Leeuwen T. Quantitative measurement of attenuation coefficients of weakly scattering media using optical coherence tomography. Opt. Express. 2004;12:4353–65. doi: 10.1364/opex.12.004353. [DOI] [PubMed] [Google Scholar]
- Gao SS, Xia A, Yuan T, Raphael PD, Shelton RL, Applegate BE, Oghalai JS. Quantitative imaging of cochlear soft tissues in wild-type and hearing-impaired transgenic mice by spectral domain optical coherence tomography. Opt. Express. 2011;19:15415–28. doi: 10.1364/OE.19.015415. [DOI] [PMC free article] [PubMed] [Google Scholar]
- Giovannucci E, Wu K. Cancers of the colon and rectum. In: Schottenfeld D, Fraumeni J, editors. Cancer Epidemiology and Prevention. 3rd edn Oxford University Press; New York: 2006. [Google Scholar]
- Giusto A, Saija R, Iatì MA, Denti P, Borghese F, Sindoni OI. Optical properties of high-density dispersions of particles: application to intralipid solutions. Appl. Opt. 2003;42:4375–80. doi: 10.1364/ao.42.004375. [DOI] [PubMed] [Google Scholar]
- Hariri LP, Bonnema GT, Schmidt K, Winkler AM, Korde V, Hatch KD, Davis JR, Brewer MA, Barton JK. Laparoscopic optical coherence tomography imaging of human ovarian cancer. Gynecol. Oncol. 2009;114:188–94. doi: 10.1016/j.ygyno.2009.05.014. [DOI] [PMC free article] [PubMed] [Google Scholar]
- Hsiung PL, Phatak DR, Chen Y, Aguirre AD, Fujimoto JG, Connolly JL. Benign and malignantlesions in the human breast depicted with ultrahigh resolution and three-dimensional optical coherence tomography. Radiology. 2007;244:865–74. doi: 10.1148/radiol.2443061536. [DOI] [PubMed] [Google Scholar]
- Huang D, et al. Optical coherence tomography. Science. 1991;254:1178–81. doi: 10.1126/science.1957169. [DOI] [PMC free article] [PubMed] [Google Scholar]
- Kah JCY, CHow TH, Sheppard CJR. Concentration dependence of gold nanoshells on the enhancement of optical coherence tomography images: a quantitative study. Appl. Opt. 2009;48:D96–108. doi: 10.1364/ao.48.000d96. [DOI] [PubMed] [Google Scholar]
- Kraft M, Glanz H, von Gerlach S, Wisweh H, Lubatschowski H, Arens C. Clinical value of optical coherence tomography in laryngology. Head Neck. 2008;30:1628–35. doi: 10.1002/hed.20914. [DOI] [PubMed] [Google Scholar]
- Lee P, Gao W, Zhang X. Performance of single-backscattering model versus multiple-scattering model in the determination of optical properties of biological tissue with optical coherence tomography. Appl. Opt. 2010;49:3538–44. doi: 10.1364/AO.49.003538. [DOI] [PubMed] [Google Scholar]
- Levitz D, Thrane L, Frosz M, Andersen P, Andersen C, Andersson-Engels S, Valanciunaite J, Swartling J, Hansen P. Determination of optical scattering properties of highly-scattering media in optical coherence tomography images. Opt. Express. 2004;12:249–59. doi: 10.1364/opex.12.000249. [DOI] [PubMed] [Google Scholar]
- Liu Z, Guo Z, Zhuang Z, Zhai J, Xiong H, Zeng C. Quantitative optical coherence tomography of skin lesions induced by different ultraviolet B sources. Phys. Med. Biol. 2010;55:6175–85. doi: 10.1088/0031-9155/55/20/009. [DOI] [PubMed] [Google Scholar]
- McLaughlin RA, Scolaro L, Robbins P, Hamza S, Saunders C, Sampson DD. Imaging of human lymph nodes using optical coherence tomography: potential for staging cancer. Cancer Res. 2010;70:2579–84. doi: 10.1158/0008-5472.CAN-09-4062. [DOI] [PubMed] [Google Scholar]
- Schmitt JM, Knüttel A. Model of optical coherence tomography of heterogeneous tissue. J. Opt. Soc. Am. A. 1997;14:1231–42. [Google Scholar]
- Schmitt JM, Knüttel A, Bonner RF. Measurement of optical properties of biological tissues by low-coherence reflectometry. Appl. Opt. 1993;32:6032–42. doi: 10.1364/AO.32.006032. [DOI] [PubMed] [Google Scholar]
- van der Meer FJ, Faber DJ, Baraznji Sassoon DM, Aalders MC, Pasterkamp G, van Leeuwen TG. Localized measurement of optical attenuation coefficients of atherosclerotic plaque constituents by quantitative optical coherence tomography. IEEE Trans. Med. Imaging. 2005;24:1369–76. doi: 10.1109/TMI.2005.854297. [DOI] [PubMed] [Google Scholar]
- van Staveren HJ, Moes CJM, van Marle J, Prahl SA, van Gemert MJC. Light scattering in Intralipid-10% in the wavelength range of 400–1100 nm. Appl. Opt. 1991;30:4507–14. doi: 10.1364/AO.30.004507. [DOI] [PubMed] [Google Scholar]
- Yi Y, Wang T, Biswal NC, Wang X, Sanders M, Brewer M, Zhu Q. Optical scattering coefficient estimated by optical coherence tomography correlates with collagen content in ovarian tissue. J. Biomed. Opt. 2011;16:090504. doi: 10.1117/1.3625247. [DOI] [PMC free article] [PubMed] [Google Scholar]
- Zaccanti G, Del Bianco S, Martelli F. Measurements of optical properties of high-density media. Appl. Opt. 2003;42:4023–30. doi: 10.1364/ao.42.004023. [DOI] [PubMed] [Google Scholar]
- Zhang QQ, Wang JG, Wang MW, Bu J, Zhu SW, Wang R, Gao BZ, Yuan X-C. A modified fractal zone plate with extended depth of focus in spectral domain optical coherence tomography. J. Opt. 2011;13:055301. doi: 10.1088/2040-8978/13/5/055301. [DOI] [PMC free article] [PubMed] [Google Scholar]


