Abstract
A 1 mm3 resolution clinical positron emission tomography (PET) system employing 4608 position-sensitive avalanche photodiodes (PSAPDs) is under development. This paper describes a detector multiplexing technique that simplifies the readout electronics and reduces the density of the circuit board design. The multiplexing scheme was validated using a simulation framework that models the PSAPDs and front-end multiplexing circuits to predict the signal-to-noise ratio and flood histogram performance. Two independent experimental setups measured the energy resolution, time resolution, crystal identification ability and count rate both with and without multiplexing. With multiplexing, there was no significant degradation in energy resolution, time resolution and count rate. There was a relative 6.9 ± .0% and 9.4 ± 1.0% degradation in the figure of merit that characterizes the crystal identification ability observed in the measured and simulated ceramic-mounted PSAPD module flood histograms, respectively.
1. Introduction
Currently, positron emission tomography (PET) does not play a significant role in breast cancer management. Standard whole-body clinical PET systems have low photon efficiency geometries, long scan times, and insufficient spatial and contrast resolutions required to be useful in earlier stages of breast cancer identification. To address these issues, a two-panel breast-dedicated PET system (figure 1) with 1 mm3 intrinsic resolution and high photon sensitivity is under development in our laboratory (Levin et al 2006, Zhang et al 2007, Lau et al 2008).
Figure 1.
Left: breast-dedicated PET system with 9 × 16 cm2 detector heads and data acquisition electronics. Middle: a potential breast imaging orientation for a patient standing/sitting upright. Right: another potential breast imaging orientation for a patient standing/sitting upright (top view).
While clinical systems typically detect only about 1% of the photon pairs emitted from the breast, simulations showed that this system’s sensitivity is 14% and 8%, for a panel separation of 4 cm and 8 cm respectively (energy window 350–650 keV; time window 6 ns) (Zhang et al 2007). In contrast to other breast-dedicated PET system designs (Abreu et al 2006, Raylman et al 2008, Wu et al 2009, Wang et al 2006, Weinberg et al 2005, Doshi et al 2001, Furuta et al 2009, Freifelder & Karp 1997), the proposed system has a higher intrinsic spatial resolution of 1 mm3, higher (>10%) absolute photon sensitivity, higher (<14% FWHM) energy resolution at 511 keV, and a unique ‘edge-on’ orientation for the detector arrays.
To achieve 1 mm3 intrinsic resolution, the system must be able to locate the photon within a millimeter in three dimensions. To achieve this, we create PET detector modules, called dual-PSAPD modules, comprising arrays of 1 × 1 × 1 mm3 lutetium-oxyorthosilicate (LSO) elements coupled to PSAPDs mounted directly on flex circuits. We stack these modules, as depicted in figure 2, in a novel ‘edge-on’ orientation with respect to incoming 511 keV photons. This enables (1) 1 mm directly measured photon ‘depth-of-interaction’ (DOI), (2) 3D positioning of photon interactions occurring in multiple LSO arrays which could resolve individual interaction coordinates of multi-interaction photon events and (3) >90% scintillation light collection efficiency, independent of interaction location (Levin 2002).
Figure 2.
Depiction of how the dual-PSAPD modules are stacked. (a) Depiction of one dual-PSAPD module, which consists of two scintillation crystal arrays and two PSAPDs configured two units deep with respect to incoming 511 keV photons, mounted directly on a flex circuit. (b) A stack of dual-PSAPD modules with 511 keV photons entering edge-on. The design enables 1 mm3 intrinsic resolution, directly measured 1 mm DOI resolution, the capability to position the 3D interaction coordinates of multiple interaction photon events, and >90% scintillation light collection efficiency, independent of interaction location.
In this configuration, two 16 × 9 cm2 panels (figure 1) require 2304 dual-PSAPD modules, which, if left un-multiplexed, would result in over 27 000 PSAPD signals that need to be read out by the front-end electronics. The tight packing of the detectors prevents placement of the front-end application-specific integrated circuits (ASICs) close to the detectors. Therefore, our design requires dense interconnect between the detectors and the front-end ASIC, while maintaining a low noise environment since the measured analog signals are small (less than 1 pC). In addition, the PSAPDs require a bias voltage of −1750 V, so these weak analog signals must be interleaved with high voltage signals. Clearly, multiplexing some of these signals would simplify the readout electronics and reduce the complexity of the circuit board design, resulting in a smaller, simpler system.
Multiplexing has previously been used for photomultiplier tubes (PMTs) (Siegel et al 1996, Doshi et al 2001, Popov et al 2001, 2006, Olcott et al 2005a). Multiplexing has also been investigated for silicon photomultiplier detectors (Olcott et al 2009). However, PSAPDs typically have a factor of 1000 to 10 000 less gain than PMTs and silicon photomultipliers. This lower gain limits the number of channels that can be multiplexed together before the energy, time and spatial resolution of the system are degraded. None of the prior work on multiplexing avalanche photodiodes (APDs) can be used in our design. Since our limitation is in the wiring from the detector to the ASIC, neither digital multiplexing (Shimazoe et al 2006) nor analog front-end multiplexing inside an ASIC (Abreu et al 2006) addresses our issues. Zhang solved a similar problem using transformers (Zhang et al 2006), but transformers have the disadvantage of being bulky and cannot be used in our solution.
The next section describes the proposed multiplexing approach and the electronics used to validate it. To better understand the system noise components and to ensure that multiplexing does not degrade performance, we created a simulation framework that models the scintillation crystal light output, PSAPD and multiplexing circuits, which is described in sections 3.1–3.3. We validated the multiplexing scheme using two independent experimental setups. The setup using ceramic-mounted PSAPDs is described in section 3.4 and the setup using flex-mounted PSAPDs is described in section 3.5. For each setup, we compared performance metrics such as energy resolution, crystal identification, time resolution and count rate for the two configurations. These results are given in section 4. Section 5 discusses how the proposed multiplexing scheme is capable of reducing the number of signal traces and channels without degrading performance.
2. Methods
2.1. Analog signal multiplexing configuration
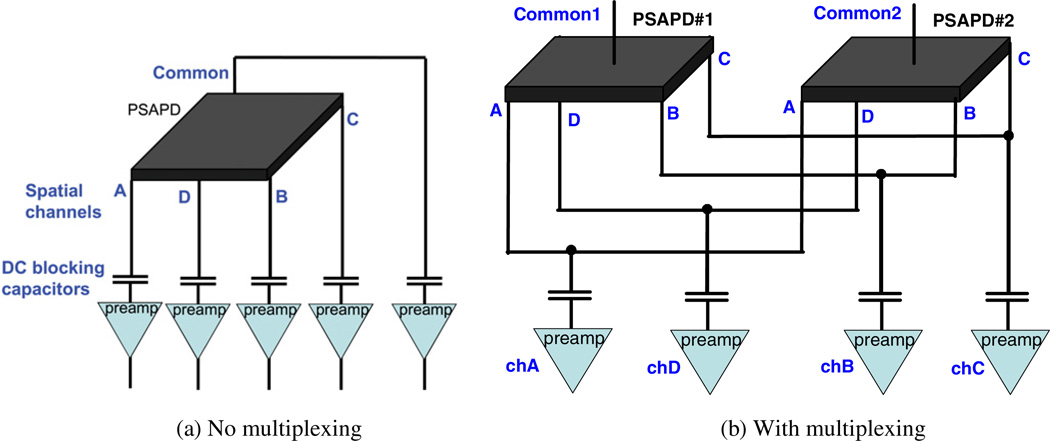
The proposed multiplexing method is shown in figure 3. The output terminals of the spatial channels of the two PSAPDs on a flex circuit are connected directly together. The common signals are kept independent (un-multiplexed) so the LSO-PSAPD detector in which an interaction occurred can be identified. Unlike multiplexing schemes where the channel count is reduced after the first stage of electronics (Shimazoe et al 2006, Abreu et al 2006), this scheme multiplexes the PSAPD spatial channel outputs directly. Since the multiplexing is performed on the analog PSAPD outputs instead of on the signals after digitization, this proposed technique is called ‘analog signal multiplexing’. This multiplexing scheme is feasible with the PSAPDs used in this system which have a gain of about 1000, unlike the APDs used in other designs which only have a gain of about 50–150 (Grazioso et al 2005, 2006, Abreu et al 2006, Pichler 2004, Judenhofer et al 2007). In those designs, there is a preamplifier and associated circuitry for every APD pixel. Other designs with PSAPDs (Shah et al 2004) use the PSAPD to read out one scintillation crystal array coupled to the PSAPD, using the arrangement shown in figure 3(a). In contrast, we multiplex two PSAPDs together, enabling the readout of two scintillation crystal arrays using the arrangement shown in figure 3(b).
Figure 3.
Circuit configurations without and with multiplexing. For simplicity, the dynamic range scaling capacitors (described in section 2.2) and bias resistors are omitted and only the DC blocking capacitor and preamplifier for the spatial channels are shown. The configuration for the common will be discussed in section 2.2. (a) No multiplexing. (b) With multiplexing.
The approach presented in this paper obtains energy and time information from the un-multiplexed common. Position information is obtained from the multiplexed spatial channels. In contrast, Zhang et al (2006) ignored the common terminal and obtained energy, time and position information from the multiplexed spatial channels. Although their technique requires one less channel, the disadvantage is that there may be degradation in energy and time measurements. In addition, their technique cannot reject the occasional case of interactions occurring in both PSAPDs of the dual-module.
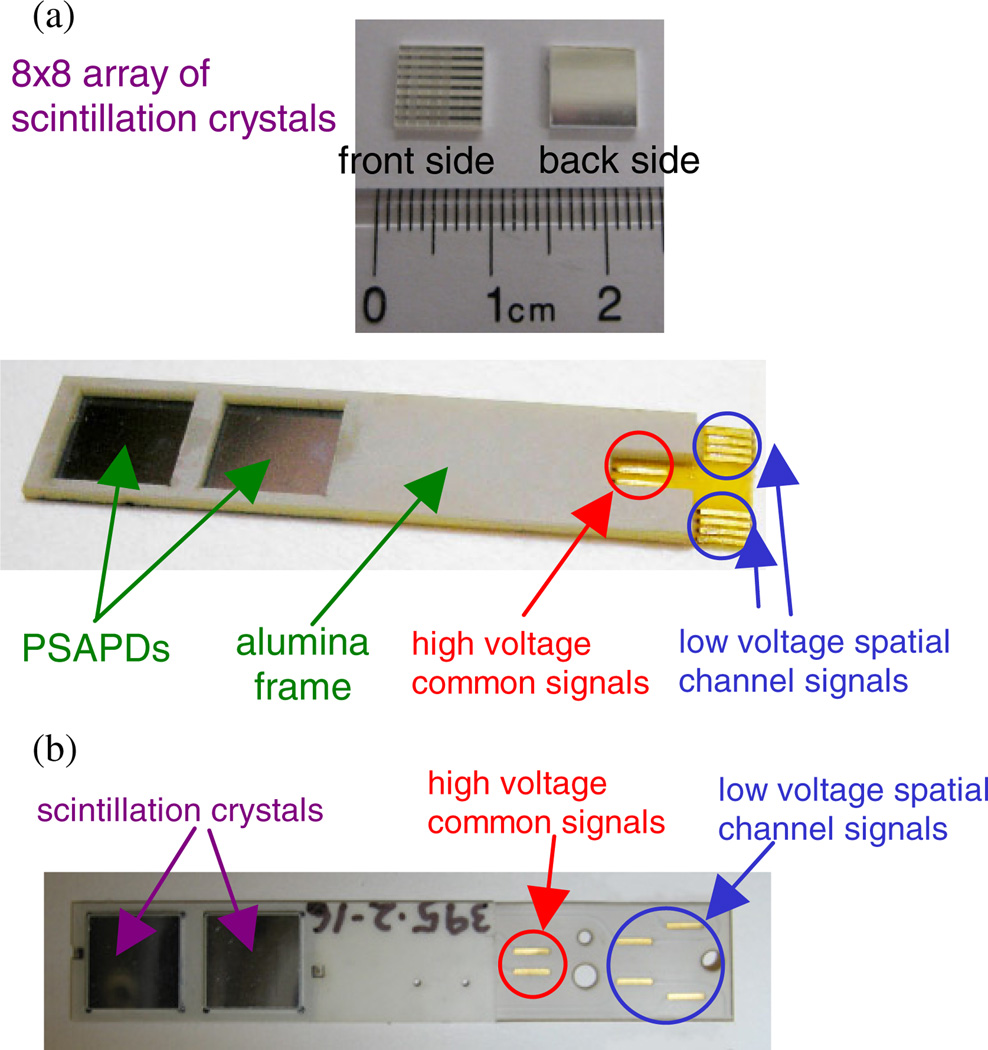
This work modified the scheme presented earlier (Olcott et al 2005b) by transforming the multiplexing circuit into an electrically equivalent circuit that multiplexes before the DC blocking capacitors instead of after. By multiplexing before the capacitors, the number of DC blocking capacitors was halved and the channels could be multiplexed on the detector flex circuit, reducing the number of traces coming out of the detector, as seen in figure 4.
Figure 4.
Pictures of un-multiplexed and multiplexed modules. (a) Un-multiplexed dual-PSAPD module. There are a total of ten terminals (two high voltage and eight low voltage terminals). The scintillation crystal arrays will be placed on top of the PSAPDs. The alumina frame provides mechanical support and facilitates thermal regulation. (b) Multiplexed dual-PSAPD module. For this new design, there are a total of six terminals (two high voltage and four low voltage terminals), compared to ten terminals in the un-multiplexed design. The scintillation crystal arrays were already placed on top of the PSAPDs in this picture, and their back sides are showing.
2.2. Readout ASIC and necessary dynamic range scaling
The proposed multiplexing scheme was experimentally validated using a front-end readout ASIC developed by NOVA R&D (Riverside, CA) called the RENA-3. The RENA-3 contains 36 channels, where each channel consists of preamplifier, Gaussian shaper and sample-hold circuits. Each channel can also be configured to generate a time stamp for pulses detected using a leading edge discriminator. The two user-selectable full-scale input dynamic ranges are 9 fC and 54 fC (NOVA R&D 2007). Since the estimated charge output from a PSAPD coupled to LSO is roughly 1 pC (see section 3.1), the signals from the PSAPD exceed the dynamic range of the RENA-3 preamplifier. It was necessary to attenuate the charge entering each RENA-3 channel with the least amount of signal-to-noise ratio (SNR) degradation possible.
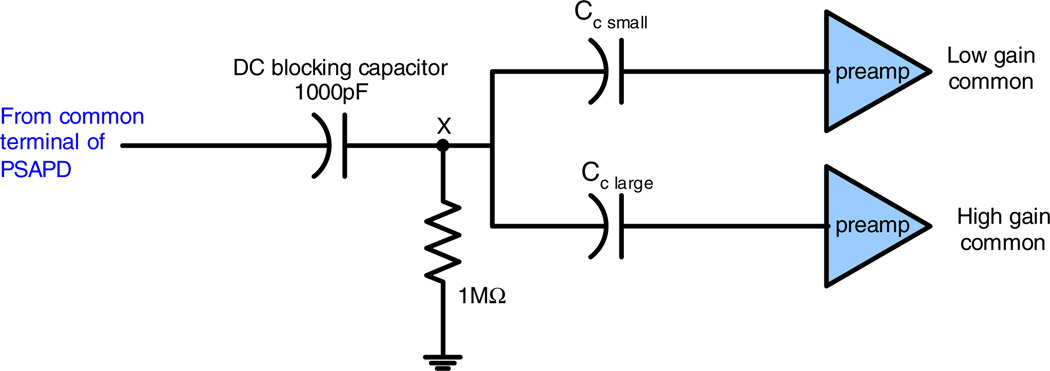
For the common signal, the signal was split into two RENA-3 channels using a capacitive divider (see figure 5), choosing a division ratio so that one is a low gain common used for measuring the energy of the signal pulse, and the other is a high gain common that is saturated and used for measuring the time of the pulse. A simulation using two circuit simulation tools, H-SPICE and Verilog-A, modified from Lau et al (2007), estimated the ratio of capacitors required. The charge splitting ratio was approximately 9:1.
Figure 5.
Dynamic range scaling scheme for the common signal. Cc_large and Cc_small form a capacitive divider. The common terminal of the PSAPD has a DC value of − 1750 V, which is blocked by the 1000 pF capacitor. The 1 MΩ resistor is necessary to ensure the DC value of node X remains at 0 V so that Cc_small and Cc_large do not need to be rated for high voltage.
Splitting the charge has the advantage of utilizing some of the excess charge instead of simply shunting all the charge to ground using a capacitor. The charge in the high gain common saturates the preamplifier into a slew rate limiting operating mode. In this mode, the time walk caused by the leading edge discriminator is decreased, although not eliminated. Also, by triggering on both commons, each with a different threshold, two independent measurements of the time of the pulse can be used to improve time resolution (Reynolds et al 2010). Another advantage of using two RENA-3 channels instead of using a capacitor to shunt the charge to ground is that the capacitance at the input of either preamplifier, and hence the input referred preamplifier noise, is almost the same as in a design without this dynamic range scaling.
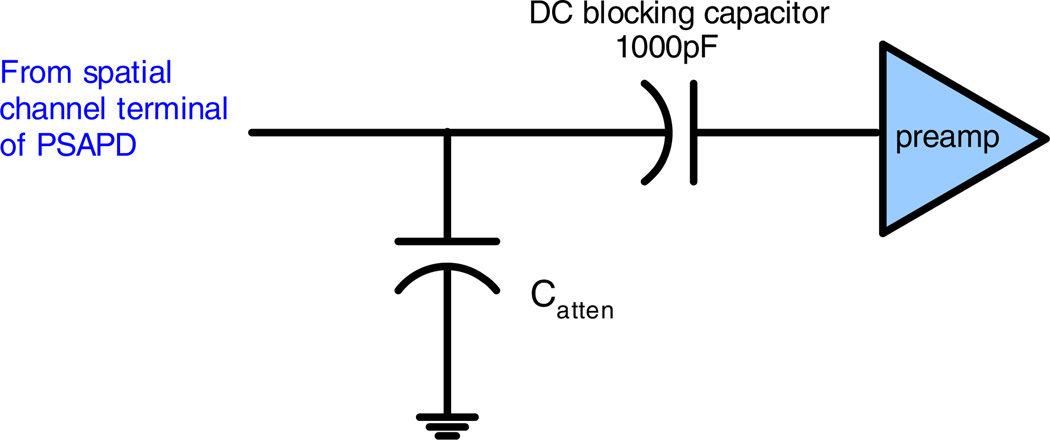
For the spatial channels, splitting each signal into two channels was not feasible because that would require over 9000 additional readout channels in the system. Therefore, the signal dynamic range is scaled by shunting some charge to ground using a capacitor, as shown in figure 6. The disadvantage of this method is that it increases the capacitance at the input of the preamplifier and hence increases the input-referred preamplifier noise. As long as the capacitor value is chosen so that this increased noise is tolerable, this method is acceptable. The ground of the capacitor is connected to the analog ground pins of the RENA-3, which is the reference for the preamplifiers inside the RENA-3.
Figure 6.
Dynamic range scaling scheme for the spatial channels. Catten and the DC blocking capacitor form a capacitive divider.
Dynamic range scaling attenuated the PSAPD signal, inevitably reducing the SNR and degrading all the performance metrics. The ideal readout ASIC would have a dynamic range suitable for PSAPDs and have a constant fraction discriminator (CFD) instead of a leading edge discriminator for time pick-off. Alternatively, an ASIC that digitizes the waveform may also be better since digital algorithms can be used to extract the time. However, since no better ASIC was available, the dynamic range scaling techniques presented allowed the RENA-3 to read out the PSAPDs and tried to make the best out of the situation by utilizing some of the excess charge to improve time resolution.
3. Simulation and experimental setup
3.1. Model of detector and electronics and noise analysis
A good multiplexing scheme does not degrade the performance of the system. To study this, the detector and circuits, including their noise components, were modeled using a combination of H-SPICE, Verilog-A and Matlab. Three main noise sources were modeled: (1) the LSO scintillation crystal, (2) the PSAPD and (3) the electronics.
To model noise, the noise components were categorized into three types: (a) independent noise, (b) distributed noise and (c) proportional noise. Independent noise (represented by Anoise) is noise that is independent between spatial channels. Distributed noise (δA) is noise that is distributed across the detector. Proportional noise (kAlight) is proportional to the signal and correlated between the spatial channels. Table 1 summarizes how noise from the three noise sources can be categorized into these three types of noise. The remainder of this section describes each noise source in detail.
Table 1.
Categorization of noise.
| Type of noise | |||||
|---|---|---|---|---|---|
| Noise source |
Independent noise (Anoise) |
Distributed noise (δA) | Proportional noise (kAlight) | ||
| Scintillation crystal | None | None | Poisson variance in number of light photons produced from each interaction—modeled in Matlab | ||
| Secondary scintillator effects—modeled in Matlab | |||||
| PSAPD | None | Leakage current shot noise—modeled in FEM (Verilog-A) | Shot noise due to light signal—modeled in Matlab | ||
| Thermal noise from resistive sheet—modeled in FEM (H-SPICE) | Poisson variance in PSAPD gain—modeled in Matlab | ||||
| Excess noise factor—modeled in Matlab | |||||
| Electronics | RENA-3 ASIC thermal noise—modeled in Matlab | None | None | ||
3.1.1. LSO scintillation crystal array
Noise originating from the LSO scintillation crystal array is proportional to the signal. The number of light photons produced from each high energy photon interaction is a Poisson random variable which was modeled in Matlab. The light produced by the crystal has a spatial distribution, which affects the spatial resolution. The modeling of this spatial distribution is described in section 3.3.
Secondary effects such as scintillator transfer efficiency, non-proportionality and inhomogeneities are difficult to model since the understanding of these effects is limited (Wernick & Aarsvold 2004, Moses et al 2008). Therefore, we simply modeled it as an additional variance. The standard deviation of this additional variance was chosen so that the sum of all the noise sources added together in quadrature matched the experimentally measured energy resolution of 14.5% full-width-at-half-maximum (FWHM) (see figure 16). Fortunately, the contribution of this type of noise to the flood histogram simulation was minor, as explained in section 5.
Figure 16.
Overall energy spectrum obtained from the common channel of the ceramic-mounted LSO-PSAPD detectors, produced after calibrating out per-crystal gain differences. The RENA-3 ASIC was used for readout. (a) Overall energy spectrum for the un-multiplexed case. Overall energy resolution is 14.6 % ± 0.8% FWHM for the 511 keV photo-peak. (b) Overall energy spectrum for the multiplexed case. Overall energy resolution is 14.4% ± 0.8% FWHM for the photo-peak.
In the model, we assumed that 25 visible light photons were produced in LSO per keV (Knoll 2000) and the efficiency of visible light photons hitting the PSAPD was 0.9. The output of the LSO array was estimated to be a current pulse with a rise time constant of 0.5 ns and a decay time constant of 46 ns (Moszynski et al 1996, Shao 2007). This current pulse was used as the input to the PSAPD model.
3.1.2. PSAPD
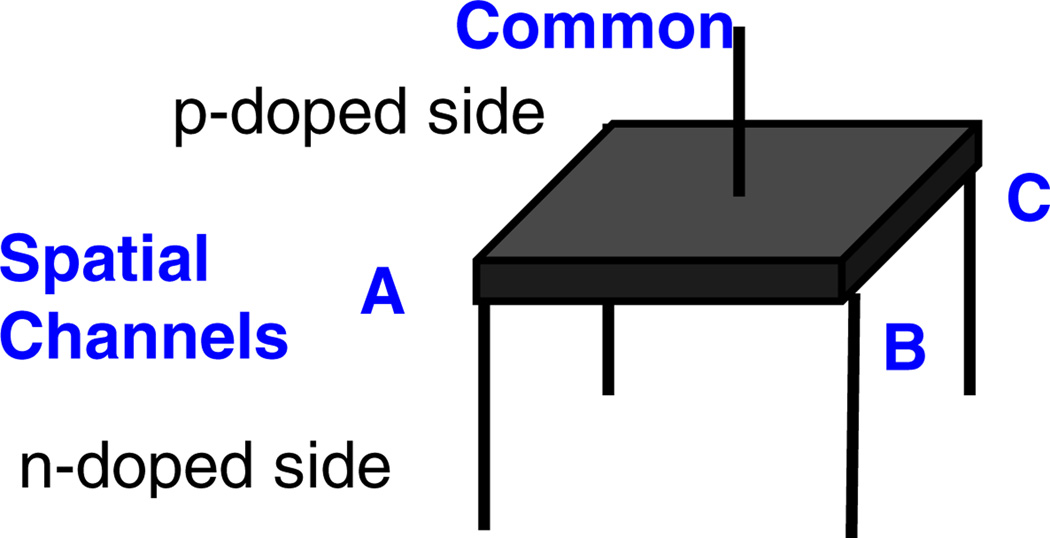
The basic PSAPD is a 10 × 10 mm2 silicon device made by Radiation Monitoring Devices (RMD), Inc. (Watertown, MA) (Shah et al 2002). As shown in figure 7, this basic PSAPD has four corner contacts, called ‘spatial channels’, on a resistive sheet on the n-doped side for positioning interactions using a position dependent charge splitting. The p-doped side has one contact that is called the ‘common’. The quantum efficiency is about 0.6. The PSAPD is biased with about −1750 V applied to the common contact. It has a gain of about 1000. The charge generated in the PSAPD from one 511 keV photon interacting in the LSO array is about 1 pC.
Figure 7.
Schematic of a PSAPD.
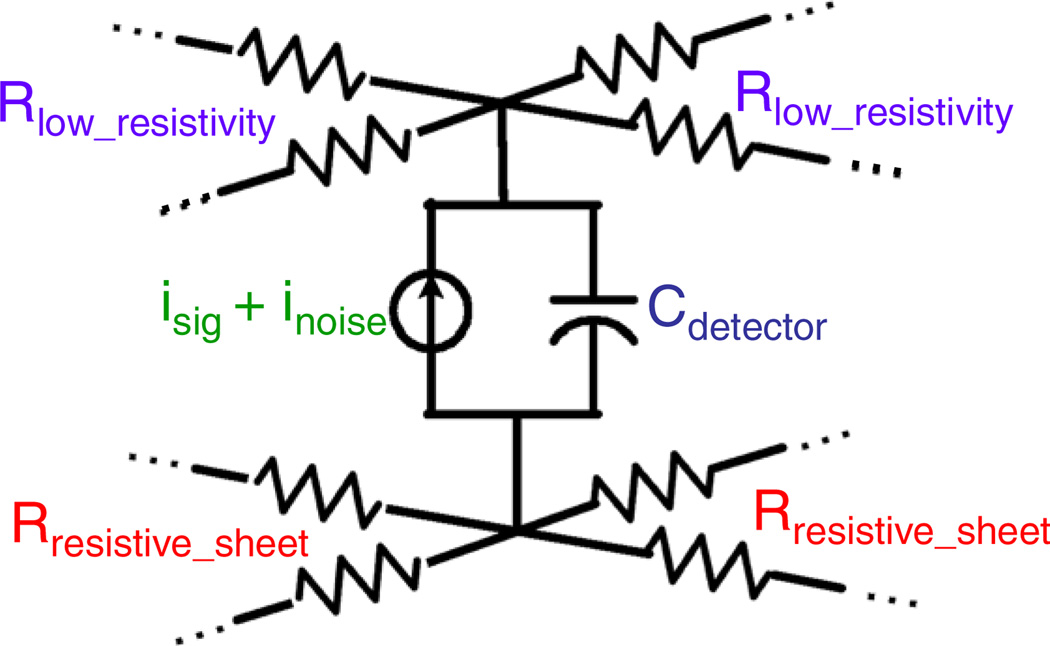
The PSAPD was represented in H-SPICE by a finite element model (FEM) with 100 subunits. Figure 8 illustrates one subunit of the FEM. Each subunit consists of a capacitor in parallel with a noise current source. The total device capacitance was assumed to be 45 pF (Dokhale et al 2004). The subunits were connected together with a high resistivity resistor grid representing the resistive sheet on the n-doped side for the spatial channels and a low resistivity grid for the common channel. Resistor elements of 5.2 kΩ and 250 Ω were used to model the sheet resistance at operating bias for the high and low resistivity layers respectively (Farrell 2009).
Figure 8.
One subunit of the FEM circuit model for PSAPD. Cdetector is the PSAPD capacitance, isig is the photodetection signal and inoise is the combination of all the noise sources. Rresistive_sheet models the high resistivity layer on the n-doped side of the PSAPD that is connected to the spatial channels. Rlow_resistivity models the low resistivity layer that is connected to the common. This FEM section is replicated 100 times.
The PSAPD has five noise sources: shot noise due to the leakage current, thermal noise in the resistive sheet, Poisson variance in the PSAPD gain, an excess noise factor and shot noise due to the light signal.
The noise due to leakage current (measured to be roughly 1 µA at a 1750 V bias) was modeled using Verilog-A as noise sources distributed across the device. The thermal noise from the high resistivity sheet was automatically modeled by the resistors in the grid implemented in H-SPICE. The bulk and surface leakage currents were not modeled since these DC currents will be blocked by a DC blocking capacitor.
The gain of the PSAPD has a variance which is described by Poisson statistics. Since the number of light photons in each typical interaction is large (over 10 000 for 511 keV photoelectric event), the distribution was approximated as Gaussian in Matlab simulations. The avalanche process in the PSAPD generates current fluctuations which degrade performance by an excess noise factor, which was assumed to be 2.5 (Shah 2005).
The shot noise due to the light signal is a type of proportional noise. It is difficult to create a detailed model since it is a time-varying noise process. Therefore, it was treated in the same manner in which secondary scintillator effects such as non-proportionality were treated. That is, it was assumed to be an additional variance, with standard deviation chosen so that the sum of all the noise sources matched the experimentally measured energy resolution. Again, fortunately, the contribution of this type of noise to the flood histogram simulation was minor, as explained in section 5.
To simulate the multiplexed case, two instances of the PSAPD model were created and their respective spatial channels connected together. Thus, as seen from the spatial channels, two instances of the PSAPD capacitance, high resistivity layer and noise sources are in parallel. Section 5 will analyze the implication of the multiplexing on performance.
3.1.3. Electronics
The outputs of this PSAPD circuit model were connected to an H-SPICE model of the preamplifier and shaper using the architectures in figures 5 and 6. The H-SPICE simulation estimated the power spectral density of the total noise at the output of the shaper for a particular channel. Integrating the power spectral density over frequency produced the output referred noise.
Using measurements of the noise of the RENA-3 ASIC as a function of capacitance, the output-referred noise was estimated and also incorporated in the simulation.
3.2. Signal-to-noise ratio (SNR) simulation
All the detector, electronics and noise models described in the previous section (section 3.1) were combined in a SNR simulation that predicted whether multiplexing would affect the energy, time and spatial resolution of the system. This simulation assumed that the charge divided equally to the four corners of the PSAPD, so it is mainly relevant for the case when the interaction occurred at the center of the detector. The case when the interaction is not necessarily at the center is treated in the flood histogram simulation that will be described in section 3.3.
The output of the simulation was a voltage pulse. Since the RENA-3 contains a peak detector, the peak of the pulse was recorded and denoted as the signal.
Using the noise simulations described in section 3.1, the output referred noise was computed. Then, the SNR was computed by dividing the calculated signal and noise values.
3.3. Flood histogram simulation
The SNR simulation cannot evaluate the crystal identification ability in a flood histogram image since it assumes that light is injected in the middle of the PSAPD. Also, the effect of multiplexing on the dynamic range of the spatial channel signals, and hence the distance between the peaks in the flood histogram, is not reflected by the SNR. Therefore, a simulation of interactions distributed across the array was performed to create a simulated flood histogram.
3.3.1. Detector setup
The detector modules are designed to be irradiated in an ‘edge-on’ configuration to achieve DOI positioning, as shown in figure 2. However, for producing flood histograms, it is useful to irradiate the detector in a ‘face-on’ configuration, as shown in figure 9. In a face-on configuration, the number of counts in each crystal in the array is more evenly distributed than in the edge-on configuration so it is easier to evaluate the detector’s crystal identification ability. Also, a larger number of total counts are obtained in a shorter amount of time. In the following simulation and experimental results, the face-on configuration is used for producing flood histograms and for evaluating energy resolution. The edge-on configuration is what will be used in the final system and is used in this paper for coincidence time resolution measurements.
Figure 9.
Face-on versus edge-on configurations. In the face-on configuration, the Na-22 point source is placed above the detector. In the edge-on configuration, the Na-22 source irradiates the edge of the detector. (a) Face-on. (b) Edge-on.
3.3.2. Simulation of signals
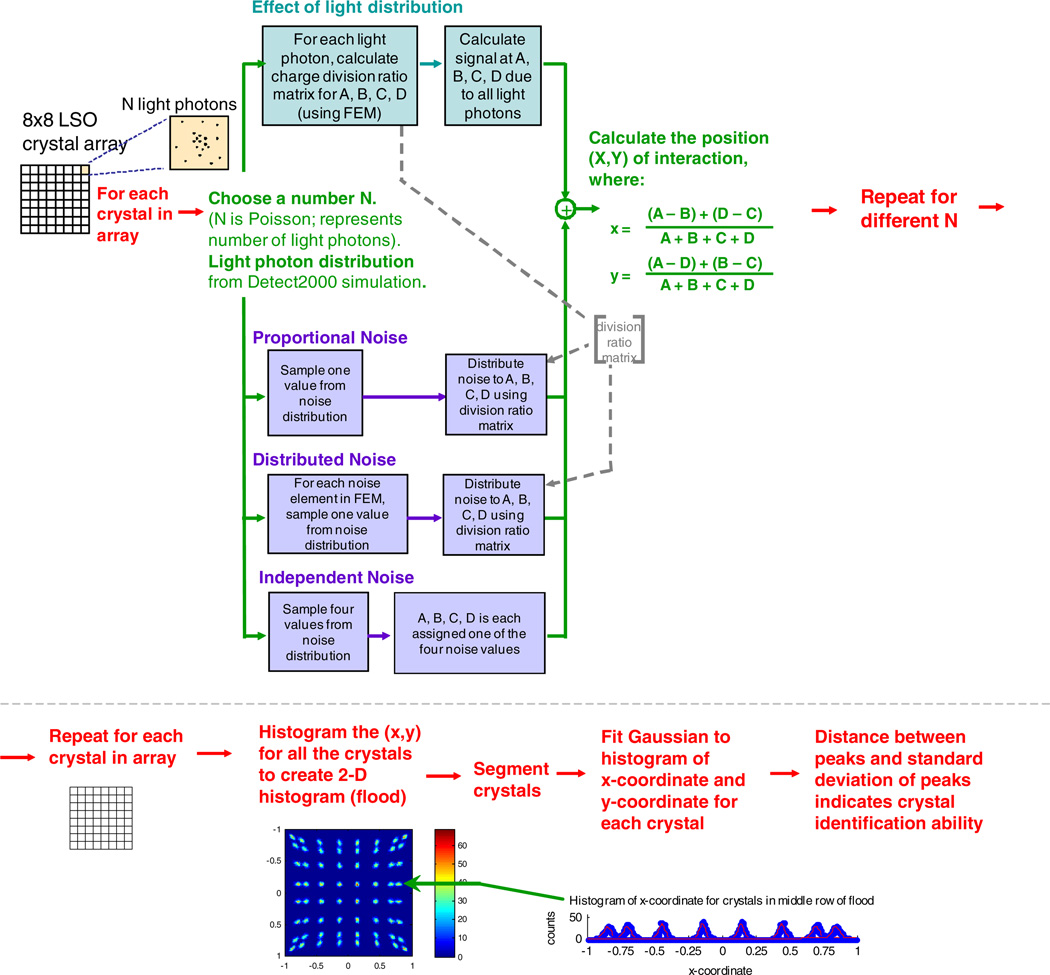
With a face-on configuration for the detector, the number of 511 keV photons interacting in each pixel of the scintillation crystal array is on average equal. Therefore, to produce a flood histogram, we assumed one 511 keV photon interacts in each crystal. Then, for each crystal in the array, a Poisson distributed number N was chosen to represent the number of light photons created by a 511 keV photon interacting in that crystal. Detect 2000 was used to simulate the spatial distribution of the light photons produced by that crystal. This is shown in the simulation flow in figure 10.
Figure 10.
Simulation flow chart for creating a simulated ‘flood histogram’, used to evaluate the crystal identification ability. An example simulated crystal flood histogram is shown at the bottom along with a profile through one crystal row.
The PSAPD produces charge in the location where the scintillation light hits. To understand how this charge is divided by the PSAPD resistive sheet to produce signals at the four corners, a current pulse was injected into a particular node of the PSAPD FEM. This produced voltage pulses at the spatial channel shaper outputs. The peak of the voltage pulses was identified since there is a peak detector in the RENA-3. By repeating this for each node of the FEM, a 10 × 10 matrix that indicates the charge division ratio due to the distributed resistance and capacitance of the PSAPD was produced.
For each photon in the Detect 2000 simulated light distribution, the simulation interpolated the charge division ratio matrix to estimate the signal values, Alight, Blight, Clight and Dlight measured at the four corners of the PSAPD.
3.3.3. Generation of flood histogram
The three types of noise, (a) independent noise, (b) distributed noise and (c) proportional noise, are simulated separately, as shown in figure 10. The signal and noise at each corner are combined to obtain the total signal. For example, for the first corner, the total signal, A, is A = Alight + Anoise + δA + kAlight. The following formulas calculated the position (x, y) of the interaction:
| (1.1) |
| (1.2) |
This entire process was repeated for one thousand values of N, representing one thousand 511 keV photon interactions in that crystal. Then, this was repeated for every crystal in the array to obtain a 2D histogram (flood) for the entire array.
3.3.4. Analysis of flood histogram
The crystal identification ability of the system is based on how well the histogram peaks in the flood can be distinguished. To analyze the flood histogram quantitatively, the crystals in the flood image were segmented and a Gaussian was fit to the histogram for each crystal. The distance between the peaks and the standard deviation of the peaks are two parameters that measure the crystal identification ability of a given configuration, combined into a figure of merit (FoM) metric which we use throughout this paper:
| (2) |
The denominator is the average width (FWHM) of the middle six peaks for that row. The crystal spots at the leftmost and rightmost edges of the row are left out of that average width calculation since there is a systematic difference in the characteristics of their position and width in the flood histogram, which is due to decreased gain at the edge of the PSAPD and ‘pin-cushion distortion’. The numerator is the average distance between the middle six peaks for that row (so five numbers are averaged together). A larger FoM indicates superior crystal identification. This FoM was used to analyze all flood histograms in this paper.
To capture the characteristics of the peaks at the edge of each row, an edge FoM metric is defined:
| (3) |
To compute the numerator, a particular row is identified, and the distance between the leftmost peak and the peak adjacent to it is computed. This is repeated for the rightmost peak, and the two results are averaged. The denominator includes the width of the leftmost and rightmost peaks as well as the peaks adjacent to them (so four numbers) since the width of all these four peaks contribute to the ability to isolate the edge crystals.
3.4. Experimental setup with ceramic-mounted PSAPDs
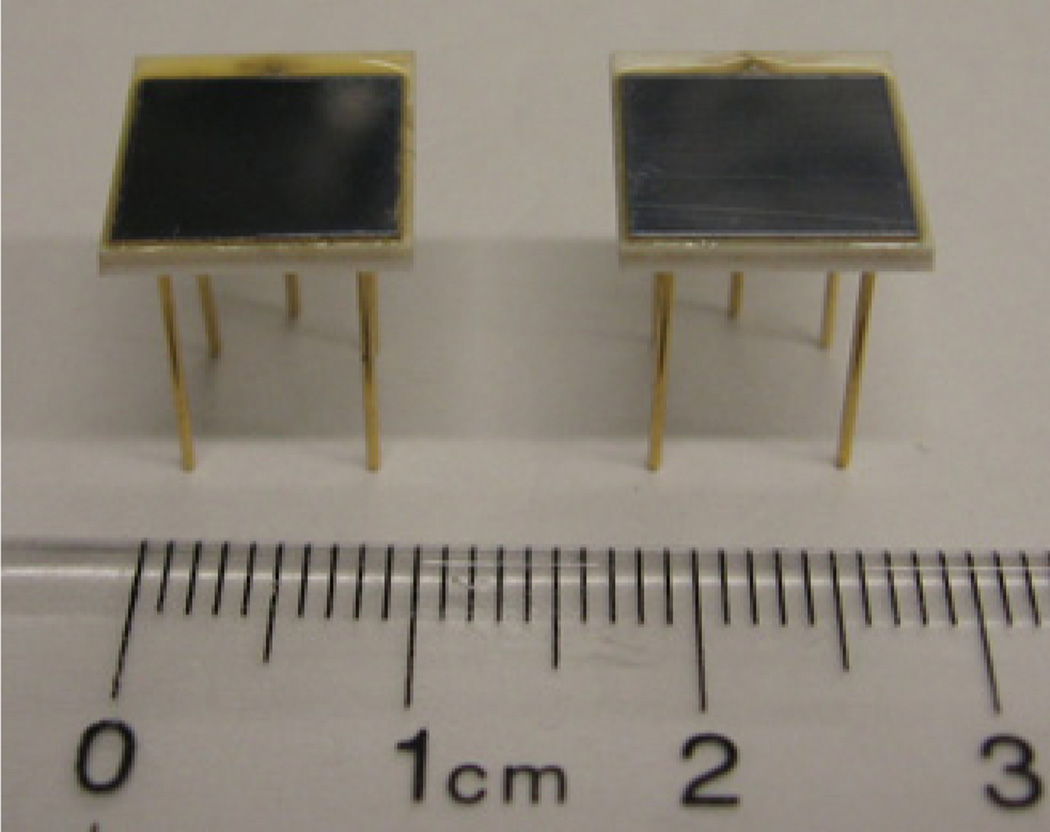
The simulations were verified experimentally using ceramic-mounted PSAPDs (figure 11) since the ceramic package has pins allowing easier mounting on printed circuit boards for testing. The RENA-3 ASIC and the AD9243 analog-to-digital-converter (ADC) were used for readout. Each 1 cm2 PSAPD was coupled using optical grease to an 8 × 8 array of 1 mm3 LSO scintillation crystals to create a ceramic-mounted LSO-PSAPD detector.
Figure 11.
Ceramic-mounted PSAPDs.
For energy and flood measurements, the detector was flood irradiated with a 4 µCi Na-22 point source placed 1.5 cm above the LSO array with a face-on configuration. Due to gain variations across the PSAPD and across the scintillation crystal array, it was necessary to compensate for per-crystal gain differences. First, a separate energy spectrum for each crystal element in the 8 × 8 array was plotted. Then, each spectrum was scaled so that their 511 keV photo-peaks lined up with each other and inter-channel offset from the electronics was removed. The scaled spectrum for each crystal was then combined to produce a single overall gain-corrected energy spectrum for that array.
In addition to windowing the flood histograms on 440 to 590 keV events (which represents events in the 511 keV photo-peak), low energy windows (with lower energy threshold above 200 keV) were also used. This was done to evaluate the system’s ability to localize the coordinates of individual interactions outside the 511 keV photo-peak created by Compton scatter or photoelectric absorption of lower energy photons. Including these low energy events may be useful in improving system sensitivity, as will be described in section 5.7. The events are windowed using the gain corrected energy spectrum from the low-gain common.
For the pair coincidence time resolution measurements, two detectors were configured edge-on, pointing toward each other with 5.2 cm separation. A 250 um diameter 10uCi Na-22 source was placed between the two detectors so that it irradiated the detectors edge-on. The coincidence time resolution was corrected for amplitude walk, correlated noise and crystal location using list-mode event-based post-processing (Reynolds et al 2010).
For the single photon count rate measurements, two ceramic-mounted LSO-PSAPD detectors were irradiated edge-on with a 10 µCi Na-22 source, with one detector in the front (labeled ‘Detector #1’) and one detector in the back (labeled ‘Detector #2’). The edge of the LSO crystal array in the front was 3.6 cm away from the source and the edge of the LSO crystal array in the back was 5.9 cm away from the source. Data were acquired for a period of time (ranging from 6 to 7 min) and the number of energy depositions detected was recorded. From that, the number of detected single photon events per second was calculated. For the multiplexed case, detectors 1 and 2 were multiplexed together.
3.5. Experimental setup with dual-PSAPD modules
The performance was further studied using the dual-PSAPD modules that will be used in the final system, which have flex-mounted PSAPDs (figure 4). This experiment used lutetium yttrium orthosilicate (LYSO) scintillation crystals, which have similar characteristics to LSO. Nuclear instrument modules (NIM) were used for data acquisition since mechanical structures were not available to connect the flex-mounted PSAPDs to the RENA-3 in a easily removable manner that would be convenient for testing. Different experimental setups were used for face-on and edge-on measurements due to the availability of mechanical structures for the configurations.
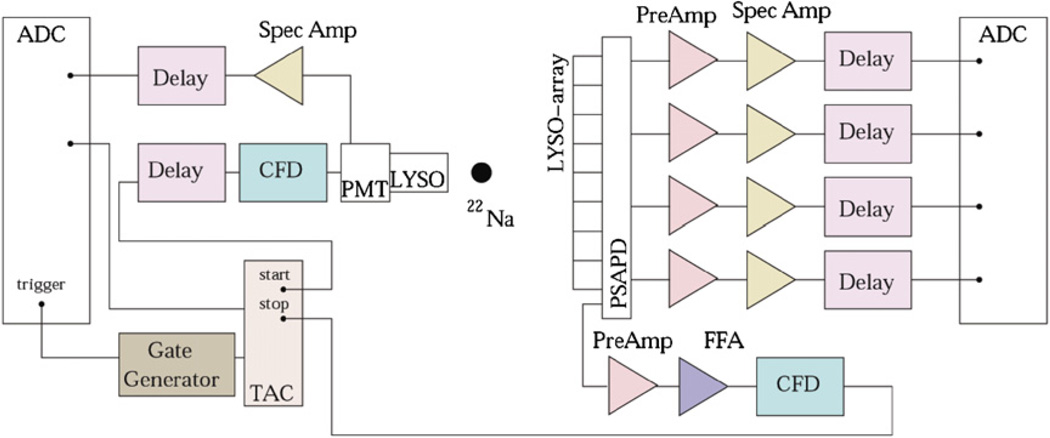
The experimental setup used the dual-PSAPD module in a face-on arrangement, as shown in figure 12. All five PSAPD outputs were amplified by a charge-sensitive CREMAT CR-110 preamplifier. Shaping was done using ORTEC 855 Spectroscopy amplifiers, with a shaping time of 500 ns. A National Instruments PCI-based ADC (PCI-6110) was used to digitize the signals from the PSAPD.
Figure 12.
Schematic of experimental setup for face-on measurements. Coincidence is between a dual-PSAPD module and a LYSO array coupled to a PMT. The space between the edges of the LYSO arrays was 3 cm.
To obtain coincident timing information, a 1 × 1 × 1mm3 LYSO block coupled to a PMT was used in conjunction with the dual-PSAPD module, as shown in figure 12. The PMT’s dynode output was amplified and digitized. The anode signal was fed into an ORTEC 935 CFD and acted as a start for an ORTEC 567 time to amplitude (TAC) converter. The TAC’s stop was generated by the PSAPD’s common output which was first shaped using an ORTEC 579 fast filter amplifier (FFA) in conjunction with a CFD. A CFD delay of 48 ns was used. The TAC signal acted as a trigger for the data acquisition, written in LabView. ORTEC 427 delay amplifiers were used where needed to ensure digitizing occurred at maximal amplitude.
Using this experimental setup, ten different scintillation crystal arrays coupled to the same PSAPD were analyzed for the un-multiplexed case. Four different scintillation crystals coupled to four different PSAPDs were studied for the multiplexed case. The average and standard deviation of the results are reported for each case.
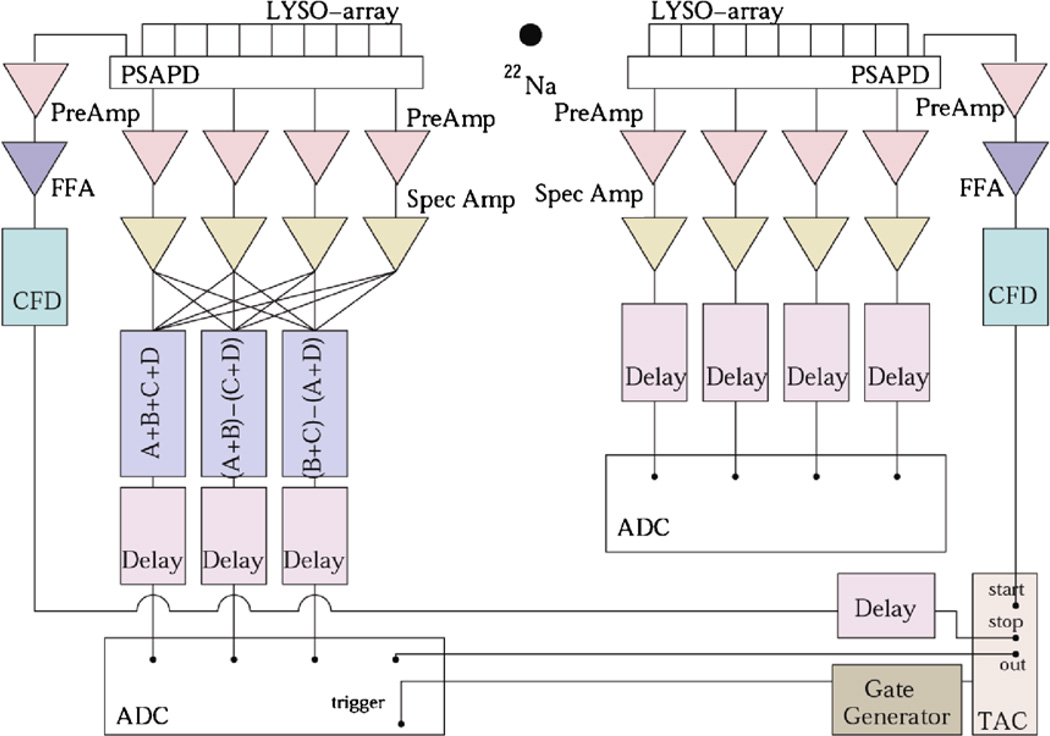
An experiment with the dual-PSAPD modules in an edge-on configuration was also performed to produce an image of the backprojected lines of response (LORs) for a 250 micrometer point source between the modules. For this measurement, only spatial channels could be digitized since only eight ADC channels were available. For one of the modules, an analog summing was performed using ORTEC 533 sum and invert modules. Thus, Anger Logic was performed with the analog signals for one of the modules. It was verified that this analog summing did not influence the signal integrity. The setup is schematically depicted in figure 13. The PSAPDs were used as both the start and stop for the TAC module.
Figure 13.
Schematic of experimental setup for ‘edge-on’ measurements. Coincidence is between two dual-PSAPD modules. The distance between the edge of the LYSO arrays was 6 cm.
4. Results
The SNR, energy resolution, time resolution, crystal identification and sensitivity of the architectures were compared using simulation and experiment. All error bars in the results were estimated by determining the statistical error in the measurement and using error propagation formulas; systematic error was not accounted for.
4.1. SNR simulation
As shown in table 2, SPICE simulations showed an almost negligible 1.9 ± 1.3% degradation in SNR for the spatial channels. No significant SNR difference was observed for the low and high gain common signals. SNR of 16.2 for the low gain common was expected since the simulation assumed an energy resolution of 14.5% FWHM (6.17% sigma) for the low gain common and 1/0.0617 = 16.2.
Table 2.
SNR from SPICE simulations (signal is generated from the energy deposited by a 511 keV photon).
| SNR | ||
|---|---|---|
| Channel | No multiplexing | Multiplexing |
| Low gain common | 16.2 ± 0.1 | 16.2 ± 0.1 |
| High gain common | 16.3 ± 0.1 | 16.3 ± 0.1 |
| Spatial channel | 10.5 ± 0.1 | 10.3 ± 0.1 |
4.2. Flood histogram simulation
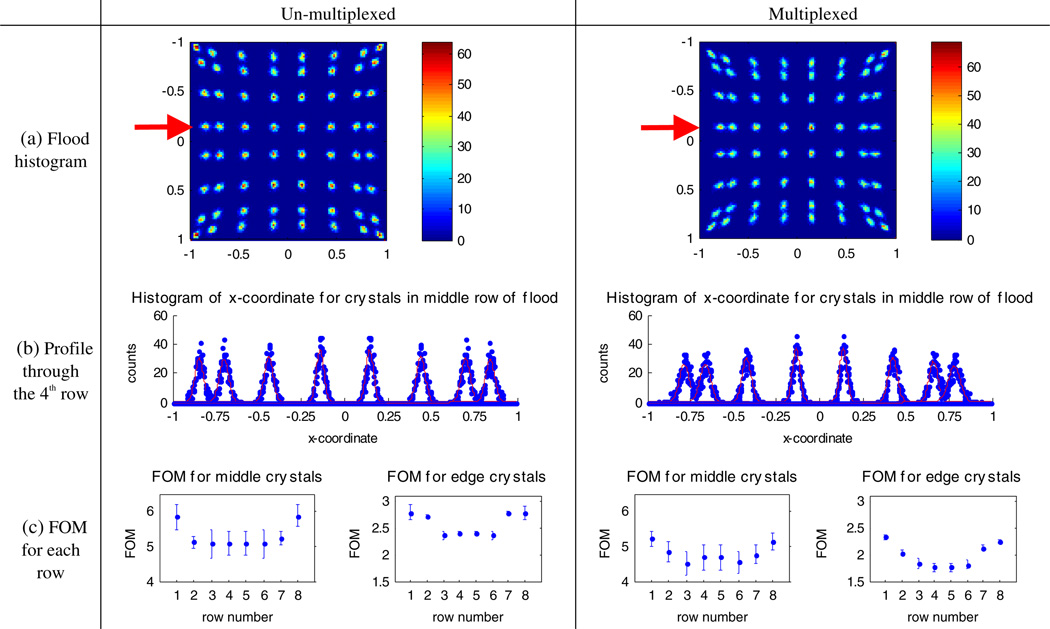
The simulated flood histograms and the computed FoMs are shown in figure 14. As we will explain in section 5, it is also useful to separate the FoM into its two components—the distance between the peaks and the width of the peaks in the flood histogram—to understand why the FoM degrades. Figure 15 shows these two components for the simulated flood histograms for the middle crystals. With multiplexing, the distance decreases and the width increases.
Figure 14.
Simulation results, assuming face-on irradiation of 8 × 8 arrays of 1 mm3 LSO crystals coupled to the PSAPDs. (a) Flood histograms, (b) profile through the fourth row of the flood, (c) figure of merit (FOM) for each row of the flood.
Figure 15.

Simulated data: average distance between peaks and average width (FWHM) of the middle peaks for each row in the flood histogram in figure 14, comparing the un-multiplexed and multiplexed results. The values for the distance and width are relative to the grid used for the flood histogram which has a maximum range spanning from −1 to 1.
4.3. Experimental results with ceramic-mounted PSAPDs
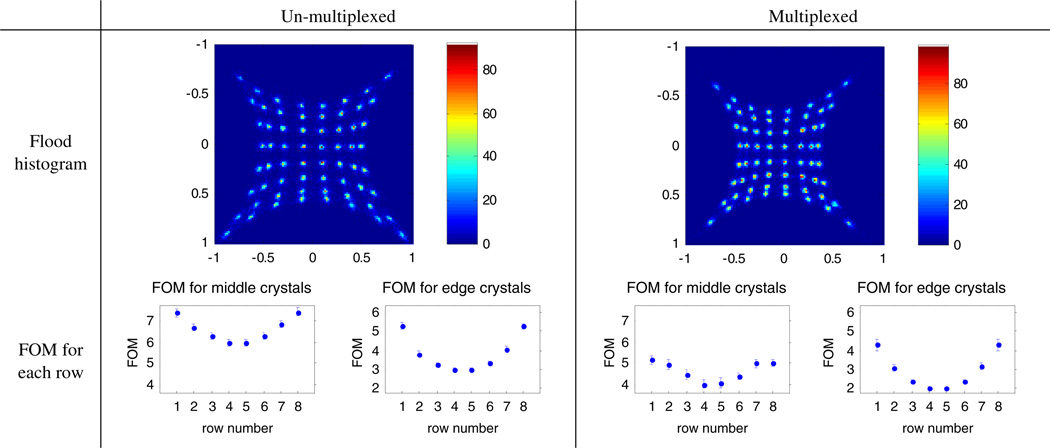
The overall energy spectrum for the data obtained from the common channel is shown in figure 16. The data have been compensated for per-crystal gain differences as explained in section 3.4. The overall energy resolution for the face-on flood irradiated ceramic-mounted LSO-PSAPD detector is 14.6% ± 0.8% FWHM for the un-multiplexed case and 14.4% ± 0.8% FWHM for the multiplexed case.
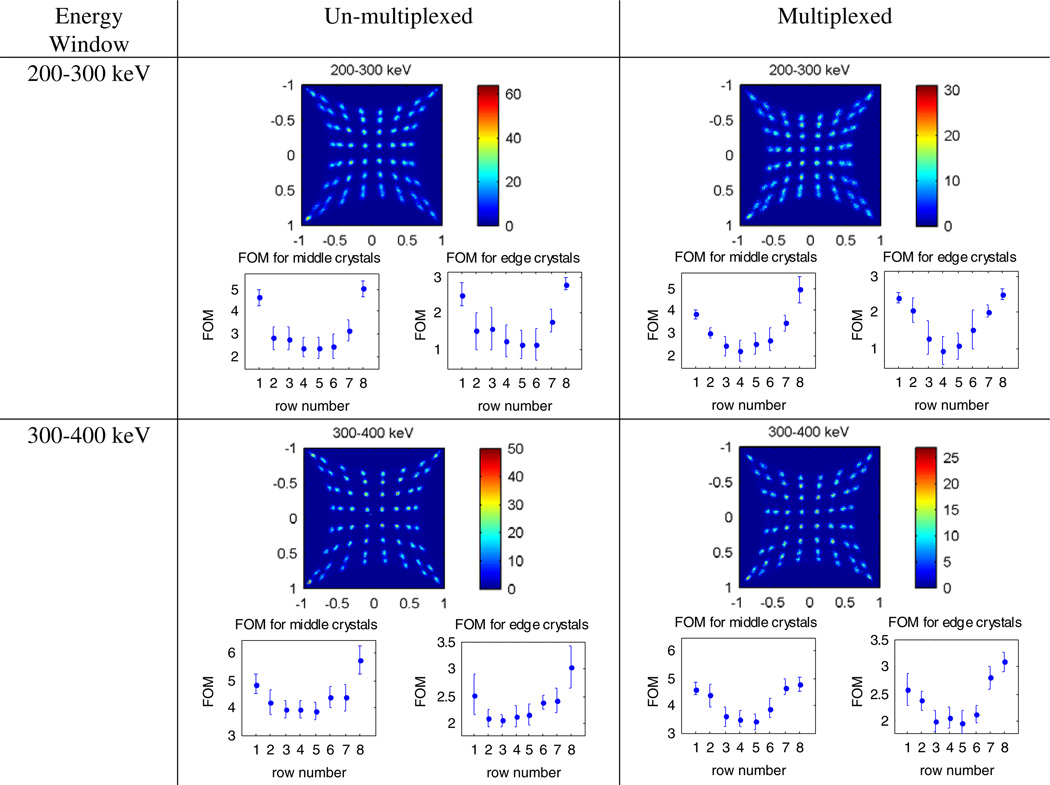
The flood histograms, profiles and FoM for the flood irradiated detectors for the 511 keV photo-peak are shown in figure 17. Figure 18 shows the distance between the peaks and the average width of the peaks for each row in the flood histogram. Flood histograms were created for two energy ranges outside the 511 keV photo-peak: 200–300 keV and 300–400 keV, shown in figure 19.
Figure 17.
Experimental results for 8 × 8 arrays of 1 mm3 LSO crystals coupled to the ceramic-mounted PSAPDs read out by the RENA-3 ASIC for events in the photo-peak (i.e. between 440 and 590 keV), with face-on irradiation. (a) Flood histograms. (b) Profile through the fourth row of the flood. The total acquired number of counts that hit the PSAPD of interest was less for the multiplexed case, so those peaks are lower. (c) Figure of merit (FOM) for each row of the flood. For all figures, the overall energy spectra from figure 16 was used to gate for events in the photo-peak.
Figure 18.

Ceramic-mounted LSO-PSAPD detector experimental data: average distance between peaks and average width (FWHM) of the middle peaks for each row in the flood histogram. The values for the distance and width are relative to the grid used for the flood histogram which has a maximum range spanning from − 1 to 1.
Figure 19.
Flood histograms for ceramic-mounted LSO-PSAPD detectors read out with RENA-3 and FoM with and without multiplexing for events in two energy windows outside the photo-peak.
The coincidence time resolution, measured in an edge-on configuration, was 7.3 ± 0.2 ns paired for the un-multiplexed case and 7.3 ± 0.2 ns paired for the multiplexed case, as shown in figure 20.
Figure 20.
Coincidence time resolution for events in the photo-peak (i.e. events with energy ~440–590 keV) using the RENA-3 ASIC (leading edge discriminator). (a) Un-multiplexed. (b) Multiplexed.
The coincidence time resolution for coincidence between an interaction in one detector with energy outside the 511 keV photo-peak (200–300 keV and 300–400 keV) with an interaction in the other detector with energy within the 511 keV photo-peak is shown in table 3.
Table 3.
Coincidence time resolution for interaction between event in an energy window outside the photo-peak with an event in an energy window inside the photo-peak
| Energy window outside the photo-peak | ||
|---|---|---|
| 200–300 keV | 300–400 keV | |
| Un-multiplexed | 13.7 ± 0.1 ns paired | 8.8 ± 0.1 ns paired |
| Multiplexed | 18.9 ± 0.1 ns paired | 10.5 ± 0.1 ns paired |
The count rate, defined as the number of events per second recorded by each detector in the edge-on arrangement, is shown in table 4. Detector #1 was closer to the source than Detector #2 so it has a larger number of events per second.
Table 4.
Count rate (number of events per second in each detector).
| All events (above noise floor) |
Photo-peak events (~440–590 keV) |
|||
|---|---|---|---|---|
| Detector 1 | Detector 2 | Detector 1 | Detector 2 | |
| Un-multiplexed | 282.2 ± 0.8 | 77.4 ± 0.4 | 70.2 ± 0.4 | 14.7 ± 0.2 |
| Multiplexed | 286.3 ± 0.9 | 75.2 ± 0.5 | 72.6 ± 0.4 | 14.8 ± 0.2 |
4.4. Experimental results with dual-PSAPD modules
The face-on measurement results using the dual-PSAPD modules with flex-mounted detectors listed in table 5 show no significant difference in energy and time resolution, similar to the case for the ceramic mounted LSO-PSAPD detectors.
Table 5.
Energy and time resolution for dual-PSAPD modules.
| Energy resolution (in % at FWHM) |
Time resolution (at FWHM) |
|
|---|---|---|
| Un-multiplexed | 13.02 ± 0.77 | 2.34 ± 0.04 (paired) |
| Multiplexed | 12.91 ± 0.22 | 2.33 ± 0.36 (paired) |
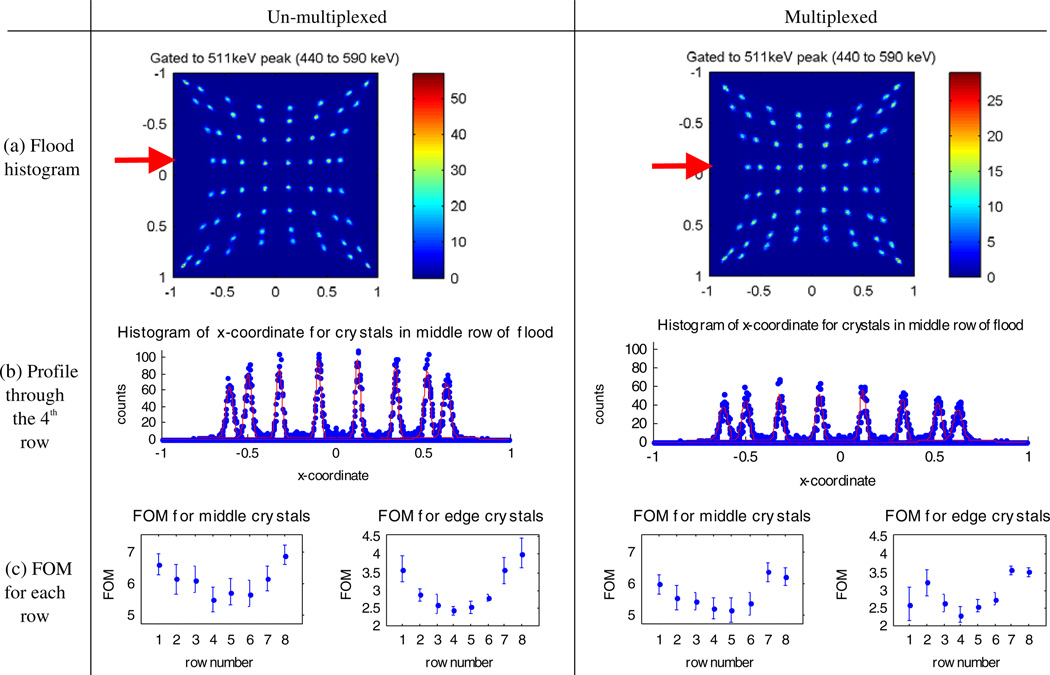
Figure 21 shows the flood histograms and figure of merit (FoM) for both multiplexed and un-multiplexed cases.
Figure 21.
Flood histograms and FoM for dual-PSAPD modules with flex-mounted detectors read out with NIM electronics with face-on irradiation. Gated for events within three standard deviations of the 511 keV photo-peak.
Figure 22 shows the distance between the peaks and the average width of the peaks for each row in the flood histograms. As will be explained in section 5, it is helpful to study how shaping time affects the results, so in figures 22 and 23 results for a shaping time of 100 ns are shown.
Figure 22.

Dual-PSAPD module experimental data: average distance between peaks and average width (FWHM) of the middle peaks for each row in the flood histogram. As explained in section 5, in addition to the un-multiplexed and multiplexed cases, there is the additional case of multiplexed with a shorter 100 ns shaping time (versus 500 ns in the regular multiplexed case). The values for the distance and width are relative to the grid used for the flood histogram which has a maximum range spanning from −1 to 1.
Figure 23.
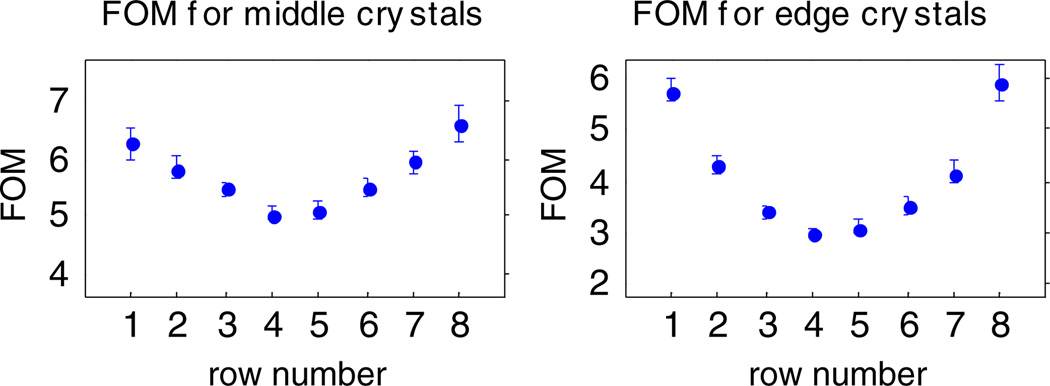
FoM for multiplexed flex-mounted PSAPDs with a shorter 100 ns shaping time (versus 500 ns in figure 21) under face-on irradiation. Gated for events within three standard deviations of the 511 keV photo-peak.
Figure 24 shows the backprojected lines of response (LORs) between the front PSAPDs on two multiplexed modules for a 250 micrometer point source located in the center between the modules. All LORs go through the source. The multiplexed detectors can precisely reconstruct a point source. Further characterization of the dual-PSAPD modules is in Vandenbroucke et al (2010).
Figure 24.
Backprojected lines of response (LORs) for two flex-mounted modules in coincidence in an edge-on configuration with a point source in the center.
5. Discussion
5.1. Benefits of multiplexing
By multiplexing two PSAPDs together, the number of readout channels was reduced, decreasing the system cost and complexity. Originally, with 2304 dual-PSAPD modules and 12 signals per module (4 spatial + 2 common + 4 spatial + 2 common; see section 2.2), 27 648 readout channels would be needed. With the multiplexed design, which has eight signals per module (4 spatial + 2 common + 2 common), 18 432 channels are needed, a 33% reduction. This is a significant improvement, although a challenging system integration task is still at hand.
Multiplexing also reduces the number of signal routing traces from the detector to the front-end electronics. This advantage is particularly relevant for high resolution PET with DOI where there are many tightly packed detectors and a large distance between the detectors and front-end electronics. Since the common is split into two readout channels (for the dynamic range scaling, see section 2.2) close to the ASIC, only one long common routing trace is needed per PSAPD. Therefore, without multiplexing, there are 2304 modules and 10 routing traces per module (4 spatial + 1 common + 4 spatial + 1 common), resulting in 23 040 traces. With multiplexing, there are six routing traces per module (4 spatial + 1 common + 1 common) so there are 13 824 traces, a 40% reduction.
5.2. SNR
The simulated SNR for the low gain and high gain commons are unchanged with multiplexing, predicting that the energy and time resolution of the system will not be affected by multiplexing since the energy and time is measured from the non-multiplexed commons. The SNR of the spatial channels decreased by 1.9 ± 1.3% (see table 2), predicting that the spatial resolution and the flood histograms should degrade only slightly.
5.3. Energy and time resolution
The experimental results for energy and time resolution for events in the 511 keV photo-peak with and without multiplexing are the same within statistical errors (see figures 16 and 20 and table 5), for both the ceramic-mounted detectors and the flex-mounted detectors. This is expected since the common was not multiplexed. This was also predicted by the SPICE simulation which showed that the SNR of the low gain common was unchanged with multiplexing.
The time resolution assuming a perfect timing discriminator without time walk effects is (Spieler 1982):
| (4) |
where Vno is the RMS noise voltage at the output of the preamplifier. It was shown in section 4 that Vno does not change significantly for both architectures. dVo/dt is the slope of the preamplifier output voltage, and since the common terminal is not multiplexed, there is very little change in this slope.
There are some differences in the values reported for the ceramic-mounted detector experiment (figure 16) and the flex-mounted detector experiment (table 5) since they used different readout electronics and scintillation crystals. In the flex-mounted setup, CFDs instead of the leading edge discriminators were used, the integration and differentiation times were able to tuned with more flexibility, and dynamic range scaling was not necessary so the SNR was higher. A secondary effect is that LYSO has slightly better energy and time resolution (Vandenbroucke and Levin 2008). However, the important point is that the conclusion from the two independent experimental setups is the same: multiplexing does not degrade energy or time resolution. Work on reading out the flex-mounted detectors with the RENA-3 is ongoing.
5.4. Flood histograms
The flood histogram FoM (figures 14, 17 and 21) show that there is a small degradation due to multiplexing which is tolerable because individual crystals are still well separated. The FoM is a useful metric for quantitatively comparing flood histograms as it captures the degradation in the flood histogram due to multiplexing while avoiding issues with binning and background that are inherent to using the commonly used peak-to-valley ratio metric.
It is also useful to separate the FoM into its two components—the distance between the peaks and the width of the peaks in the flood histogram—to understand why the FoM degrades. In both the simulated and experimental results (figures 15, 18 and 22), the width increases and the distance between peaks decreases, so both factors contributed to the degradation in FoM.
The increase in the width of the peaks was due to the increase in PSAPD leakage current noise and thermal noise. Also, since the effective detector capacitance as seen from the spatial channels doubled, the input-referred noise of the preamplifiers increased.
The decrease in the distance between the peaks occurs because connecting the spatial channels together connected the sheet resistors of the two PSAPDs in parallel, effectively halving the sheet resistance. Since the preamplifiers have finite input impedance, reducing the sheet resistance increases the amount of charge sharing between the four corners and thus decreases their dynamic range. This results in a compression of the flood histogram.
Table 6 summarizes the percent degradation in the flood histogram parameters from the simulation and the two experiments. The degradation in the width is higher than the degradation in the SNR simulation of 1.9 ± 1.3%. This is because the SNR simulation ignores the variation in the location of the light created in the different scintillation crystal elements of the array. The decrease in the distance between peaks is not captured by the SNR, so the simulated flood histogram is useful for understanding the crystal identification ability.
Table 6.
Average percent degradation in flood histogram parameters with multiplexing. The ceramic and flex results used completely different experimental setups, so the absolute numbers cannot be compared (see the text).
| Simulation | Ceramic | Flex | |
|---|---|---|---|
| Middle crystals | |||
| FoM | 9.4 ± 1.0 | 6.9 ± 1.0 | 12.7 ± 0.8 |
| Distance between peaks | 5.8 ± 0.6 | 2.1 ± 0.6 | 7.7 ± 0.5 |
| Width of peaks | 4.0 ± 1.0 | 5.5 ± 0.9 | 7.1 ± 0.7 |
| Edge crystals | |||
| FoM | 23.1 ± 0.4 | 4.1 ± 1.5 | 10.4 ± 1.1 |
| Distance between peaks | 12.7 ± 0.1 | 1.9 ± 1.2 | 7.8 ± 0.8 |
| Width of peaks | 13.5 ± 0.7 | 3.2 ± 1.0 | 3.8 ± 0.9 |
The absolute numbers for the percent degradation for the ceramic-mounted experiment and the flex-mounted experiment cannot be compared since they used completely different experimental setups and readout electronics (RENA-3 for ceramic modules and NIM for flex modules). One difference is in the integration time. The NIM electronics used an integration time constant of 500 ns whereas the RENA-3 used 240 ns. More noise is integrated for longer shaping time, resulting in flood histograms with larger width of peaks. To verify this, the multiplexed flex modules were tested again with shapers with a shorter shaping time of 100 ns (figures 22 and 23). The width of the peaks decreased by 11.4 ± 0.7% for middle crystals (10.6 ± 1.0% for edge crystals) because less noise was integrated. The distance between the peaks only had a minor decrease of 2.8 ± 0.7% for middle crystals (−2.5 ± 1.2% for edge crystals) since reducing the shaping time did not change the sheet resistance of the PSAPD. Since the shorter shaping time decreased the width of the peaks, the FoM improved, as shown in figure 23.
The NIM electronics and the RENA-3 also used different methods to capture the signal on each spatial channel. The NIM electronics used a calibrated delay to line up the peak of the shaped pulse with the ADC trigger, and then sampled and digitized the shaped pulse at the point when the ADC triggered. On the other hand, the RENA-3 used a peak detector to capture the peak of the shaped pulse and digitized the captured peak. Another difference between the experimental setups is the ceramic and flex packages for the PSAPDs may have slightly different properties, such as contact resistance, which could have affected the dynamic range of the spatial channel signals used to create the flood histograms.
The simulation was designed to model the ceramic-mounted detector with RENA-3 readout setup. The discrepancies between the simulation and the ceramic-mounted detector experimental data can be attributed to a number of factors. Estimates were used for parameters such as noise, PSAPD sheet resistance and avalanche gain, preamplifier input capacitance, preamplifier gain and dynamic range, and scintillation crystal light output and quantum efficiency. In reality, these parameters vary from detector to detector by up to 10% due to process variations.
There is less ‘pin-cushion distortion’ in the simulation (figure 14). This caused discrepancies in the percent degradation with multiplexing in the distance between peaks for middle crystals and in all the results for the edge crystals. This may be because the position and size of the contacts on the PSAPD high resistivity sheet may be slightly different from the estimate. The pin-cushion distortion is highly dependent on the value of parameters used for the sheet resistance and capacitance of the PSAPD as well as the input impedance of the preamplifier. In addition, there are secondary effects that are not modeled in simulation, such as the non-uniform gain of the surface of the PSAPD and the saturation of the preamplifier for large signals.
Although the absolute numbers for the simulation and the two experiments cannot be compared, the trend and the conclusion for all three studies is the same: multiplexing degrades the FoM slightly, but all the crystals in the flood histogram can still be clearly identified.
5.5. Effect of proportional noise on flood histogram simulations
Inaccuracies in the modeling of proportional noise for the flood histogram simulation are negligible because the contribution of proportional noise on the variance of the position of interaction recorded in the flood histogram is small. This can be understood by expanding equations (1.1) and (1.2) to include proportional noise (represented by kAlight, where 0 < k < 1) and the noise that is distributed across the PSAPD. Let δden = δA + δB + δC + δD and δnum = δA − δB − δC + δD. Taking the formula for the x-coordinate of the position of interaction as an example and expanding,
| (5) |
Since δden/(1 + k) is much smaller than Alight + Blight + Clight + Dlight (estimated to be less than 2%), the equation for x simplifies to
| (6) |
For interactions in crystal elements that are not near the center of the PSAPD, the magnitude of Alight − Blight + Dlight − Clight is large and δnum/(1 + k) is much smaller. For interactions in crystals near the center of the PSAPD, δA ≈ δB ≈ δC ≈ δD due to symmetry, so δnum = δA − δB − δC + δD ≈ 0. In either case, the equation simplifies to
| (7) |
As shown, the factor (1 + k) cancels out, and therefore, the effect of proportional noise has a minor effect on the flood histogram.
5.6. Count rate
The count rate (table 4) was similar with or without multiplexing of the spatial channels, which was expected since the number of events was measured from the common which was not multiplexed. The small discrepancies between the numbers could be due to experimental error, such as small differences in the manual placement of the source. The number of events per second is larger in PSAPD #1 than in PSAPD #2 because PSAPD #1 is closer to the source.
5.7. Detection of low energy events
System photon sensitivity is improved by including energy depositions outside the 511 keV photo-peak due to the high chance that Compton scattered photons will escape the small (1 mm3) LSO elements. The detectors can localize the 3D coordinates of these individual interactions, provided each interaction is above the electronic noise threshold, which currently is 200 keV. Monte Carlo simulations showed that only about 42% of all events have individual interaction energy depositions above 400 keV whereas about 61% of all events have individual energy depositions above 200 keV (‘all events’ refers to events where the sum of all the individual energy depositions in that event sum to an energy value within the photo-peak window (Gu et al 2010)). Algorithms (Pratx and Levin 2009) can estimate the first interaction location for an event comprising a sequence of multiple interactions.
Figure 19 shows that the crystals are still easily separable for interaction energy depositions from 200 to 400 keV. Hence, these low energy events may be used to possibly improve system sensitivity (Gu et al 2010). However, the raw time resolution degrades (table 3) so we are studying how to best extract time information from multi-interaction photons.
5.8. Limits of multiplexing
What limits the number of detectors that can be multiplexed together in a system? To first order, the gain and SNR of the device are the most limiting effects. Although the noise of the common does not increase, the noise of the spatial channels does.
In addition, inter-module scatter within a group of multiplexed detectors cannot be positioned to the correct module, resulting in a reduction in contrast. Our group studied this and found that multiplexing the two PSAPDs on our dual-PSAPD module results in less than 0.4% reduction in the number of detected events when used in our planned system geometry (Gu et al 2010).
Finally, the signals from multiplexed detectors cannot exceed the count rate performance of the electronics. Multiplexing allows more PSAPDs to be read out by a single RENA-3 chip and also doubles the number of events measured on each spatial channel. However, this should not be a problem in our system since preliminary simulations showed that the predicted maximum count rate per RENA-3 with multiplexing in our planned system geometry should be only 15 kHz whereas the RENA-3 can handle over 80 kHz of events (NOVA R&D 2007).
6. Conclusion
This paper presents an analog signal multiplexing scheme for PSAPDs. It was verified through simulation and two independent experimental setups that the multiplexing scheme did not significantly degrade energy, temporal, spatial or count rate performance. Therefore, this multiplexed front-end architecture is being implemented in the 1 mm3 resolution PET system for breast imaging under development, resulting in a 40% reduction in wire routing density and a 33% reduction in channel count.
The figure of merit proposed is useful for quantifying differences in flood histograms. The results show that it is feasible to read out PSAPD signals with theRENA-3ASICwhen dynamic range scaling is implemented. This design also features a high and low gain common to help mitigate some of the time resolution degradation caused by the leading edge discriminator in the RENA-3, as well as the ability to localize individual interaction energy depositions in multiple crystal elements that sum to within the 511 keV photo-peak to improve overall photon sensitivity.
Acknowledgments
We thank Hao Peng for his help with the Detect 2000 simulation of the scintillation crystal. We thank Richard Farrell of RMD Inc. (Watertown, MA) for his advice on the PSAPD modeling. This work was supported by NIH grants R01CA119056, R33 EB003283 and R01CA119056-S1 (ARRA). FWYL was supported by the Stanford Bio-X Graduate Student Fellowship and the California Breast Cancer Research Program Dissertation Award. AV was supported by the Belgian-American Educational Foundation and the DOD grant BC094158.
References
- Abreu MC, et al. Design and evaluation of the clear-PEM scanner for positron emission mammography. IEEE Trans. Nucl. Sci. 2006;53:71–77. [Google Scholar]
- Dokhale P, et al. Performancemeasurements of a depth-encoding PET detectormodule based on position-sensitive avalanche photodiode read-out. Phys. Med. Biol. 2004;49:4293–4304. doi: 10.1088/0031-9155/49/18/007. [DOI] [PubMed] [Google Scholar]
- Doshi NK, et al. maxPET, a dedicated mammary and axillary region PET imaging system for breast cancer. IEEE Trans. Nucl. Sci. 2001;48:811–815. [Google Scholar]
- Farrell R. PSAPD device characteristics, private communication. 2009 [Google Scholar]
- Freifelder R, Karp JS. Dedicated PET scanners for breast imaging. Phys. Med. Biol. 1997;42:2463–2480. doi: 10.1088/0031-9155/42/12/012. [DOI] [PubMed] [Google Scholar]
- Furuta M, et al. Basic evaluation of a C-shaped breast PET scanner. Nuclear Science Symp. Conf. Record (NSS/MIC), 2009 (IEEE) 2009:2548–2552. [Google Scholar]
- Grazioso R, et al. APD performance in light sharing PET applications. IEEE Trans. Nucl. Sci. 2005;52:1413–1416. [Google Scholar]
- Grazioso R, et al. APD-based PET detector for simultaneous PET/MR imaging. Nucl. Instrum. Methods Phys. Res. A. 2006;569:301–305. [Google Scholar]
- Gu Y, et al. Effects of multiple-interaction photon events in a high resolution PET system that uses 3-D positioning detectors. Med. Phys. 2010;37:5494–5508. doi: 10.1118/1.3483262. [DOI] [PMC free article] [PubMed] [Google Scholar]
- Judenhofer MS, et al. PET/MR images acquired with a compact MR-compatible PET detector in a 7-T Magnet1. Radiology. 2007;244:807–814. doi: 10.1148/radiol.2443061756. [DOI] [PubMed] [Google Scholar]
- Knoll MGF. Radiation Detection and Measurement. 3rd edn. New York: Wiley; 2000. [Google Scholar]
- Lau FWY, et al. Noise analysis of LSO-PSAPD PET detector front-end multiplexing circuits. Nuclear Science Symp. Conf. Record, 2007 (NSS ’07; IEEE) 2007:3212–3219. [Google Scholar]
- Lau FWY, et al. 1 mm3 resolution breast-dedicated PET system. Nuclear Science Symp. Conf. Record, 2008 (NSS ’08; IEEE) 2008:5619–5622. [Google Scholar]
- Levin CS. Design of a high-resolution and high-sensitivity scintillation crystal array for PET with nearly complete light collection. IEEE Trans. Nucl. Sci. 2002;49:2236–2243. [Google Scholar]
- Levin CS, Foudray AMK, Habte F. Impact of high energy resolution detectors on the performance of a PET system dedicated to breast cancer imaging. Phys. Medica. 2006;21(Suppl. 1):28–34. doi: 10.1016/S1120-1797(06)80020-7. [DOI] [PubMed] [Google Scholar]
- Moses WW, et al. Scintillator non-proportionality: present understanding and future challenges. IEEE Trans. Nucl. Sci. 2008;55:1049–1053. [Google Scholar]
- Moszynski M, et al. Timing properties of GSO, LSO and other Ce doped scintillators. Nucl. Instrum. Methods Phys. Res. A. 1996;372:51–58. [Google Scholar]
- NOVA R&D. RENA-3 IC User Specifications. Riverside, CA: NOVA R&D; 2007. [Google Scholar]
- Olcott, et al. Compact readout electronics for position sensitive photomultiplier tubes. IEEE Trans. Nucl. Sci. 2005a;52:21–27. [Google Scholar]
- Olcott PD, et al. Charge multiplexing readout for position sensitive avalanche photodiodes. Nuclear Science Symp. Conf. Record. 2005b:2935–2937. [Google Scholar]
- Olcott PD, Peng H, Levin CS. Solid state photomultiplier (SSPM)-based PET detector with capacitively multiplexed readout and electro-optical coupling for PET/MR. Soc. Nucl. Med. Annu. Meet. Abstracts. 2009;50:354. [Google Scholar]
- Pichler BJ. Lutetium oxyorthosilicate block detector readout by avalanche photodiode arrays for high resolution animal PET. Phys. Med. Biol. 2004;49:4305. doi: 10.1088/0031-9155/49/18/008. [DOI] [PubMed] [Google Scholar]
- Popov V, et al. Analog readout system with charge division type output. Nuclear Science Symp. Conf. Record, 2001 (IEEE) 2001:1937–1940. [Google Scholar]
- Popov V, Majewski S, Welch BL. A novel readout concept for multianode photomultiplier tubes with pad matrix anode layout. Nucl. Instrum. Methods Phys. Res. A. 2006;567:319–322. [Google Scholar]
- Pratx G, Levin CS. Bayesian reconstruction of photon interaction sequences for high-resolution PET detectors. Phys. Med. Biol. 2009;54:5073–5094. doi: 10.1088/0031-9155/54/17/001. [DOI] [PMC free article] [PubMed] [Google Scholar]
- Raylman RR, et al. The positron emission mammography/tomography breast imaging and biopsy system (PEM/PET): design, construction and phantom-based measurements. Phys. Med. Biol. 2008;53:637–653. doi: 10.1088/0031-9155/53/3/009. [DOI] [PubMed] [Google Scholar]
- Reynolds P, et al. Convex optimization of coincidence time resolution for a high resolution PET system. IEEE Trans. Med. Imaging. 2010;99 doi: 10.1109/TMI.2010.2080282. [DOI] [PMC free article] [PubMed] [Google Scholar]
- Shah KS, et al. Position-sensitive avalanche photodiodes for gamma-ray imaging. IEEE Trans. Nucl. Sci. 2002;49:1687–1692. [Google Scholar]
- Shah KS, et al. Position sensitive APDs for small Animal PET imaging. IEEE Trans. Nucl. Sci. 2004;51:91–95. [Google Scholar]
- Shah KS. A Novel Position Sensitive Detector for Nuclear Radiation. Watertown, MA: RMD Inc; 2005. [Google Scholar]
- Shao Y. A new timing model for calculating the intrinsic timing resolution of a scintillator detector. Phys. Med. Biol. 2007;52:1103–1117. doi: 10.1088/0031-9155/52/4/016. [DOI] [PubMed] [Google Scholar]
- Shimazoe K, et al. Multi-channel waveform sampling ASIC for animal PET system. Nuclear Science Symp. Conf. Record, 2006 (IEEE) 2006:2473–2475. [Google Scholar]
- Siegel S, et al. Simple charge division readouts for imaging scintillator arrays using a multi-channel PMT. IEEE Trans. Nucl. Sci. 1996;43:1634–1641. [Google Scholar]
- Spieler H. Fast timing methods for semiconductor detectors. IEEE Trans. Nucl. Sci. 1982;29:1142–1158. [Google Scholar]
- Vandenbroucke A, et al. Performance characterization of a new high resolution PET scintillation detector. Phys. Med. Bio. 2010;55:5895–5911. doi: 10.1088/0031-9155/55/19/018. [DOI] [PMC free article] [PubMed] [Google Scholar]
- Vandenbroucke A, Levin CS. Study of scintillation crystal array parameters for an advanced PET scanner dedicated to breast cancer imaging. Nuclear Science Symp. Conf. Record, 2008 (NSS ’08; IEEE) 2008:4914–4919. [Google Scholar]
- Wang GC, et al. Characterization of the LBNL PEM camera. IEEE Trans. Nucl. Sci. 2006;53:1129–1135. [Google Scholar]
- Weinberg IN, et al. Positron emission mammography: high-resolution biochemical breast imaging. Technol. Cancer Res. Treat. 2005;4:55–60. doi: 10.1177/153303460500400108. [DOI] [PubMed] [Google Scholar]
- Wernick MN, Aarsvold JN. Emission Tomography: The Fundamentals of PET and SPECT. New York: Academic; 2004. [Google Scholar]
- Wu Y, et al. PET characteristics of a dedicated breast PET/CT scanner prototype. Phys. Med. Biol. 2009;54:4273–4287. doi: 10.1088/0031-9155/54/13/020. [DOI] [PMC free article] [PubMed] [Google Scholar]
- Zhang J, et al. Performance characterization of a novel thin position-sensitive avalanche photodiode for 1 mm resolution positron emission tomography. IEEE Trans. Nucl. Sci. 2007;54:415–421. [Google Scholar]
- Zhang N, et al. RF transformer coupled multiplexing circuits for APD PET detectors. IEEE Trans. Nucl. Sci. 2006;53:2570–2577. [Google Scholar]


