Abstract
Tumor cells often exhibit an altered metabolic phenotype. However, it is unclear as to when this switch takes place in ovarian cancer, and the potential for these changes to serve as therapeutic targets in clinical prevention and intervention trials. We used our recently developed and characterized mouse ovarian surface epithelial (MOSE) cancer progression model to study metabolic changes in distinct disease stages. As ovarian cancer progresses, complete oxidation of glucose and fatty acids were significantly decreased, concurrent with increases in lactate excretion and 3H-deoxyglucose uptake by the late-stage cancer cells, shifting the cells towards a more glycolytic phenotype. These changes were accompanied by decreases in TCA flux but an increase in citrate synthase activity, providing substrates for de novo fatty acid and cholesterol synthesis. Also, uncoupled maximal respiration rates in mitochondria decreased as cancer progressed. Treatment of the MOSE cells with 1.5μM sphingosine, a bioactive sphingolipid metabolite, decreased citrate synthase activity, increased TCA flux, decreased cholesterol synthesis and glycolysis. Together, our data confirm metabolic changes during ovarian cancer progression, indicate a stage specificity of these changes, and suggest that multiple events in cellular metabolism are targeted by exogenous sphingosine which may be critical for future prevention trials.
Keywords: metabolism, cancer progression, sphingosine, substrate flux, citrate synthase, cholesterol
INTRODUCTION
Ovarian cancer is the leading cause of gynecological cancer deaths and the fifth leading cause of cancer deaths in women. While the origins of ovarian cancer are still debated, most ovarian cancers are thought to originate in the layer of epithelial cells surrounding the ovary or the fimbriae of the fallopian tubes. While early diagnosis leads to a 92% rate of survival [1], the cancer is most commonly diagnosed when has progressed to stage III or IV, drastically reducing the chance of survival. Understanding the etiology of ovarian cancer and identifying early events in ovarian cancer for diagnostic and prevention purposes is critical to increase the survival rates of women afflicted with this disease.1
The observation that cancer cells have an altered metabolic phenotype, allowing them to adapt to and survive dynamic microenvironmental conditions, was first made by Otto Warburg and has been subsequently been labeled the “Warburg Effect” [2, 3]. Warburg observed a higher uptake of glucose and elevated lactate production and secretion, and concluded that cancer cells primarily use aerobic glycolysis rather than oxidative phosphorylation as the primary source for ATP synthesis, due to impaired mitochondria. Although this glycolytic shift takes place under normoxic conditions, anaerobic metabolism is also critical for tumor development where the hypoxic core of growing tumors limits access to oxygen. To avoid acid-induced apoptosis, monocarboxylate transporters must export excess lactic acid [4, 5]. The resulting acidic microenvironment generated by the secreted lactate, carbon dioxide production, bicarbonate depletion and other mechanisms has been shown to promote progression and metastasis [6, 7].
Since Warburg’s first communication of the glycolytic nature of cancer cell metabolism, there has been a debate as to whether this hypothesis encompasses all changes pertaining to cancer cell metabolism. It is now clear that mitochondrial dysfunction is not apparent in all cancer cells [8], and that the aberrant metabolic phenotype is the consequence of mutations or epigenetic silencing modulating the expression of metabolic enzymes or their regulators such as p53, MYC, AMP-activated kinase (AMPK) or Hypoxia-inducible factor 1 alpha (HIF1 α)[9] rather than their cause. The glycolytic shift now is understood as a survival mechanism to produce the macromolecules and reducing equivalents required to meet the cancer cells need of proteins, nucleic acids and lipids to support rapid cell growth. This confers a distinct growth advantage even in normoxic conditions with functional mitochondria [10]. Since these glycolytic cells mostly have a more aggressive and metastatic phenotype [11], it has been suggested that aerobic glycolysis is a hallmark for invasive cancers [12]. Therefore, chemopreventive and chemotherapeutic strategies that modify these metabolic pathways could successfully remove the cancer cells’ growth advantage and prevent cancer growth.
Sphingolipids are a class of structurally diverse bioactive lipids involved in a variety of cellular processes including the regulation of growth, apoptosis, autophagy, motility and many more in a metabolite-specific manner [13, 14]. Sphingolipid metabolites are also involved in cellular metabolism, inhibiting (sphingosine, So) or activating (sphingosine-1-posphate, S1P) glucose uptake, inhibiting (So) or activating (S1P) insulin signaling pathways and mediating AKT (protein kinase B) inhibition (So) or activation (S1P). The endogenous sphingolipid metabolites S1P and ceramide have been implicated in reduced pancreatic ß-cell function, insulin resistance, atherosclerotic plaque formation, and other factors associated with obesity and metabolic syndrome (see recent comprehensive review [15]). In contrast, our previous studies have shown that the administration of complex sphingolipids via the diet suppressed carcinogen-induced [16-19], mutant Adenomatous Polyposis Coli-mediated [20, 21] or inflammation-driven colon cancer [22], and suppressed breast xenograft progression [23] in mice without any apparent side effects. The sphingolipid bases that are generated from the dietary complex sphingolipids are likely the effective metabolites in the observed suppression of tumor growth and progression [20, 24]. The effects of exogenous sphingolipid metabolites on the altered metabolism in ovarian cancer cells and their impact on tumor growth and progression are not known.
We have recently developed and characterized a mouse ovarian surface epithelial (MOSE) cell model of progressive ovarian cancer [25, 26] to identify and delineate events involved in ovarian cancer progression. Serial passaging of primary MOSE cells induced spontaneous immortalization and transformation and allowed for the capturing of genetically and phenotypically distinct early (benign), intermediate and late (highly aggressive and invasive) stages of ovarian cancer. This model is unique in its ability to compare syngeneic stages of cancer progression, a model that does not exist for the human disease. As cells progress, they increase their growth rate, acquire the ability to grow as spheroids, invade collagen and form tumors in vivo [25]. The progression of MOSE cells is accompanied by changes in their gene expression levels and a successive dysregulation of their cellular architecture also reported in the human disease [26]. In the present studies, this ovarian cancer model was used to determine when during cancer progression metabolic changes are taking place and identify potential targets for exogenous So in the prevention of ovarian cancer. We investigated shifts in cellular metabolism and substrate utilization during ovarian cancer cells progression, determined changes in mitochondrial function, and investigated how exogenous So affects the observed changes. Together, our results suggest that alterations in the metabolic phenotype of the progressive MOSE cells are targets for a cancer prevention regimen with exogenous So.
METHODS AND MATERIALS
Cell Culture
MOSE cells were cultured in DMEM (Sigma) supplemented with 4% FBS (Atlanta Biologicals) and 100ug/ml each of penicillin and streptomycin (Gibco). Classification into early-benign (MOSE-E), intermediate (MOSE-I), and late–aggressive (MOSE-L) phenotypes was established as previously described [25]. So-treated cells were cultured in medium containing 1.5 μmol/L So (Avanti Lipids) as BSA complex (60 μM fatty acid-free fraction V, Calbiochem) for at least 3 passages to mimic long-term exposure to diet-derived sphingolipid metabolites. This treatment regimen has been shown to be necessary to induce significant changes in gene and protein expression level and cytoskeleton organization (data not shown). This concentration was not toxic for any cell line. Cells were cultured at 37°C in a humidified incubator with 5% CO2.
Real-time PCR (qPCR)
Cells were seeded in 100mm culture dishes and harvested 24 hours later. Total RNA was extracted using the RNeasy Mini Kit (Qiagen). cDNA synthesis was performed on 500ng of RNA using the ImProm-II Reverse Transcription System (Promega). qPCR was performed using 50ng of cDNA with SensiMix Plus SYBR Mastermix (Quantace) in the ABI 7900HT (Applied Biosystems) with the following parameters: 42 cycles at 95°C for 10 minutes, 95°C for 15 seconds, 58°C for 30 seconds and 72°C for 15 seconds, followed by a dissociation curve segment. Data was quantified using the ΔΔCT method and expressed relative to RPL19 as the housekeeping gene [26]. Primer pairs were designed with the Beacon Design software and were as followed: pyruvate dehydrogenase (PDHb) Fwd: CAT TCG GCA GCT AGT AGA G; PDHb Rev: CTT CAC GAA CTG TCA ACT G; pyruvate dehydrogenase kinase 1 (PDK1) Fwd: CTG GGC GAG GAG GAT CTG ACT G; PDK1 Rev: ACA GCA CGG GAC GTT TCA ACA C; ribosomal protein L19 (RPL19) Fwd: GCA AGC CTG TGA CTG TCC ATT CC; RPL19 Rev: GCA TTG GCA GTA CCC TTC CTC TTC. Data expressed are the mean of two independent experiments performed in duplicate with three biological replicates. Data are presented as Mean ± SEM.
Western Blotting
Cells were treated as indicated, harvested by scraping into Ripa lysis buffer [26], supplemented with Complete Mini Protease Inhibitor Cocktail (Roche), homogenized with a 22-gauge needle, and centrifuged at 15,000g for 15 min. Equal amounts of proteins were separated using 8g/100g or 12g/100g gels, transferred to PVDF membrane (Bio-Rad), and blocked with blocking buffer (Rockland). Blots were probed with primary antibodies against FASN, p-AKT, pyruvate dehydrogenase kinase 1 (PDK1) (Cell Signaling) or -Tubulin (Abcam), followed by incubation with the appropriate secondary antibodies. Proteins were visualized and quantitated using the Odyssey Infrared Imaging System (Licor). Data presented are the mean infrared units ± SEM from at least two independent experiments performed on six biological replicates (FASN and PDK1), normalized to –tubulin.
Glucose and Fatty Acid Oxidation
MOSE cells were seeded at 2.5 × 10⁵ cells/ well in 6-well cell culture plates, incubated for 3 h, and washed with PBS. Following 2 h of incubation in serum-free medium, glucose and fatty acid oxidation were assessed via co-incubation with U-14C glucose and 3H-palmitic acid. Glucose oxidation was measured via 14CO2 production as previously described [27]. Incorporation of 14CO2 derived from U-14C glucose into NaOH was measured using a LS 6500 scintillation counter (Beckman Coulter). Concomitantly, fatty acid oxidation was assessed by measuring 3H2O from 3H-palmitate (Perkin Elmer) as previously described [28]. Data presented as the mean from two independent experiments performed in replicates of six, corrected for protein content. Data are presented as mean ± SEM.
Lactate Assay
MOSE cells were seeded at a density of 2.5 × 10⁵ cells/well in 6-well cell culture plates. After 3 h, cells were washed with PBS and incubated in phenol red-free, serum-free DMEM (Gibco). The medium was collected after 8 h and assayed for lactate concentration using a colorimetric kit according to the manufacturer’s instructions (BRSC, University of Buffalo). Data presented are the mean from three independent experiments performed in replicates of six biological replicates, corrected for cell number. Data are presented as mean ± SEM.
Glucose Uptake
MOSE cells were seeded at 2.5 × 10⁵ cells/well in 6-well cell culture plates. After 3 h, cells were washed with PBS and incubated in serum-free medium for 2 h. Glucose uptake was assessed by measuring 3H-2-Deoxy-glucose as previously described [29]. Data presented are the mean from two independent experiments performed in replicates of six biological replicates, normalized to protein content. Data are presented as mean ± SEM.
Enzyme Activity Assays
MOSE cells were seeded at a density of 5 × 10⁵ cells/well in 6-well cell culture plates. After 3 h, cells were washed with PBS and scraped in 200μl of PK buffer (0.1M di-potassium phosphate). Citrate synthase, and ß-HAD activities were determined spectrophotometrically as previously described [30]. Data presented are the mean from two independent experiments performed in replicates of six biological replicates, corrected for protein content. Data are presented as mean ± SEM.
2-Carbon Labeled Pyruvate Metabolism for Pyruvate Dehydrogenase (PDH) Activity and TCA flux determination
The 14C-label on the number 1 carbon of pyruvate will result in 14C-labeled CO2 produced through the PDH reaction, where [1-14C]-pyruvate indicates PDH activity. The 14C-label on the number 2 carbon of pyruvate will result in 14C-labled acetyl-CoA production as a result of pyruvate oxidation by PDH. As such, any production of 14CO2 using [2-14C]-pyruvate as a substrate is a result of oxidation of acetyl-CoA in the TCA cycle. MOSE cells were seeded at a density of 5 × 10⁵ cells/well in 6-well cell culture plates. After 3 h, cells were washed with PBS and serum-free medium was added for two hours. Oxidation was assessed by measuring 14CO2 production as described above, substituting labeled pyruvate for U-14C glucose. Data presented are the mean from two independent experiments performed in replicates of six, corrected for protein content. Data are presented as mean ± SEM.
De Novo Fatty Acid Synthesis
MOSE cells were seeded at a density of 5 × 10⁵ cells/well in 6-well cell culture plates. After 3 h, cells were washed with PBS and serum-free medium was added for two hours. De Novo fatty acid synthesis was assessed by measuring the quantity of 14C-2-pyruvate (Perkin Elmer) partitioned into fatty acids as previously described [30, 31]. Data presented are the mean from replicates of six, corrected for protein content. Data are presented as mean ± SEM.
Cholesterol Biosynthesis
MOSE cells were grown for 48 h, harvested in 1ml ice-cold PBS, and lipids were extracted with methanol:chloroform (2:1) and centrifuged at 4000 rpm for 5 min. To the supernatant, 1ml of citric acid, 2ml of water and 1ml chloroform were added. After centrifugation, the chloroform layer was transferred to a glass tube and evaporated with nitrogen gas. The cholesterol assay was performed according to manufacturer’s instructions using the Amplex Red Cholesterol Assay Kit (Invitrogen). Data expressed are the mean of four independent experiments performed in duplicate, corrected for cell number and presented as mean ± SEM. An increase in fold change was calculated as treated cells/ control cells. For a fold decrease, the negative inverse of the fold change was calculated; statistical significance was calculated from the original data.
Mitochondrial Respiration
Mitochondrial respiration of MOSE cells was determined using an XF24 extracellular flux analyzer (Seahorse Bioscience) as described by Gerencser et al. with some modifications [32]. Cells were seeded into XF24 V7 cell culture microplates at a density of 35,000 cells per well for MOSE-I and MOSE-L and 50,000 cells per well for MOSE-E and incubated for 48 h in replicates of five. Then the medium was changed and the experiments were conducted in serum-free, bicarbonate-free medium after 1 h incubation. Cells were loaded into the XF24 and experiments consisted of 3-minute mixing, 2-minute wait, and 3-minute measurement cycle. Oxygen consumption was measured under basal conditions in the presence of the mitochondrial inhibitors 0.5 mol/L oligomycin (Calbiochem) or 0.25 mol/L rotenone (Sigma), or in the presence of the mitochondrial uncoupler, 0.3 mol/L carbonylcyanide-p-trifluoromethoxyphenylhydrazone FCCP (Sigma) to assess maximal oxidative capacity. All experiments were performed at 37°C. Oxygen consumption rate (OCR), ATP synthesis rate and extracellular acidification rate (ECAR) were calculated by the oligomycin or FCCP-induced change compared with the basal rates. Data presented are the mean from three independent experiments performed in replicates of five and corrected for protein. Data are presented as Mean ± SEM.
Statistics
Data are presented as mean ± SEM. When comparing more than one cell type, results were analyzed with a one-way ANOVA followed by Tukey’s post ad hoc test. When comparing treated versus non-treated cells of the same cancer stage, data were analyzed using a student’s two-tailed t-test. Results were considered significant at p<0.05.
RESULTS
The MOSE ovarian cancer progression model presents a unique opportunity to study cellular and molecular changes as cancer progresses. Our previous studies have shown that among other functional categories, genes involved in cellular metabolism are changing during the progression of the MOSE cells [26]. These included genes involved in mitochondrial morphology and energy production, and glucose and fatty acid metabolism. Thus, we assessed whether the MOSE cells develop a glycolytic phenotype indicative of an aggressive cancer phenotype by assaying quantitative changes in the cellular metabolism during ovarian cancer progression.
Glucose and fatty acid oxidation in MOSE cells
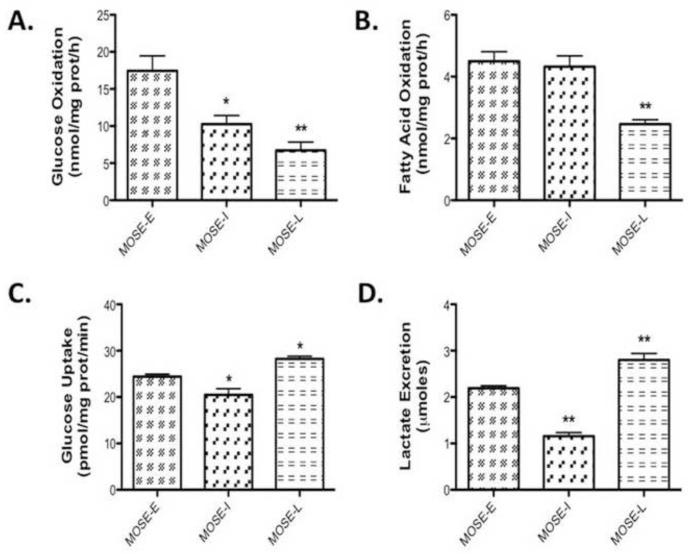
As shown in Figure 1A-B, glucose oxidation is higher than fatty acid oxidation in all cell types, demonstrating a choice of all MOSE cells for glucose over fatty acids as the preferred substrate. As cells progress, there was a significant decrease in glucose oxidation in both the MOSE-I (p<0.01) and MOSE-L cells (p<0.001), indicating a successive loss of glucose oxidation through the TCA cycle (Figure 1A). A significant decrease in fatty acid oxidation was detected in the MOSE-L cells (p<0.001); however, the level of fatty oxidation was already modest in the MOSE-E (Figure 1B). In comparison, glucose oxidation in MOSE-E cells is higher (~12nmol/mg-protein/h) and fatty acid oxidation is lower than average C2C12 skeletal muscle metabolism (~14nmol/mg-protein/h) [29], confirming the MOSE cells utilization of glucose as energy source.
Figure 1. MOSE cancer cell progression results in a glycolytic phenotype.
Cells were incubated in serum-free medium for 2h, the appropriate substrates added and changes in (A) glucose oxidation at 3 h, (B) fatty acid oxidation at 3 h, (C) lactate secretion at 8 h and (D) glucose uptake at 10 min in early (MOSE-E) intermediate (MOSE-I) and late (MOSE-L) stages of ovarian cancer were measured as described under methods. Data are presented as mean ± SEM. Different from MOSE-E, *p 0.01, **p 0.001.
Lactate secretion and glucose uptake
Warburg observed that cancer cells preferably convert glucose to lactate even under normoxic conditions [2, 3]. To further investigate this glycolytic shift during progression of the MOSE cells, we assayed cellular glucose uptake and lactate secretion. As expected, glucose uptake was moderately, but significantly elevated in the MOSE-L cells compared to the MOSE-E (p<0.05) and the MOSE-I (p<0.001) (Figure 1C). In addition to an increase in glucose uptake, lactate secretion was elevated compared to MOSE-E (p<0.001) and MOSE-I cells (p<0.001) (Figure 1D). Interestingly, MOSE-I cells representing an intermediate pheno- and genotype showed a significant decrease in both lactate secretion (p<0.001) and glucose uptake compared to MOSE-E (p<0.05) and MOSE-L cells (p<0.001), suggesting that transitional stages during cancer progression may have differing energy requirements and substrate utilization.
Changes in citrate synthase activity and TCA flux
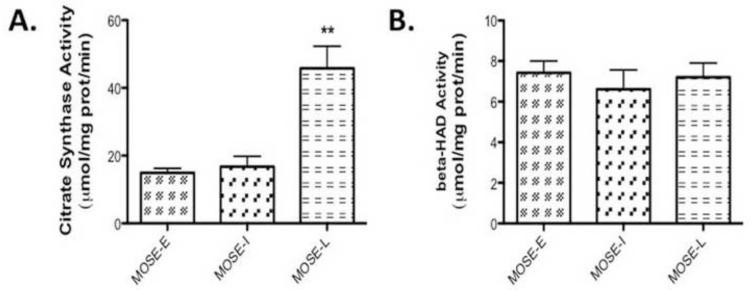
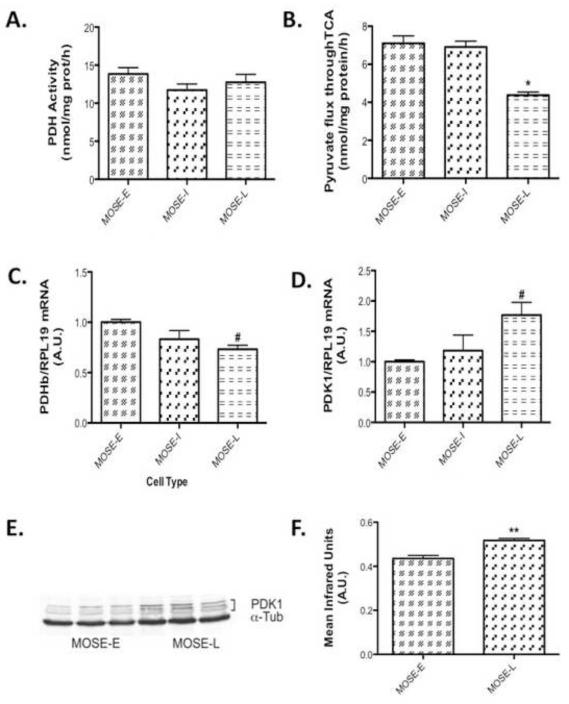
Given the increasingly glycolytic phenotype and the decrease of carbon flux away from oxidative phosphorylation of the MOSE cells, we next sought to further define the metabolic changes during MOSE cell progression. By measuring enzymatic changes in the TCA cycle, we determine changes in carbon flux through the TCA. We measured citrate synthase activity (Figure 2A), indicative of TCA activity and - HAD activity, indicative of beta-oxidation activity. Citrate synthase activity did not change in MOSE-I but showed a significant increase in the MOSE-L cells (p<0.001) over MOSE-E (Figure 2A), which was somewhat surprising given the decrease in total oxidation. However, there was no difference in -HAD activity (Figure 2B), suggesting that acetyl CoA does not fully complete oxidation in the TCA cycle but may be shuttled out of the mitochondria as citrate, accounting for the decrease in fatty acid oxidation but no change in -HAD activity. Therefore, we further investigated the activity of the TCA cycle by determining the flux of carbon skeletons from pyruvate through the TCA cycle using carbon-1 and carbon-2 labeled radioisotopes, respectively. Carbon-1 labeled pyruvate is cleaved in the PDH reaction producing radiolabeled acetyl CoA while carbon-2 is an indication of a complete carbon flux through the TCA cycle, producing radiolabeled CO2. As shown in Figure 3A, there were no significant differences in PDH activity but the TCA flux with the carbon-2 labeled pyruvate was significantly decreased in the MOSE-L cells (p<0.001) (Figure 3B), confirming the decrease in total oxidation. qPCR data show a decrease in expression of PDHb (p<0.05), one of the key enzymes in the PDH complex (Figure 3C). In addition, mRNA and protein levels show an increase in pyruvate dehydrogenase kinase 1 (PDK1) (p<0.05 mRNA and p<0.001 protein), the kinase that negatively regulates PDH activity (Figure 3D, E, and F).
Figure 2. Changes in enzymatic activity during MOSE progression.
(A) Citrate synthase and (B) β-hydroxyacyl-CoA dehydrogenase (ßHAD) activity in MOSE cells measured at baseline and for 6 min after substrate administration. Data are presented as mean ± SEM. **different from MOSE-E, p 0.001.
Figure 3. MOSE cell progression leads to a decrease in substrate flux through the TCA.
(A) Pyruvate dehydrogenase (PDH) activity after 3 h incubation with the substrate (B) and substrate flux through TCA in MOSE cells representing progressive ovarian cancer at 3 h. (C) qPCR determination of PDHb and (D) qPCR determination of pyruvate dehydrogenase kinase 1 (PDK1), a negative regulator of PDH. (E-F) Protein levels of PDK1. Data are presented as mean ± SEM. Different from MOSE-E, #p 0.05, *p 0.01, **p 0.001.
de novo fatty acid and cholesterol synthesis
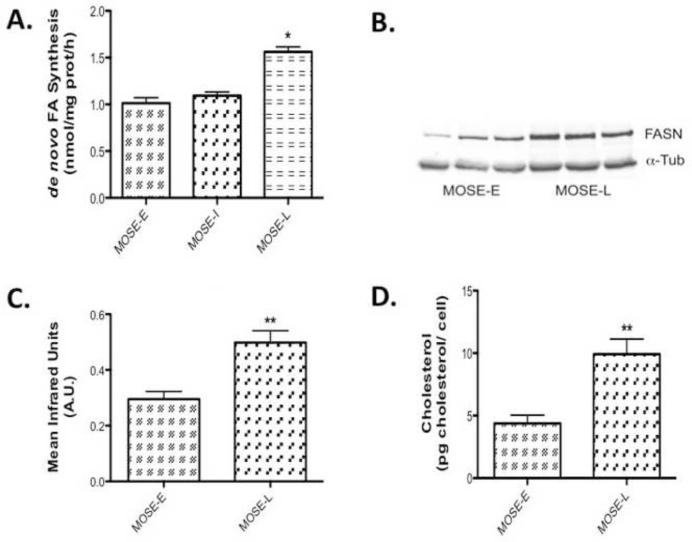
Next, we investigated if citrate leaves the TCA cycle and serves as substrate for fatty acid and cholesterol biosynthesis. Rather than determining the many potential key enzymes in these processes, we determined two key endpoints: de novo synthesis of fatty acids and cholesterol. As shown in Figure 4A, de novo fatty acid synthesis is significantly elevated in MOSE-L cells (p<0.001). This was associated with a significant increase in FASN protein levels of (p<0.001) (Figure 4B, C). In addition, cholesterol levels were also significantly increased in MOSE-L cells (p<0.001), (Figure 4D), suggesting that citrate generated by increased citrate synthase activity is utilized for lipid synthesis. Whether other pathways such as nucleotide synthesis are also fueled by this substrate will be investigated in future studies.
Figure 4. Lipid de novo synthesis is increased during MOSE cell progression.
(A) De novo fatty acid synthesis at 3 h; (B-C) Western Blot analysis of fatty acid synthase (FASN) protein levels in MOSE cells; (D) Increased cellular cholesterol levels in MOSE-L cells at basal conditions. Data are presented as mean ± SEM. Different from MOSE-E, *p 0.01, **p 0.001.
Mitochondrial oxygen consumption rate
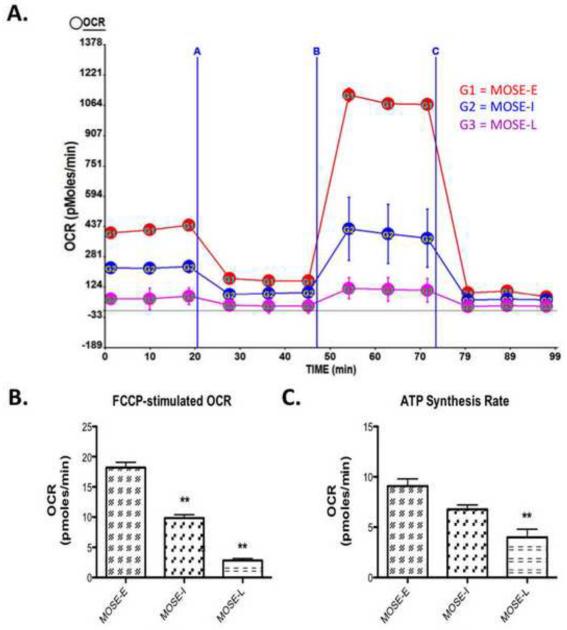
To further explore the mechanisms driving this glycolytic shift in the presence of ample oxygen, we assessed changes in mitochondrial capacity during MOSE cell progression. A decrease in mitochondrial capacity could allow for citrate to be shuttled out of the mitochondria, which would correspond to the observed decrease in TCA cycle flux. As cancer progresses towards a more aggressive phenotype, we observed a significant decline in the respiration, expressed as basal OCR from MOSE-E (14.0 ± 1.01 pmoles/min) to MOSE-I (10.44 ± 0.6 pmoles/min; p<0.05) to MOSE-L (6.20 ± 1.1 pmoles/min; p<0.001 vs MOSE-E; p<0.01 vs MOSE-I), indicating a reduction in oxidative metabolism. The increased FCCP-stimulated maximal oxygen consumption over basal OCR also declines as cancer progresses (Figure 5A). MOSE-E cells strongly responded to FCCP stimulation with an increase OCR; this response significantly declined from MOSE-I to MOSE-L (p<0.001) (Figure 5B). MOSE-L cells also showed a significantly reduced ATP synthesis rate as compared to MOSE-E (p<0.001) and MOSE-I (p<0.05) (Figure 5C), indirectly measured by reduced OCR when ATP synthase was inhibited, indicating a reliance on oxidative metabolism for ATP production.
Figure 5. Oxidative Capacity Rate is reduced in a step-wise manner during MOSE cell progression.
Oxidative capacity rate (OCR) was measured during an uncoupling challenge. Cellular respiration was modified by oligomycin, an ATP synthase blocker, carbonylcyanide-p-trifluoromethoxyphenyl hydrazone (FCCP), an electron transport chain uncoupler followed by rotenone, a complex one inhibitor of the electron transport chain. (A) Image of representative experiment where A is oligomycin treatment, B is FCCP treatment and C is rotenone treatment, measured over 2 h; (B) Change over base-line in OCR after FCCP treatment; (C) ATP synthesis rate as calculated by the difference between basal OCR and oligomycin blocked OCR. Data are presented as mean ± SEM. Different from MOSE-E, **p 0.001.
Glycolysis rate
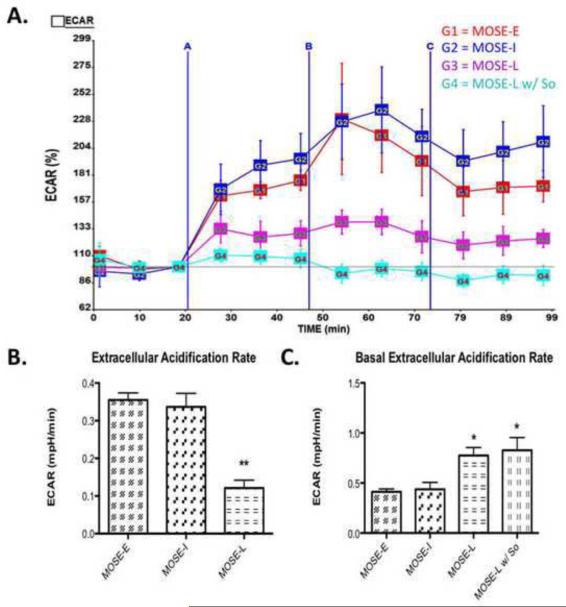
To confirm that the increase in glucose uptake in the MOSE-L cells correspond with an increased rate of glycolysis, we measured the extracellular acidification rate (ECAR), a marker for glycolysis. Cells with an increase in anaerobic glycolysis have an increase in proton production leading to an increase in acidification of the medium or ECAR. As shown in Figure 6C, the basal ECAR significantly increased in MOSE-L cells when compared to MOSE-E (p<0.05), indicating that the more aggressive cells are indeed more glycolytic. This appears to be close to the maximum rate for these cells since the ECAR change after oligomycin treatment increased significantly less than MOSE-E and MOSE-I cells (p<0.01) (Figure 6A-B). This suggests that glycolysis in the MOSE-L cells has been activated to a maximum rate that cannot be increased when ATP synthesis from oxidative metabolism is inhibited.
Figure 6. Extracellular Acidification Rate (ECAR) shows an increase in glycolysis during MOSE cell progression.
Extracellular acidification rate (ECAR), an indication of the rate of glycolysis was modified by oligomycin, carbonylcyanide-p-trifluoromethoxyphenyl hydrazone (FCCP), and rotenone (see Fig.5). (A) Image of representative experiment where A is oligomycin treatment, B is FCCP treatment and C is rotenone treatment, measured over 2 h; (B) Change in ECAR over baseline after olygomycin treatment, where So treatment for 3 passages decreased glycolysis rate; (C) Basal ECAR levels in MOSE cells, where MOSE-L and MOSE-L w/ So treatment have an increased rate of glycolysis at basal conditions. Data are presented as mean ± SEM. Different from MOSE-E *p 0.01, **p 0.001.
Metabolic changes during MOSE progression as targets for chemopreventive efforts with exogenous sphingosine
After establishing the altered cellular metabolism during MOSE cell progression, we next determined if So treatment could reverse the glycolytic phenotype. Our previous studies show that So is generated in the intestinal tract from complex sphingolipids in the diet and resulted in a significant suppression of colon and breast cancer growth and progression in vivo. Importantly, this effect is not a result of induction of apoptosis but a reduction of proliferation [18, 19, 23]. Therefore, for the present studies, exogenous So concentrations were used that reduced cell growth and reduced the tumorigenic potential of the MOSE-L cells (data not shown).
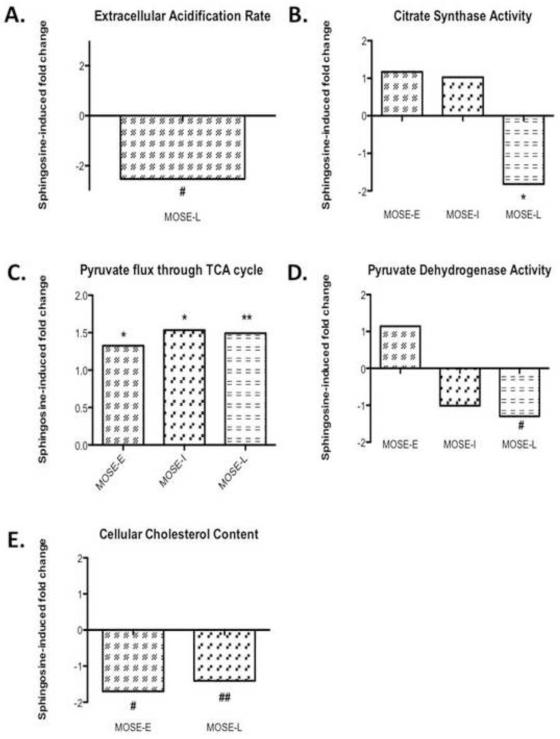
There was no statistically significant decrease of So treatment on glucose uptake (28.2 ± 0.58 pmol/mg prot/min vs 25.0 ± 1.83 pmol/mg prot/min in So-treated MOSE-L) (p=0.098) or lactate secretion in the MOSE-L cells (2.80 ± 0.14 μM v. 2.57 ± 0.17 μM in So-treated MOSE-L) (p=0.307). However, So decreased ECAR in MOSE-L cells from 0.12 mPH/min in the MOSE-L to 0.05 mPH/min in MOSE-L cells (p<0.05), a −2.53-fold reduction compared to untreated cells (Figure 7A) while it did not affect their basal ECAR (Figure 6C). This indicates that So further reduced the capacity of the MOSE-L cells to respond to the increased demand on glycolysis for ATP production.
Figure 7. Sphingosine-induced changes restore a more oxidative phenotype.
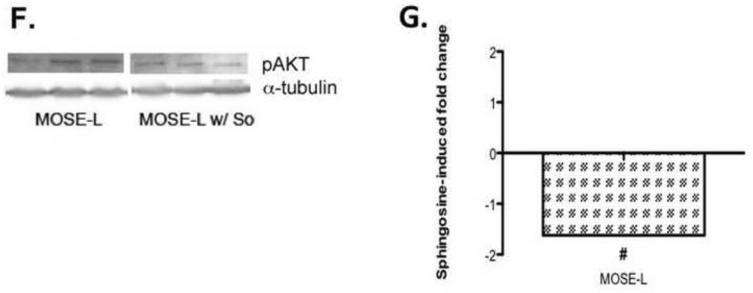
Changes in (A), extracellular acidification rate (ECAR), (B) citrate synthase activity, (C) pyruvate flux through TCA, (D) pyruvate dehydrogenase activity, (E) cholesterol content, (F, G) p-AKT protein content upon sphingosine (So) treatment in three replicates of MOXE-L (first three bands) MOSE-L cells treated with sphingosine (So) (last three bands). Data are presented as fold-differences from untreated controls. Different from untreated controls #p 0.05, *p 0.01, **p 0.001, ##p=0.055.
So significantly decreased citrate synthase activity in MOSE-L cells from 45.8 mol/mg protein/min in the MOSE-L to 25.2 mol/mg protein/min (p<0.001), a −1.82-fold decrease while there was no significant change in MOSE-E or –I cells (Figure 7B). So treatment did not alter ß-HAD activity but the reduction of citrate synthase activity coincides with a significantly increased TCA flux of pyruvate carbons in all MOSE cells (Figure 7C). This effect was modest in the MOSE-E (from 7.1 nmol/mg protein/h to 9.4 nmol/mg protein/h, p<0.01, a 1.33 fold increase), but more robust in the MOSE-I (from 6.9 nmol/mg protein/h to 10.6 nmol/mg protein/h, p<0.01, a 1.53-fold increase) and MOSE-L cells (from 4.4 nmol/mg protein/h to 6.5 nmol/mg protein/h, p<0.001, a 1.49-fold increase) compared to their untreated counterparts (see also Figure 3B). We also observed a significant decrease in PDH activity (Figure 7D) in MOSE-L cells treated with So (from 12.75 nmol/mg protein/h to 9.82 nmol/mg protein/hr, a −1.3-fold decrease, p< 0.05); there was no difference in MOSE-E or MOSE-I. While we did not detect a reversal of the elevated fatty acid synthesis or the expression of FASN in the MOSE-L cells after treatment with So (not shown), cellular cholesterol levels were significantly reduced in So-treated cells (from 4.4 pg cholesterol/cell to 2.6 pg cholesterol/cell) (p<0.05), by −1.70-fold in MOSE-E cells, and by −1.41-fold in MOSE-L cells (from 9.9 pg cholesterol/cell to 7.0 pg cholesterol/cell) (p=0.055) (Figure 7E). Finally, to direct our future mechanistic studies we determined the impact of So on activity of AKT that is critically involved in the regulation of metabolism. As shown in Figure 7 (F, G), AKT phosphorylation was significantly decreased after So treatment by −1.62-fold (p<0.05).
DISCUSSION
The early detection of ovarian cancer significantly increases the survival of women with ovarian cancer. Since an aberrant metabolism has been described in many cancers, our present studies investigated the time course of the metabolic switch and the altered use of intermediate substrates in a mouse cell model for progressive ovarian cancer and identified targets for sphingosine, the bioactive sphingolipid metabolite critically involved in the suppression of colon and breast cancer. Here we demonstrate the increasingly glycolytic nature of MOSE cells as an early event during progression, and significant changes in ECAR, glucose uptake and lactate secretion that occur only in late stages. Furthermore, we show an aberrant TCA cycle flux that results in substrates leaving the TCA cycle, associated with an elevated fatty acid and cholesterol biosynthesis in the more aggressive MOSE-L. Treatment with exogenous So in concentrations that did not induce cell death but decreased the tumorigenic potential of the MOSE-L cells did not alter glucose uptake and lactate secretion at any stage of the disease. However, the rate of glycolysis, citrate synthase activity, and the carbon flux through the TCA cycle were shifted towards levels seen in the benign MOSE-E, which was accompanied by a significant reduction of cholesterol levels. These results demonstrate that So –while not inducing cell death-can partially reverse metabolic changes that occur even during late stages of ovarian cancer.
Although the MOSE cells are cultured in an oxygen abundant environment, they make the same glycolytic shift observed with in vivo ovarian cancers, characterized by decrease in glucose and fatty acid oxidation, an increase in glucose uptake and lactate production and secretion, confirming the events that constitute the Warburg effect. This is in contrast to the hypothesis that the glycolytic shift occurs only as response to hypoxia [8], but confirms that detectable changes of glucose uptake are a late event in carcinogenesis, coinciding with the progression from a pre-malignant to an invasive phenotype as has been described in colon cancer [33] and aligns with the increased demand for macromolecule synthesis, necessary for the fast growing MOSE-L cells [25]. Consequently, increased glucose uptake is not indicative of early stages of ovarian cancer.
The secretion of lactate by tumor cells has been shown to generate a microenvironment permissive for progression of cancers and metastasis [6, 7, 34]. Secreted lactate can be taken up by tumor and other neighboring cells and recycled to pyruvate as an energy source [35] while the lactate-induced low pH favors the expansion of transformed cells; normal cells are more sensitive to the acidic environment. Furthermore, lactate contributes to an immune suppressive microenvironment by modulation of monocyte proliferation, differentiation and activation (see recent review [36]). This identifies lactate production and secretion as a promising target for prevention efforts; lactate secretion is, however, not a target of exogenous So in cells growing under normoxic conditions.
Although there was no difference in PDH activity during the progression of the MOSE cells, it is possible that with the increase in glucose uptake, MOSE-L cells actually have reduced PDH activity, but an increase in flux compared to MOSE-E, leading to no statistical difference. The increase in PDK mRNA and protein support this hypothesis with the concomitant decrease in PDH mRNA and protein. The progression of the MOSE cells was also accompanied by a decrease in carbon flux through the TCA cycle, but an increase in citrate synthase activity. With a decrease in carbon flux, but an increase in citrate synthase activity in the MOSE-L cells, we hypothesized that not only is pyruvate being converted to lactate and secreted by the cells, but a significant portion is being converted to acetyl CoA and entering the TCA cycle. Instead of completing the TCA cycle, the acetyl CoA is converted to citrate and is shuttled out of the mitochondria as citrate. In the cytoplasm the citrate is converted to acetyl CoA and used as a precursor for de novo fatty acid and cholesterol biosynthesis. Both are elevated in MOSE-L cells that proliferate twice as fast as MOSE-E cells [25]; to support their increased growth rate, an increase in phospholipid, fatty acid and cholesterol synthesis would be crucial. Thus, increasing TCA flux by So may reduce the available substrate for cholesterol biosynthesis, impairing membrane assembly, and, potentially, cell growth. If this is independent of modulating the expression or activity of critical enzymes in cholesterol biosynthesis, or affect fatty acid synthesis in cells grown in fatty acid-depleted medium needs to be investigated in more detail. This is especially important since the reduction of cholesterol has been associated with a decrease in cancer incidence in patients using statins [37], potentially via modulating processes involving membranes such as migration [38].
The changes in cellular metabolism and the increasingly glycolytic nature were accompanied by a reduction in oxidative capacity of the mitochondria. FCCP uncouples mitochondrial respiration from ATP synthesis thus requiring the mitochondria to drastically increase oxygen consumption to keep up with the flow of protons back into the matrix. This reflects the capacity of a cell to meet an increased ATP demand. Our data indicate a decrease in FCCP-stimulated respiration in the MOSE-L cells in conjunction with a decreased ATP synthesis rate and a lower basal OCR (Figure 6A), suggesting that during neoplastic progression, MOSE cells have lost the capacity to up-regulate their oxygen consumption upon energy demand. The reduced FCCP-stimulated respiration could result either from dysfunction in the electron transport chain, decreased number of mitochondria or mitochondria that are already uncoupled and therefore cannot respond to further uncoupling. Similar results have been reported for highly aggressive lung cancer cells, compared to a less aggressive lung cancer cell line and it was concluded that the aggressive cells have a decreased capacity of switching from glycolysis to mitochondrial respiration [39].
Ovarian cancer cells are exfoliated and disseminate throughout the peritoneal cavity rather than the blood or lymphatic systems. Up to 2uM S1P in ascites of ovarian cancer patients have been reported [40, 41] that can support tumor growth and progression. The concentrations of So in ascites are not known. Our in vivo studies have shown that the induction of apoptosis is not involved as a mechanism of tumor suppression by orally administered sphingolipids but rather a reduction of proliferation of the tumor cells [18, 20]. Thus, here we use non-toxic concentrations of So over time to identify potential targets of So that reduced cancer cell growth but not their viability (data not shown). So treatment completely inhibited the modest upregulation of glycolysis to meet ATP needs after FCCP treatment of MOSE-L cells. This has also been observed by other anti-cancer treatments and is thought to be associated with a toxic effect on cancer but not non-transformed cells [42]. This may be tissue specific since the suppression of respiration protects against apoptosis in muscle [43]. While So treatment does not induce cell death, one could speculate that this lack of response to energy demand puts the cell into a disadvantage and may be associated with a suppression of tumor growth; this needs to be investigated in more detail.
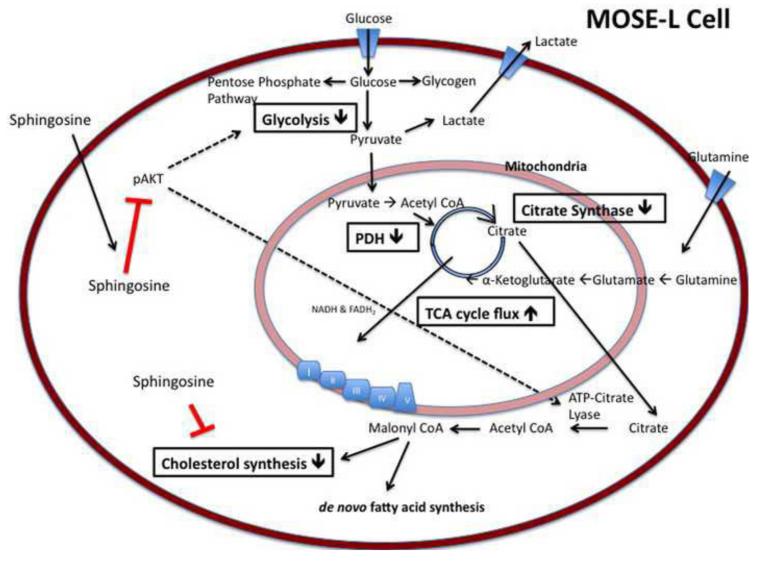
Figure 8 illustrates possible mechanisms for the So-induced changes observed. So has been shown to decrease phosphorylated AKT (p-AKT), thereby decreasing its activity [44], which was confirmed in our experiments (Figure 7G,H). Activated AKT is known to increase glycolysis through phosphorylation of hexokinase, securing it to the mitochondrial membrane and through the phosphorylation of phosphofructokinase-2, which allosterically increases the activity of phosphofructkinase-1 thereby increasing the flux of glycolysis [45, 46]. It is also known to phosphorylate ATP-citrate lyase, an integral enzyme in de novo fatty acid synthesis, enhancing the activity of the enzyme [47, 48]. However, a direct effect of So on key enzymes of the TCA cycle, glycolysis or cholesterol biosynthesis are also possible. Furthermore, So treatment over time could affect the sphingolipid metabolite profile in the MOSE cells which could be involved in the observed effects; detailed analyses are currently conducted in our laboratories.
Figure 8. Metabolic changes in aggressive MOSE-L cells, and targets for intervention with So.
MOSE-L cells demonstrate an increased uptake of glucose, glycolysis, and lactate secretion in addition to an altered TCA flux and citrate synthase activity, generating intermediates for fatty acid and cholesterol synthesis. Boxes indicate So-induced changes in metabolic parameters in MOSE-L cells. Activated AKT (p-AKT) stimulates glycolysis, and activates ATP-citrate lyase, elevating lipid synthesis. In addition to a direct effect of So on cholesterol biosynthesis, TCA cycle, and glycolysis, the inactivation of AKT by So could decrease the activity of ATP-citrate lyase and indirectly lead to a decrease in cholesterol synthesis.
CONCLUSION
We demonstrate the development of an increasingly glycolytic and lipogenic phenotype, and changes in the mitochondria respiration capacity during ovarian cancer progression synthesis. These changes occur mostly in the tumorigenic MOSE-L cells and are therefore not a marker for early stage ovarian cancer. Treatment with non-toxic concentrations of So modulates cellular metabolism via several targets; while not detrimental to the cancer cells, the observed changes in citrate synthase activity, TCA flux, mitochondrial respiration and cholesterol biosynthesis by So treatment may be a disadvantage to the tumor cells and impair tumor growth. The MOSE model has proven to reflect metabolic changes that have been associated with tumorigenesis and progression and is used to further explore the beneficial effect of dietary sphingolipids in the prevention and treatment of ovarian cancer.
Highlights.
-During ovarian cancer progression, cells become more glycolytic
-Changes in the TCA flux generate substrates for fatty acid and cholesterol biosynthesis
-During progression, the mitochondria show a decreased maximum respiration rate
-Exogenous sphingosine targets citrate synthase, TCA flux, glycolysis and cholesterol biosynthesis
ACKNOWLEDGEMENTS
We would like to thank Dr. Yaru Wu for her assistance in using the Seahorse XF24 extracellular flux analyzer.
FUNDING These studies were supported in part by NIH R01 CA118846 and AICR grant 04B071 (EMS, PCR), and funds provided by the Fralin Life Sciences Institute at Virginia Tech (MWH). The funding agencies had no role in the design, performance and analyses of experiments, and writing this report.
Footnotes
Publisher's Disclaimer: This is a PDF file of an unedited manuscript that has been accepted for publication. As a service to our customers we are providing this early version of the manuscript. The manuscript will undergo copyediting, typesetting, and review of the resulting proof before it is published in its final citable form. Please note that during the production process errors may be discovered which could affect the content, and all legal disclaimers that apply to the journal pertain.
Abbreviations: So, sphingosine; TCA, tricarboxylic acid cycle; FASN, fatty acid synthase; ß-HAD, ß-hydroxyl-CoA dehydrogenase; PDH, pyruvate dehydrogenase; OCR, oxygen consumption rate; ECAR, extracellular acidification rate;
DISCLOSURE STATEMENT The authors have no conflict of interest to disclose.
References
- [1].Facts and Figures 2008. American Cancer Society; Atlanta: 2008. [Google Scholar]
- [2].Warburg O. On the origin of cancer cells. Science. 1956;123:309–314. doi: 10.1126/science.123.3191.309. [DOI] [PubMed] [Google Scholar]
- [3].Warburg O, Wind F, Negelein E. The Metabolism of Tumors in the Body. J Gen Physiol. 1927;8:519–530. doi: 10.1085/jgp.8.6.519. [DOI] [PMC free article] [PubMed] [Google Scholar]
- [4].Pinheiro C, Reis RM, Ricardo S, Longatto-Filho A, Schmitt F, Baltazar F. Expression of monocarboxylate transporters 1, 2, and 4 in human tumours and their association with CD147 and CD44. J Biomed Biotechnol. 2010:427694. doi: 10.1155/2010/427694. [DOI] [PMC free article] [PubMed] [Google Scholar]
- [5].Ganapathy V, Thangaraju M, Prasad PD. Nutrient transporters in cancer: relevance to Warburg hypothesis and beyond. Pharmacol Ther. 2009;121:29–40. doi: 10.1016/j.pharmthera.2008.09.005. [DOI] [PubMed] [Google Scholar]
- [6].Cuvier C, Jang A, Hill RP. Exposure to hypoxia, glucose starvation and acidosis: effect on invasive capacity of murine tumor cells and correlation with cathepsin (L + B) secretion. Clin Exp Metastasis. 1997;15:19–25. doi: 10.1023/a:1018428105463. [DOI] [PubMed] [Google Scholar]
- [7].Rofstad EK, Mathiesen B, Kindem K, Galappathi K. Acidic extracellular pH promotes experimental metastasis of human melanoma cells in athymic nude mice. Cancer Res. 2006;66:6699–6707. doi: 10.1158/0008-5472.CAN-06-0983. [DOI] [PubMed] [Google Scholar]
- [8].Zu XL, Guppy M. Cancer metabolism: facts, fantasy, and fiction. Biochem Biophys Res Commun. 2004;313:459–465. doi: 10.1016/j.bbrc.2003.11.136. [DOI] [PubMed] [Google Scholar]
- [9].Cairns RA, Harris IS, Mak TW. Regulation of cancer cell metabolism. Nat Rev Cancer. 2011;11:85–95. doi: 10.1038/nrc2981. [DOI] [PubMed] [Google Scholar]
- [10].Yuneva M, Zamboni N, Oefner P, Sachidanandam R, Lazebnik Y. Deficiency in glutamine but not glucose induces MYC-dependent apoptosis in human cells. J Cell Biol. 2007;178:93–105. doi: 10.1083/jcb.200703099. [DOI] [PMC free article] [PubMed] [Google Scholar]
- [11].Postovit LM, Adams MA, Lash GE, Heaton JP, Graham CH. Oxygen-mediated regulation of tumor cell invasiveness. Involvement of a nitric oxide signaling pathway. J Biol Chem. 2002;277:35730–35737. doi: 10.1074/jbc.M204529200. [DOI] [PubMed] [Google Scholar]
- [12].Gatenby RA, Gillies RJ. Why do cancers have high aerobic glycolysis? Nat Rev Cancer. 2004;4:891–899. doi: 10.1038/nrc1478. [DOI] [PubMed] [Google Scholar]
- [13].Gault CR, Obeid LM, Hannun YA. An overview of sphingolipid metabolism: from synthesis to breakdown. Adv Exp Med Biol. 2010;688:1–23. doi: 10.1007/978-1-4419-6741-1_1. [DOI] [PMC free article] [PubMed] [Google Scholar]
- [14].Gangoiti P, Camacho L, Arana L, Ouro A, Granado MH, Brizuela L, Casas J, Fabrias G, Abad JL, Delgado A, Gomez-Munoz A. Control of metabolism and signaling of simple bioactive sphingolipids: Implications in disease. Prog Lipid Res. 2010;49:316–334. doi: 10.1016/j.plipres.2010.02.004. [DOI] [PubMed] [Google Scholar]
- [15].Holland WL, Summers SA. Sphingolipids, insulin resistance, and metabolic disease: new insights from in vivo manipulation of sphingolipid metabolism. Endocr Rev. 2008;29:381–402. doi: 10.1210/er.2007-0025. [DOI] [PMC free article] [PubMed] [Google Scholar]
- [16].Schmelz EM, Dillehay DL, Webb SK, Reiter A, Adams J, Merrill AH., Jr. Sphingomyelin consumption suppresses aberrant colonic crypt foci and increases the proportion of adenomas versus adenocarcinomas in CF1 mice treated with 1,2-dimethylhydrazine: implications for dietary sphingolipids and colon carcinogenesis. Cancer Res. 1996;56:4936–4941. [PubMed] [Google Scholar]
- [17].Schmelz EM, Bushnev AS, Dillehay DL, Sullards MC, Liotta DC, Merrill AH., Jr. Ceramide-beta-D-glucuronide: synthesis, digestion, and suppression of early markers of colon carcinogenesis. Cancer Res. 1999;59:5768–5772. [PubMed] [Google Scholar]
- [18].Schmelz EM, Sullards MC, Dillehay DL, Merrill AH., Jr. Colonic cell proliferation and aberrant crypt foci formation are inhibited by dairy glycosphingolipids in 1, 2-dimethylhydrazine-treated CF1 mice. J Nutr. 2000;130:522–527. doi: 10.1093/jn/130.3.522. [DOI] [PubMed] [Google Scholar]
- [19].Lemonnier LA, Dillehay DL, Vespremi MJ, Abrams J, Brody E, Schmelz EM. Sphingomyelin in the suppression of colon tumors: prevention versus intervention. Arch Biochem Biophys. 2003;419:129–138. doi: 10.1016/j.abb.2003.08.023. [DOI] [PubMed] [Google Scholar]
- [20].Schmelz EM, Bushnev AS, Dillehay DL, Liotta DC, Merrill AH., Jr. Suppression of aberrant colonic crypt foci by synthetic sphingomyelins with saturated or unsaturated sphingoid base backbones. Nutr Cancer. 1997;28:81–85. doi: 10.1080/01635589709514556. [DOI] [PubMed] [Google Scholar]
- [21].Symolon H, Schmelz EM, Dillehay DL, Merrill AH., Jr. Dietary soy sphingolipids suppress tumorigenesis and gene expression in 1,2-dimethylhydrazine-treated CF1 mice and ApcMin/+ mice. J Nutr. 2004;134:1157–1161. doi: 10.1093/jn/134.5.1157. [DOI] [PubMed] [Google Scholar]
- [22].Mazzei JC, Zhou H, Brayfield BP, Hontecillas R, Bassaganya-Riera J, Schmelz EM. Suppression of intestinal inflammation and inflammation-driven colon cancer in mice by dietary sphingomyelin: importance of peroxisome proliferator-activated receptor gamma expression. J Nutr Biochem. 2011;22:1160–1171. doi: 10.1016/j.jnutbio.2010.09.017. [DOI] [PMC free article] [PubMed] [Google Scholar]
- [23].Simon KW, Tait L, Miller F, Cao C, Davy K, LeRoith T, Schmelz EM. Suppression of breast xenograft growth and progression in nude mice: implications for the use of orally administered sphingolipids as chemopreventive agents against breast cancer. Food & Function. 2010;1:90–98. doi: 10.1039/c0fo00108b. [DOI] [PubMed] [Google Scholar]
- [24].Schmelz EM, Crall KJ, Larocque R, Dillehay DL, Merrill AH., Jr. Uptake and metabolism of sphingolipids in isolated intestinal loops of mice. J Nutr. 1994;124:702–712. doi: 10.1093/jn/124.5.702. [DOI] [PubMed] [Google Scholar]
- [25].Roberts PC, Mottillo EP, Baxa AC, Heng HH, Doyon-Reale N, Gregoire L, Lancaster WD, Rabah R, Schmelz EM. Sequential molecular and cellular events during neoplastic progression: a mouse syngeneic ovarian cancer model. Neoplasia. 2005;7:944–956. doi: 10.1593/neo.05358. [DOI] [PMC free article] [PubMed] [Google Scholar]
- [26].Creekmore AL, Silkworth WT, Cimini D, Jensen RV, Roberts PC, Schmelz EM. Changes in gene expression and cellular architecture in an ovarian cancer progression model. Plos One. 2011;6:e17676. doi: 10.1371/journal.pone.0017676. [DOI] [PMC free article] [PubMed] [Google Scholar]
- [27].Cortright RN, Sandhoff KM, Basilio JL, Berggren JR, Hickner RC, Hulver MW, Dohm GL, Houmard JA. Skeletal muscle fat oxidation is increased in African-American and white women after 10 days of endurance exercise training. Obesity (Silver Spring) 2006;14:1201–1210. doi: 10.1038/oby.2006.137. [DOI] [PubMed] [Google Scholar]
- [28].Dyck DJ, Peters SJ, Glatz J, Gorski J, Keizer H, Kiens B, Liu S, Richter EA, Spriet LL, van der Vusse GJ, Bonen A. Functional differences in lipid metabolism in resting skeletal muscle of various fiber types. Am J Physiol. 1997;272:E340–351. doi: 10.1152/ajpendo.1997.272.3.E340. [DOI] [PubMed] [Google Scholar]
- [29].Frisard MI, McMillan RP, Marchand J, Wahlberg KA, Wu Y, Voelker KA, Heilbronn L, Haynie K, Muoio B, Li L, Hulver MW. Toll-like receptor 4 modulates skeletal muscle substrate metabolism. Am J Physiol Endocrinol Metab. 2010;298:E988–998. doi: 10.1152/ajpendo.00307.2009. [DOI] [PMC free article] [PubMed] [Google Scholar]
- [30].Heilbronn LK, Civitarese AE, Bogacka I, Smith SR, Hulver M, Ravussin E. Glucose tolerance and skeletal muscle gene expression in response to alternate day fasting. Obes Res. 2005;13:574–581. doi: 10.1038/oby.2005.61. [DOI] [PubMed] [Google Scholar]
- [31].Hulver MW, Berggren JR, Cortright RN, Dudek RW, Thompson RP, Pories WJ, MacDonald KG, Cline GW, Shulman GI, Dohm GL, Houmard JA. Skeletal muscle lipid metabolism with obesity. Am J Physiol Endocrinol Metab. 2003;284:E741–747. doi: 10.1152/ajpendo.00514.2002. [DOI] [PubMed] [Google Scholar]
- [32].Gerencser AA, Neilson A, Choi SW, Edman U, Yadava N, Oh RJ, Ferrick DA, Nicholls DG, Brand MD. Quantitative microplate-based respirometry with correction for oxygen diffusion. Anal Chem. 2009;81:6868–6878. doi: 10.1021/ac900881z. [DOI] [PMC free article] [PubMed] [Google Scholar]
- [33].Younes M, Lechago LV, Lechago J. Overexpression of the human erythrocyte glucose transporter occurs as a late event in human colorectal carcinogenesis and is associated with an increased incidence of lymph node metastases. Clin Cancer Res. 1996;2:1151–1154. [PubMed] [Google Scholar]
- [34].Walenta S, Schroeder T, Mueller-Klieser W. Lactate in solid malignant tumors: potential basis of a metabolic classification in clinical oncology. Curr Med Chem. 2004;11:2195–2204. doi: 10.2174/0929867043364711. [DOI] [PubMed] [Google Scholar]
- [35].Sonveaux P, Vegran F, Schroeder T, Wergin MC, Verrax J, Rabbani ZN, De Saedeleer CJ, Kennedy KM, Diepart C, Jordan BF, Kelley MJ, Gallez B, Wahl ML, Feron O, Dewhirst MW. Targeting lactate-fueled respiration selectively kills hypoxic tumor cells in mice. J Clin Invest. 2008;118:3930–3942. doi: 10.1172/JCI36843. [DOI] [PMC free article] [PubMed] [Google Scholar]
- [36].Singer K, Gottfried E, Kreutz M, Mackensen A. Suppression of T-cell responses by tumor metabolites. Cancer Immunol Immunother. 2011;60:425–431. doi: 10.1007/s00262-010-0967-1. [DOI] [PMC free article] [PubMed] [Google Scholar]
- [37].Farwell WR, Scranton RE, Lawler EV, Lew RA, Brophy MT, Fiore LD, Gaziano JM. The association between statins and cancer incidence in a veterans population. J Natl Cancer Inst. 2008;100:134–139. doi: 10.1093/jnci/djm286. [DOI] [PubMed] [Google Scholar]
- [38].Murai T, Maruyama Y, Mio K, Nishiyama H, Suga M, Sato C. Low cholesterol triggers membrane microdomain-dependent CD44 shedding and suppresses tumor cell migration. J Biol Chem. 2011;286:1999–2007. doi: 10.1074/jbc.M110.184010. [DOI] [PMC free article] [PubMed] [Google Scholar]
- [39].Wu M, Neilson A, Swift AL, Moran R, Tamagnine J, Parslow D, Armistead S, Lemire K, Orrell J, Teich J, Chomicz S, Ferrick DA. Multiparameter metabolic analysis reveals a close link between attenuated mitochondrial bioenergetic function and enhanced glycolysis dependency in human tumor cells. Am J Physiol Cell Physiol. 2007;292:C125–136. doi: 10.1152/ajpcell.00247.2006. [DOI] [PubMed] [Google Scholar]
- [40].Hong G, Baudhuin LM, Xu Y. Sphingosine-1-phosphate modulates growth and adhesion of ovarian cancer cells. FEBS Lett. 1999;460:513–518. doi: 10.1016/s0014-5793(99)01400-3. [DOI] [PubMed] [Google Scholar]
- [41].Wang D, Zhao Z, Caperell-Grant A, Yang G, Mok SC, Liu J, Bigsby RM, Xu Y. S1P differentially regulates migration of human ovarian cancer and human ovarian surface epithelial cells. Mol Cancer Ther. 2008;7:1993–2002. doi: 10.1158/1535-7163.MCT-08-0088. [DOI] [PMC free article] [PubMed] [Google Scholar]
- [42].Chen V, Staub RE, Fong S, Tagliaferri M, Cohen I, Shtivelman E. Bezielle selectively targets mitochondria of cancer cells to inhibit glycolysis and OXPHOS. PLoS One. 2012;7:e30300. doi: 10.1371/journal.pone.0030300. [DOI] [PMC free article] [PubMed] [Google Scholar]
- [43].Lesnefsky EJ, Chen Q, Moghaddas S, Hassan MO, Tandler B, Hoppel CL. Blockade of electron transport during ischemia protects cardiac mitochondria. J Biol Chem. 2004;279:47961–47967. doi: 10.1074/jbc.M409720200. [DOI] [PubMed] [Google Scholar]
- [44].Chang HC, Tsai LH, Chuang LY, Hung WC. Role of AKT kinase in sphingosine-induced apoptosis in human hepatoma cells. Journal of cellular physiology. 2001;188:188–193. doi: 10.1002/jcp.1108. [DOI] [PubMed] [Google Scholar]
- [45].Vander Heiden MG, Cantley LC, Thompson CB. Understanding the Warburg effect: the metabolic requirements of cell proliferation. Science. 2009;324:1029–1033. doi: 10.1126/science.1160809. [DOI] [PMC free article] [PubMed] [Google Scholar]
- [46].Lunt SY, Vander Heiden MG. Aerobic glycolysis: meeting the metabolic requirements of cell proliferation. Annu Rev Cell Dev Biol. 2011;27:441–464. doi: 10.1146/annurev-cellbio-092910-154237. [DOI] [PubMed] [Google Scholar]
- [47].Berwick DC, Hers I, Heesom KJ, Moule SK, Tavare JM. The identification of ATP-citrate lyase as a protein kinase B (Akt) substrate in primary adipocytes. J Biol Chem. 2002;277:33895–33900. doi: 10.1074/jbc.M204681200. [DOI] [PubMed] [Google Scholar]
- [48].Migita T, Narita T, Nomura K, Miyagi E, Inazuka F, Matsuura M, Ushijima M, Mashima T, Seimiya H, Satoh Y, Okumura S, Nakagawa K, Ishikawa Y. ATP citrate lyase: activation and therapeutic implications in non-small cell lung cancer. Cancer Res. 2008;68:8547–8554. doi: 10.1158/0008-5472.CAN-08-1235. [DOI] [PubMed] [Google Scholar]


