

Abstract
Background
Tumor cells present high levels of oxidative stress. Cancer therapeutics exploiting such biochemical changes by increasing reactive oxygen species (ROS) production or decreasing intracellular ROS scavengers could provide a powerful treatment strategy.
Methods
To test the effect of our compound, obtusaquinone (OBT), we used several cell viability assays on seven different glioblastoma (GBM) cell lines and primary cells and on 12 different cell lines representing various cancer types in culture as well as on subcutaneous (n = 7 mice per group) and two intracranial GBM (n = 6–8 mice per group) and breast cancer (n = 6 mice per group) tumor models in vivo. Immunoblotting, immunostaining, flow cytometry, and biochemical assays were used to investigate the OBT mechanism of action. Histopathological analysis (n = 2 mice per group) and blood chemistry (n = 2 mice per group) were used to test for any compound-related toxicity. Statistical tests were two-sided.
Results
OBT induced rapid increase in intracellular ROS levels, downregulation of cellular glutathione levels and increase in its oxidized form, and activation of cellular stress pathways and DNA damage, subsequently leading to apoptosis. Oxidative stress is believed to be the main mechanism through which this compounds targets cancer cells. OBT was well tolerated in mice, slowed tumor growth, and statistically prolonged survival in GBM tumor models. The ratio of median survival in U251 intracranial model in OBT vs control was 1.367 (95% confidence interval [CI] of ratio = 1.031 to 1.367, P = .008). Tumor growth inhibition was also observed in a mouse breast cancer model (average tumor volume per mouse, OBT vs control: 36.3 vs 200.4mm3, difference = 164.1mm3, 95% CI =72.6 to 255.6mm3, P = .005).
Conclusions
Given its properties and efficacy in cancer killing, our results suggest that OBT is a promising cancer therapeutic.
Cancer therapeutics are becoming increasingly effective in controlling tumor growth and progression, yet the chief challenge remains to selectively kill tumor cells while having little or no toxicity on their normal counterparts. In that context, compounds that target cancer-related genetic alterations offer a great alternative; however, due to the heterogeneity of tumors, these drugs are often limited to a selective group of patients and tumors can often circumvent their efficiency and become resistant (1). Another therapeutic approach consists of exploiting the biochemical changes in cancer. Tumor cells present particularly high levels of oxidative stress (2). This is generally caused by an increase in reactive oxygen species (ROS) production or a decrease in intracellular ROS scavengers (3). A marked increase in ROS is believed to promote cell survival and confer resistance to therapy (4). Given this different redox state between normal and tumor cells, it is believed that the latter has a greater reliance on their ROS-scavenging capacities. Thus, further increase in oxidative stress can overwhelm this stress response in tumor cells, leading to cell death.
Through small molecule drug screening assay based on the secreted Gaussia luciferase bioluminescent reporter as a cell viability readout (5), we identified a natural compound, obtusaquinone (OBT) that exhibited substantial toxicity toward different glioblastoma (GBM) cell lines and primary cells as well as toward twelve different cancer cell lines. OBT is a quinone methide extracted from the heartwood of Dalbergia retusa (cocobolo) (6). This compound has been shown to present antifungal properties (7). Here we describe the antineoplastic activity of OBT and its selective killing of tumor cells through an ROS-dependent mechanism.
Methods
Cell Culture
Unless mentioned otherwise, all cell lines used in this study were obtained from American Type Culture Collection (ATCC) and grown in Dulbecco’s modified Eagle medium supplemented with 10% fetal bovine serum (Sigma-Aldrich, St. Louis, MO), 100U penicillin, and 0.1mg/mL streptomycin (Sigma). MDA-MB231Br cells were obtained from Dr Patricia Steeg (National Cancer Institute, Bethesda, MD). Primary GBM cells dissociated from tumor tissues of GBM patients (GBM6 and GBM8) had been previously characterized by Dr Samuel Rabkins Group (Massachusetts General Hospital, Boston, MA) (8). Those cells were maintained as neurospheres in human neural stem cell media (NeuroCult; STEMCELL Technologies, Vancouver, Canada) supplemented with recombinant human epidermal growth factor (EGF) (20ng/ml), fibroblast growth factor (FGF) (10ng/ml) (Peprotech, Rocky Hill, NJ), and heparin (2 μg/mL; Sigma). HF19 and HF29 human fibroblast (HF) cells as well as primary GBMs were obtained from Dr Xandra Breakefield (Massachusetts General Hospital). The murine mouse microglia cell line N9 was obtained from Dr Suzanne Hickman (Massachusetts General Hospital) and grown in Roswell Park Memorial Institute medium supplemented with 10% fetal bovine serum, 100U penicillin, and 0.1mg/mL streptomycin. Primary human hepatocytes cells were purchased from ScienCell (Carlsbad, CA). These cells (originally cryopreserved right after purification) were expanded for 1 to 2 passages, plated in 96-well plates, and used in our experiments. Human cortical neurons were at passage less than 5 when tested in our experiment. MCF10A (human mammary epithelial cell line) were grown in mammary epithelial cell growth (MEBM) medium (Lonza, Hopkinton, MA) supplemented with 100ng/mL cholera toxin (Sigma).
Compounds
The drug screen was performed using the Spectrum Collection library (MicroSource, Gaylordsville, CT) on U87 glioma cells expressing the naturally secreted Gaussia luciferase as a viability marker as described (5,9). OBT was purchased from Gaia Chemicals (Gaylordsville, CT). The drug was resuspended in dimethyl sulfoxide (DMSO) at 20mg/mL. The antioxidants N-acetly-L-cysteine (NAC), dithiothreitol, L-glutathione, and catalase were purchased from Sigma-Aldrich. Piperlongumine, CAY10561, and SP600125 were purchased from Cayman Chemical (Ann Arbor, MI).
In Vivo Tumor Models
All animal experiments were conducted under the guidelines and approval of the Massachusetts General Hospital Subcommittee on Research Animal Care. We used female athymic nude mice (aged 6–8 weeks). One million U87 cells stably expressing Fluc and mCherry were mixed with an equal volume of Matrigel basement membrane matrix (BD Biosciences, Franklin Lakes, NJ) and implanted subcutaneously in the flanks of mice. For the intracranial brain tumor model, mice were anesthetized with an intraperitoneal injection of ketamine (100mg/kg) and xylazine (5mg/kg) and mounted on a stereotaxic frame. One hundred thousand U87-Fluc-mCherry or one million U251-Fluc-mCherry cells were injected into the frontal lobe of the brain at the following coordinates: 2mm lateral and 1mm caudal to bregma; depth 2.5mm from dura. OBT was administered intraperitoneally at 5 to 10mg/kg body weight. Before injection, the compound was freshly mixed with phosphate-buffered saline/0.01%Tween80, and a total of 100 µL was injected per mouse. Control groups received an equivalent amount (7.5 µL) of DMSO mixed in phosphate-buffered saline/0.01%Tween80. Injections were repeated daily over a 14-day period for U87 and a 21-day period for the U251 model. For the breast cancer model, MDA-MB231 Br cells expressing Fluc and mCherry were mixed with Matrigel (BD Matrigel, San Diego, CA) (1×10⁶ in 20 µL Matrigel) and injected into the mammary fat pad of nude mice. OBT was administered intaperitoneally in 20% (2-hydroxypropyl)-β-cyclodextrin (Sigma). Tumor volumes were measured using a caliper and calculated according to the following formula: volume = (width)2 × length/2. Mice were monitored daily for signs of distress or systemic toxicity. Mice weights were collected on a weekly basis.
Statistical Analysis
The median inhibition concentration (IC50 ) values were calculated using GraphPad Prism 5.0 (GraphPad Software, Inc, La Jolla, CA) using nonlinear curve fitting. Mice survival data were analyzed using the same software, and statistical significance was determined based on log-rank test. Alternatively, the significance level (Student t test) was calculated using Microsoft Excel spreadsheets. A P value of less than .05 was considered statistically significant. All statistical tests were two-sided. (Additional experimental procedures are described in the Supplementary Methods, available online)
Results
In Vitro Effect of OBT on GBM Cells
After screening for small compounds exhibiting antiglioma activity, we identified the natural product OBT (Figure 1A) as a potent hit. At early time points after adding the compound on U87 cells, a major change in cellular morphology was observed. Cells became round, and many lost their adherence to the cell culture plate (Figure 1B). We validated this compound on three different GBM cell lines—Gli36, U87, and U251—and on three different primary (low passage) GBM cells—GBM8, GBM11/5, VU147—using the Gaussia luciferase (Gluc)–based cell viability assay (5). All cells tested were sensitive to OBT; U87 cells were the most resistant. After 24 hours of treatment with 2.5 µM OBT, a 63% (95% confidence interval [CI] = 59% to 67%) decrease in Gluc activity was observed for U87 cells, an 82% (95% CI= 81% to 84%) decrease was observed for U251 cells, and a 96% to 98% (95% CI = 94% to 99% and 97% to 99%) decrease was observed for the other cells (Figure 1C). The OBT effect on GBM cell viability was also confirmed using a colony-forming assay. A 12-hour treatment with 0.5 µM OBT was sufficient to totally abrogate U87 colony formation (Figure 1D; Supplementary Figure 1A, available online). We also tested this compound on GBM stemlike cells grown as neurospheres. Those cells comprise a CD133-enriched population (8), are highly tumorigenic (10), infiltrate the brain of nude mice similar to human tumors, and are generally more resistant to radiation and chemotherapy (11,12). GBM6 and GBM8 stemlike cells were plated and allowed to form neurospheres before the compound was added. OBT treatment resulted in neurospheres dissociating into single cells and caused extensive cell death, comparable with the one observed in cell lines and primary GBMs (Figure 1, E and F).
Figure 1.

Effect of obtusaquinone (OBT) on glioblastoma cells. A) Chemical structure of OBT. B) Effect of OBT on U87 cells. Cells were treated with 5 µM OBT or dimethyl sulfoxide vehicle control. Note the change in cellular morphology at early time points (15 minutes) after treatment. C) OBT toxicity on Gli36, U87, and U251 glioma cell lines and three primary glioblastoma (GBM) cells all expressing Gluc. Cells were treated with the indicated doses and Gluc activity was measured 24 hours later. Data are presented as percentage Gluc expression in which the control untreated sample is set at 100%. D) OBT effect on U87 long-term growth was assessed through colony-forming assay. Cells at low confluency were treated with OBT for 16 hours and allowed to recover in growth medium in the absence of OBT for 12 days. Colonies were counted and plotted as percent of the control. E) OBT effect on survival of GBM stemlike cells. The cells were allowed to form neural spheres before addition of the compound. Cell viability was measured after 24 hours of treatment. F) Microscopy images showing neurosphere disintegration 24 hours after treatment with 10 µM OBT. The average of experimental triplicates (± SD) is shown in (C–E). Scale bar = 100 µm.
Role of OBT in Apoptosis and DNA Damage
Flow cytometry analysis of OBT-treated U87 cells showed a dramatic increase in Annexin-V staining, an apoptosis marker, as well as double staining for Annexin V and propidium iodide (PI) indicative of cell death (Figure 2A). A 5 µM OBT dose resulted in more than 80% apoptotic/dead cells, confirming the Gluc-viability results described above. Further, a dose-dependent increase in caspase 3/7 activity was observed with a fourfold increase over the control after treatment with 5 µM OBT. A sub-G1 population was clearly detected through cell cycle analysis of OBT-treated samples, further confirming this apoptotic cell death (Supplementary Figure 1B, available online).
Figure 2.

Obtusaquinone (OBT) effect on apoptosis and DNA damage in glioblastoma (GBM). A) U87 cells were treated with OBT at the indicated doses then analyzed for AnnexinV-Cy5 and PI staining by flow cytometry. Shown in the right panel are the averages and SD of two independent experiments. B) U87 cells were treated with OBT for 16 hours followed by caspase 3/7 assay. Data are presented as fold increase as compared with control samples. The average of experimental triplicates (± SD) is shown. C) U87 cells treated for 24 hours with OBT were analyzed by Western blotting using PARP, p53, p53 upregulated modulator of apoptosis (PUMA), and β-actin antibodies. cl. PARP = cleaved PARP. D) U87 cells treated with 5 µM OBT were lysed at different time points and analyzed for phospho and total ERK1/2, phospho and total c-jun, phospho H2AX, p53, PARP, and β-actin for normalization of protein loading. E) U87 cells treated with 5 µM OBT for 6 hours were stained with γ-H2AX. Nuclei were counterstained with Hoechst 33258. Ctrl = control. Scale bar = 100 µm. F) Alkaline comet assay was performed on U87 cells treated with 5 µM OBT for 24 hours. Cometlike tails are clearly visible in OBT treated cells, indicative of DNA-strand breaks. *P < .05 and **P < .01, two-sided Student t test.
We then evaluated DNA damage as a potential trigger of apoptotic cell death. Western blot analysis showed a caspase-mediated cleavage of poly (ADP-ribose) polymerase (PARP) after OBT treatment (Figure 2C). The tumor suppressor p53 is a key sensor and regulator of cellular damage and apoptosis (13). An increase in p53 expression and one of its downstream targets, p53 upregulated modulator of apoptosis (PUMA), was also detected in response to OBT treatment (Figure 2C). DNA double-strand breaks, as determined by the phosphorylation of histone 2AX (γ-H2AX), were also investigated. Nuclear foci of γ-H2AX were visible after 6 hours of OBT treatment, and the protein levels of γ-H2AX were markedly increased over time (Figure 2, D and E). Marked DNA damage was further confirmed by alkaline comet assay on cells treated with OBT (Figure 2F).
To investigate whether p53 expression is needed for OBT-mediated cell death, we disrupted its expression in U87 cell lines (wild-type p53) using viral-mediated repression as well as RNA interference. U87 cells stably expressing the human papilloma virus E6 protein (14) or a p53-targeting short hairpin RNA had undetected levels of p53 proteins when assayed by Western blotting (Supplementary Figure 1C, available online). This p53 repression did not protect cells treated with OBT (Supplementary Figure 1C, available online), as compared with wild-type U87, suggesting a p53-independent mechanism.
Effect of OBT on Oxidative Stress
We determined the intracellular ROS levels after OBT treatment using the chloromethyl derivative of CM-H2DCFDA (5-(and-6)-chloromethyl-2’,7’-dichlorodihydrofluorescein diacetate, acetyl ester). One hour after OBT treatment, a clear increase of ROS levels, ranging from twofold to sevenfold in a dose-dependent fashion, was observed (Figure 3A). When cells were cotreated with antioxidants such as N-acetylcysteine, a potent ROS scavenger, this ROS accumulation was totally reversed (Figure 3A; Supplementary Figure 2A, available online). The ERK pathway is activated by oxidative stress (15). A marked increase in phosphorylation of Erk1/2 was observed after OBT treatment, starting around 30 minutes and peaking at 3 hours, then gradually decreasing in a time-dependent manner (Figure 2D). The c-Jun N-terminal kinase/stress-activated protein kinase was also activated by OBT treatment, as reported through the phosphorylation of c-Jun (Figure 2D).
Figure 3.

Obtusaquinone (OBT) effect on oxidative stress. A) Reactive oxygen species (ROS) quantification. U87 cells were preincubated with CM-H2DCFDA (5 µM) for 30 minutes then treated for 1 hour with OBT in the presence or absence of N-acetly-L-cysteine (NAC) before analysis by flow cytometry. Data are presented as the mean of fluorescence intensity. B) Glutathione (GSH) quantification. U87 cells treated with 2.5 µM OBT for the indicated time points in the presence or absence of NAC (3mM) were lysed, and total GSH levels were measured. C) Levels of GSH and its oxidized form (GSSG) were measured 6 hours after OBT treatment in the presence or absence of NAC. Data are presented as a ratio of GSH/GSSG. D) U87 cells were incubated with NAC, dithiothreitol (DTT, 1mM), L-glutathione (L-Glut, 10mM), or catalase (Cat, 2000U/ml) for 1 hour before OBT treatment (5 µM). Cell viability was measured 24 hours later with CellTiter-Glo assay and expressed as percentage of control. E) Western blot analysis of c-jun and ERK1/2 phosphorylation in U87 cells treated with OBT 2.5 µM in the presence or absence of the c-jun inhibitor SP600125 (50 µM). Cells were preincubated with the inhibitor for 2 hours before OBT treatment. F) U87 cells were pretreated with the c-jun inhibitor SP600125 (50 µM) or the ERK1/2 inhibitor CAY10561 (10 µM) then treated with OBT. Cell viability was measured 24 hours later. Ctrl = control. All results are shown as the average of biological triplicates ± SD. *P < .05 and **P < .01, two-sided Student t test.
Glutathione is a major antioxidant with pivotal role in maintaining the cellular redox state. We looked at levels of total glutathione (GSH) and its oxidized form (GSSG) after OBT treatment. In U87 cells treated with 2.5 µM OBT, a 25% and 40% decrease in GSH levels were observed after 3 hours and 6 hours, respectively (Figure 3B). This GSH depletion was totally reversed when NAC was added (Figure 3B). GSH depletion was also detected in U251 cells after 1 hour of treatment with OBT at 10 µM (Supplementary Figure 2B, available online). A major decrease in GSH/GSSG ratio indicative of the redox imbalance was also observed (Figure 3C). To check whether OBT kills through ROS accumulation, we measured cell viability in U87 cells treated with OBT in combination with NAC as well as other antioxidants—dithiothreitol, L-glutathione, and catalase. As expected, cell viability was reduced after adding OBT, whereas cotreatment (and pretreatment) with these antioxidants almost fully protected against the OBT-induced cell death (Figure 3D; Supplementary Figure 2C, available online). This NAC protection was also observed in a colony-forming assay (Supplementary Figure 1A, available online).
Although the c-jun inhibitor SP600125 prevented OBT-induced c-jun phosphorylation (Figure 3E), it did not affect cell viability (Figure 3F). Neither did the ERK inhibitor CAY10561. These data suggest that the ERK and c-jun pathways activation occurs as a bystander of the OBT-induced oxidative stress with no effect on cell fate.
Finally we compared ROS generation and GSH depletion in GBM cells treated with OBT and piperlongumine (PL), a recently described cancer-selective, ROS-inducing compound (16). ROS levels were statistically significantly higher (P = .04) in U87 cells treated with OBT for 1 hour compared with PL-treated cells (Supplementary Figure 2D, available online). OBT, as compared with PL, also showed higher potency in killing GBM cells (Supplementary Figure 2E, available online).
In Vivo activity of OBT in a Subcutaneous GBM Mouse Model
We used nude mice xenografted with U87 cells to test the OBT antitumor effect. In our first mouse experiment, U87 cells expressing firefly luciferase (U87-Fluc) were implanted subcutaneously and allowed to form tumors. Fluc activity was used to monitor tumor growth overtime (Figure 4, A–D). After seven consecutive daily injections of OBT, we observed an average of 10% decrease in total body weight in mice treated with OBT (Figure 4D). Mice were allowed to recover for 2 days, after which they had regained their initial weight and OBT injections were resumed. By day 35, the signal in the control group was twofold higher than in the OBT group (Figure 4, A and B). Luciferase imaging was stopped after 5 weeks posttreatment to avoid any erroneous imaging signal due to large or necrotic tumors (17). Eight weeks posttreatment, mice were sacrificed and tumors were isolated for size comparison (Figure 4C). A twofold increase in caspase 3/7 activities was detected in tumors from the OBT group compared with control, confirming the in vitro data (Figure 4E).
Figure 4.

Effect of obtusaquinone (OBT) on subcutaneous glioblastoma (GBM) tumors in vivo. U87 cells expressing Fluc were implanted subcutaneously in nude mice. One week later, mice were intraperitoneally injected once a day over 14 days with either dimethyl sulfoxide (DMSO) vehicle (control [Ctrl]) or OBT (n = 7 for each group). A) Fluc bioluminescence imaging was performed once a week. Representative bioluminescent images overlayed to bright field images from mice imaged at day 7 and day 35 after tumor implantation. B) Photon count in the tumor was calculated and presented as the average radiance ± SD. C) Nine weeks after tumor implantation, mice were sacrificed and tumors were removed. Four representative micrographs of subcutaneous tumors per group are shown. D) Mice weight (g) was measured on a weekly basis after treatment. E) Mice with U87 subcutaneous tumor xenografts received 5 daily injections of DMSO or OBT. Tumors were then removed and dissociated, and lysates were analyzed using caspase 3/7-Glo assay. Data are presented as fold increase as compared with the control group. *P < .05, two-sided Student t test.
In Vivo Activity of OBT in an Intracranial GBM Mouse Model
We next tested OBT on brain tumors using U87 (wild-type p53) and U251 (mutant p53) orthotropic mouse models. U87-Fluc cells were implanted intracranially, and mice were imaged once a week to follow tumor progression using bioluminescence imaging. The treated group showed a statistically significant decrease in tumor growth compared with the control group. At day 35 postimplantation, the average Fluc signal from brain tumors was 5 times higher (average radiance OBT vs control: 3.69E + 08 vs 1.91E + 09, 95% CI = 8.18E + 08 to 2.27E + 09, P = .008) (Figure 5A). The difference in tumor growth between the two groups was further confirmed by hematoxylin and eosin staining of brain sections where a clear difference in tumor size could be observed (Figure 5B). We then assessed the OBT therapeutic effect on mice survival. The treated group showed a moderate but statistically significant increase in lifespan, with a median survival of 36 days for the control group and a median survival of 40 days for the treated group (median survival ratio OBT vs control: 1.16, 95% CI of ratio = 0.84 to 1.4, P = .04) (Figure 5C). OBT effect on mice survival was more pronounced in the U251-Fluc orthotropic model, where the median survival was 69 for the control group and 95 for the treated group (median survival ratio OBT vs control: 1.367, 95% CI of ratio = 1.031 to 1.367, P = .008) (Figure 5D).
Figure 5.

Effect of obtusaquinone (OBT) on intracranial glioblastoma (GBM) tumors in vivo. U87 cells expressing Fluc were implanted intracranially in nude mice. One week later, mice were intraperitoneally injected once a day over 14 days with dimethyl sulfoxide (DMSO) (control [Ctrl]) or OBT (7.5mg/kg body weight) (n = 8 per group). A) Mice were imaged weekly, and the Fluc signal was quantified over 5 weeks after implantation. *P < .05, two-sided Student t test. B) At day 21 after implantation, two mice from each group were killed; brains were isolated, sectioned, and analyzed by hematoxylin and eosin staining. Micrographs from one representative mouse per group are shown. Scale bar = 500 µm. C) Kaplan–Meier survival curve for intracranial U87 xenografted mice (n = 6 for control and n = 7 for OBT) with P = .04 (two-sided log-rank test). D) Kaplan–Meier survival curve for intracranial U251 xenografted mice treated with OBT for 21 days (n = 6 for control and n = 8 for OBT) with P = .008 (two-sided log-rank test). The number of mice at risk at any given time point are indicated below the Kaplan–Meir curves in (C and D).
OBT Effect on Normal Cells and Different Cancer Cell Lines
We then tested our compound on 12 additional cancer cell lines representing 10 different cancer types and six different normal cell lines. Cell viability was assayed 24-hours posttreatment with different doses of OBT. Over 70% decrease in cell viability was seen on all cancer cell lines tested with an average IC50 value of approximately 2.2 µM (Figure 6A; Supplementary Table 1, available online). This decrease in cell viability was much lower on all normal cell lines and human primary cells, with an IC50 greater than 10 µM (Figure 6A; Supplementary Figure 3A, available online). Further, OBT treatment failed to induce any statistically significant (P = 0.1–0.5) increase in caspase 3/7 activities in the two different HF cells but not in the U251 cells (P = 0.002–0.004) (Figure 6B). Also we could not detect any increase in ROS levels after 5 or 10 µM of OBT treatment for 1 hour on HF normal cells (Figure 6C). The addition of NAC protected all cancer cell lines tested from OBT-induced cell death (Supplementary Figure 3B, available online). This suggests that oxidative stress is a universal mechanism through which OBT targets cancer cells.
Figure 6.

Obtusaquinone (OBT) tumor specificity. A) A panel of 12 different cancer cell lines and normal control cells were transduced to stably express Gluc then treated with OBT. Aliquots of the conditioned medium were assayed for Gluc activity after 24 hours. Human cortical neuron (HCN) and human hepatocyte (HH) viability was measured using CellTiter-Glo assay. The experiment was performed in triplicates. Error bars represent the SD. B) HF27 and HF29 normal fibroblast cells and U251 glioma cells were treated with OBT, and caspase 3/7 activity was measured after 24 hours. C) Reactive oxygen species (ROS) quantification in HF27. Cells were preincubated with CM-H2DCFDA (5 µM) for 30 minutes, then treated for 1 hour with OBT before analysis by flow cytometry. Data are presented as the mean of fluorescence intensity. Tumor cells are represented with solid lines; normal cells are represented with dashed lines. Ctrl = control.
In Vitro and In Vivo Effect of OBT on Breast Cancer Model
We also evaluated the effect of OBT in a breast cancer model. OBT efficiently targeted MDA-MB231 Br cells with an IC50 of 1.8 µM after 24 hours of treatment (Figure 6A). OBT induced caspase 3/7 activation, PARP cleavage, and activation of ERK and c-jun pathways (Figure 7, A–C). Treated cells exhibited a decrease in total GSH levels (Figure 7D) and a threefold increase in GSSG levels (Figure 7E). This increase in oxidized glutathione was abrogated when cells were cotreated with dithiothreitol (Figure 7E). As expected, cell viability was rescued with NAC cotreatment (Figure 7F). Finally, we validated the therapeutic effect of OBT on Fluc expressing- MDA-MB231 Br cells implanted in the mammary fat pad of nude mice. A clear decay in Fluc imaging signal signal was visible at the last treatment time point (week 4 after implantation) (Figure 7G). The experiment was stopped at day 56 when tumors in the control group became ulcerated/necrotic. At this time point, Fluc signal in the OBT-treated group was lower than the initial tumor signal at the first treatment time point (Figure 7G). Three of six mice in the OBT-treated group showed undetectable Fluc activity. Further, only one mouse in the OBT-treated group showed a visible tumor (Supplementary Figure 4A, available online). Tumor growth was also monitored by caliper measurement throughout the experiment to confirm Fluc bioluminescence imaging results (Supplementary Figure 4B, available online). This in vivo experiment was repeated three times with six mice per group per experiment, and similar results were obtained.
Figure 7.
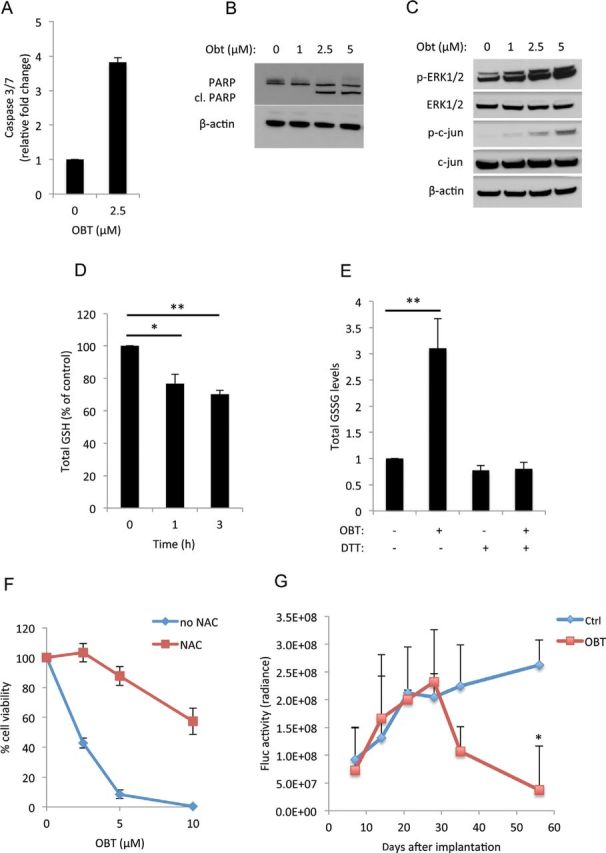
Obtusaquinone (OBT) effect on MDA-MB231 Br breast cancer cell model. A–C) MDA-MB231 Br cells treated with OBT for 24 hours before measuring caspase 3/7 activity (A) and the expression of PARP and its cleaved form (cl. PARP) (B) or treated for 1 hour and analyzed for the expression of phospho and total ERK1/2 and phospho and total c-jun. β-Actin for normalization of protein loading (C). D) Gluthathione (GSH) quantification; cells treated with 2.5 µM OBT for the indicated time points were lysed, and the total GSH levels were measured. E) Quantification of the oxided form of GSH (GSSG); cells treated with 2.5 µM OBT in the presence or absence of dithiothreitol (DTT) (1mM) for the 6 hours before GSSG levels were measured F) Cell viability after 24 hours of treatment with OBT in the presence of absence of N-acetly-L-cysteine (NAC) (3mM). All experiments were performed in triplicates. Error bars represent SD. G) MDA-MB231 Br cells expressing Fluc were injected into the mammary fat pad of nude mice and allowed to form tumors. Mice were separated into control (Ctrl) group (n = 6) and OBT group (n = 6) and treated as described above. Bioluminescence imaging signals were calculated and presented as the average radiance ± SD. *P < .05 and **P < .01 two-sided Student t test.
In Vivo Toxicity Analysis of OBT
Systemic toxicity studies were performed in mice after intraperitoneal administration of OBT. Total blood count did not reveal any statistically significant difference in mice treated with four daily doses of DMSO control or OBT (Supplementary Table 2, available online). Moreover blood chemistry analysis after 4 or 14 days of treatment did not show any liver or kidney toxicity (Supplementary Table 3, available online). A substantial increase in glucose blood levels (1.55-fold to 1.68-fold) was observed in mice treated with OBT at both time points (Supplementary Table 3, available online). After four daily injections of DMSO or OBT, mice were sacrificed and organs were collected for hematoxylin and eosin staining. Stained tissues from the liver, kidney, spleen, and lungs did not show any revealing signs of toxicity (Supplementary Figure 5, available online). A long-term follow-up (up to 6 months) of mice treated with 21 daily doses of OBT (7.5mg/kg) did not reveal any signs of distress, abnormal growth, weight loss, or any behavioral change.
Discussion
Mounting evidence suggests higher levels of oxidative stress in tumor cells as compared to normal cells (4). Furthermore, higher levels of ROS have been reported to promote tumor aggressiveness (18–20). Several ROS-inducing agents and antioxidant inhibitors are currently in clinical trials for different cancer types (4). The natural compound identified in this study efficiently killed GBM cell lines, primary cells, and glioma stemlike cells. GBM cells treated with OBT presented clear signs of apoptosis and DNA damage. Treated cells showed a stabilization of the p53 protein along with a functional increase in one of the p53-regulated proapoptotic genes, PUMA. More important, OBT-induced cell death was independent of p53. Cancer cells mutant for p53, such as U251, responded to OBT treatment and showed better therapeutic outcome notably in intracranial mouse models. Because more than 50% of tumor types have a p53 mutation (21) and are generally more resistant to DNA damage (22), likely because of the antiapoptotic properties of p53 (23), such p53-irrelevant killing mechanism is desirable. In addition to p53 activation, oxidative stress, among other stress-inducing stimuli, can also activate a complex signaling network, such as the mitogen-activated protein kinase, which in turn can regulate p53 activity (24). A strong activation of two components of this pathway, ERK1/2 and c-jun, was detected at early time points after treatment. This DNA damage response and activation of cellular stress signaling pathway is most likely because of the increase in ROS levels. We further confirmed that this ROS activation is the main cause of cell death induced by OBT because cotreatment with antioxidants such as NAC conferred an almost complete protection against this compound. This activation of oxidative stress response seems to be common in different cancer cell lines tested. More important, OBT seemed to be more selective toward cancer cells and showed less toxicity on normal cells. Recently, Raj et al. identified a new small molecule PL with targets cancer cells with high selectivity and great therapeutic efficiency both in culture and in different animal models (16). Under our experimental conditions, OBT induced higher ROS levels in GBM cell lines and showed more potency in killing these cells, as compared with PL.
Our study had a few limitations. Despite the therapeutic advantage for OBT, and although it showed a marked antitumor effect in different tumor models and extended survival in two different intracranial glioma xenografts, there is still a large margin for improvement of the compound’s potency in vivo. One major hurdle for animal experiments was the poor solubility of this compound. Improving the solubility and understanding the pharmacodynamics of OBT are crucial steps for future validation studies of the therapeutic benefit of this molecule. Despite the solubility issue, OBT was able to penetrate the brain because mice treated with the compound showed longer survival trends. Another limitation was the reversible weight loss observed with mice treated with 10mg/kg of OBT and the increase in glucose blood levels, although no major adverse effects could be detected upon intraperitoneal administration of the compound up to 21 consecutive days. The effect of the compound on glucose blood levels warrants more attention and investigation. Naive nude mice did not present any signs of toxicity. More thorough studies on immune competent mice need to be performed to assess the effect of OBT on the immune system. Finally, the pharmacokinetics and pharmacodynamics of the compound when administered through different routes (oral, intravenous, intraperitoneal) should be investigated.
It is likely that the cancer toxicity of OBT is not simply because of ROS generation but also because of other yet unknown mechanisms of action or the unique properties of this molecule. Such mechanism has been recently suggested for PL (25). The potent cytotoxicity of OBT toward a wide range of cancer cell lines and its efficacy on different murine tumor models deserves further attention to validate this natural compound as a potential anticancer candidate. A deeper understanding of the aforementioned compound at the molecular levels would offer more tailored treatment regimens and possibly allow its combination with other conventional therapeutics to achieve a maximum benefit.
Funding
This work was supported by grants from National Institutes of Health/National Institute of Neurological Disorders and Stroke (1R21NS061051, P30NS045776, and 1R01NS064983 [to BAT]) and the American Brain Tumor Association (to CEB).
Supplementary Material
The study sponsors had no role in the design of the study; the collection, analysis, and interpretation of the data; the writing of the manuscript; and the decision to submit the manuscript for publication.
We would like to thank Professor Kent Lewandrowski, Department of Pathology, Massachusetts General Hospital, for analysis of hematoxylin and eosin slides. We are grateful to Drs Xandra Breakefield, Patricia Steeg, Suzanne Hickman, and Kristan Van Der Vos for providing different cell types and Drs Samuel Rabkins and Hiroshi Wakimoto for providing the GBM6 and GBM8 cells. We are also thankful to Miss Jorien Koelen for technical help.
References
- 1. Papadopoulos N, Kinzler KW, Vogelstein B. The role of companion diagnostics in the development and use of mutation-targeted cancer therapies. Nat Biotechnol. 2006;24(8):985–995. [DOI] [PubMed] [Google Scholar]
- 2. Szatrowski TP, Nathan CF. Production of large amounts of hydrogen peroxide by human tumor cells. Cancer Res. 1991;51(3):794–798. [PubMed] [Google Scholar]
- 3. Toyokuni S, Okamoto K, Yodoi J, et al. Persistent oxidative stress in cancer. FEBS Lett. 1995;358(1):1–3. [DOI] [PubMed] [Google Scholar]
- 4. Trachootham D, Alexandre J, Huang P. Targeting cancer cells by ROS-mediated mechanisms: a radical therapeutic approach?. Nat Rev Drug Discov. 2009;8(7):579–591. [DOI] [PubMed] [Google Scholar]
- 5. Badr CE, Wurdinger T, Tannous BA. Functional drug screening assay reveals potential glioma therapeutics. Assay Drug Dev Technol. 2011;9(3):281–289. [DOI] [PMC free article] [PubMed] [Google Scholar]
- 6. Gregson M, Ollis WD, Redman BT, Sutherland IO, Dietrichs HH, Gottlieb OR. Obtusastyrene and obtustyrene, cinnamylphenols from Dalbergia retusa . Phytochemistry. 1978;17(8):1395–1400. [Google Scholar]
- 7. Eslyn WK, Rultman JD, Jurd L. Wood decay inhibition by tropical hardwood extractives and related compounds. Phytopathology. 1981;71(5):521–524. [Google Scholar]
- 8. Wakimoto H, Kesari S, Farrell CJ, et al. Human glioblastoma-derived cancer stem cells: establishment of invasive glioma models and treatment with oncolytic herpes simplex virus vectors. Cancer Res. 2009;69(8):3472–3481. [DOI] [PMC free article] [PubMed] [Google Scholar]
- 9. Badr CE, Wurdinger T, Nilsson J, et al. Lanatoside C sensitizes glioblastoma cells to tumor necrosis factor-related apoptosis-inducing ligand and induces an alternative cell death pathway. Neuro Oncol. 2011;13(11):1213–1224. [DOI] [PMC free article] [PubMed] [Google Scholar]
- 10. Singh SK, Hawkins C, Clarke ID, et al. Identification of human brain tumour initiating cells. Nature. 2004;432(7015):396–401. [DOI] [PubMed] [Google Scholar]
- 11. Bao S, Wu Q, McLendon RE, et al. Glioma stem cells promote radioresistance by preferential activation of the DNA damage response. Nature. 2006;444(7120):756–760. [DOI] [PubMed] [Google Scholar]
- 12. Liu G, Yuan X, Zeng Z, et al. Analysis of gene expression and chemoresistance of CD133+ cancer stem cells in glioblastoma. Mol Cancer. 2006;5(1):67 [DOI] [PMC free article] [PubMed] [Google Scholar]
- 13. Vurusaner B, Poli G, Basaga H. Tumor suppressor genes and ROS: complex networks of interactions. Free Radic Biol Med. 2012;52(1):7–18. [DOI] [PubMed] [Google Scholar]
- 14. Mantovani F, Banks L. The human papillomavirus E6 protein and its contribution to malignant progression. Oncogene. 2001;20(54):7874–7887. [DOI] [PubMed] [Google Scholar]
- 15. Martindale JL, Holbrook NJ. Cellular response to oxidative stress: signaling for suicide and survival. J Cell Physiol. 2002;192(1):1–15. [DOI] [PubMed] [Google Scholar]
- 16. Raj L, Ide T, Gurkar AU, et al. Selective killing of cancer cells by a small molecule targeting the stress response to ROS. Nature. 2011;475(7355):231–234. [DOI] [PMC free article] [PubMed] [Google Scholar] [Retracted]
- 17. Badr CE, Tannous BA. Bioluminescence imaging: progress and applications. Trends Biotechnol. 2011;29(12):624–633. [DOI] [PMC free article] [PubMed] [Google Scholar]
- 18. Chaiswing L, Bourdeau-Heller JM, Zhong W, et al. Characterization of redox state of two human prostate carcinoma cell lines with different degrees of aggressiveness. Free Radic Biol Med. 2007;43(2):202–215. [DOI] [PubMed] [Google Scholar]
- 19. Kumar B, Koul S, Khandrika L, et al. Oxidative stress is inherent in prostate cancer cells and is required for aggressive phenotype. Cancer Res. 2008;68(6):1777–1785. [DOI] [PubMed] [Google Scholar]
- 20. Patel BP, Rawal UM, Dave TK, et al. Lipid peroxidation, total antioxidant status, and total thiol levels predict overall survival in patients with oral squamous cell carcinoma. Integr Cancer Ther. 2007;6(4):365–372. [DOI] [PubMed] [Google Scholar]
- 21. Vogelstein B, Lane D, Levine AJ. Surfing the p53 network. Nature. 2000;408(6810):307–310. [DOI] [PubMed] [Google Scholar]
- 22. Peller S. Clinical implications of p53: effect on prognosis, tumor progression and chemotherapy response. Semin Cancer Biol. 1998;8(5):379–387. [DOI] [PubMed] [Google Scholar]
- 23. Janicke RU, Sohn D, Schulze-Osthoff K. The dark side of a tumor suppressor: anti-apoptotic p53. Cell Death Differ. 2008;15(6):959–976. [DOI] [PubMed] [Google Scholar]
- 24. Wu GS. The functional interactions between the p53 and MAPK signaling pathways. Cancer Biol Ther. 2004;3(2):156–161. [DOI] [PubMed] [Google Scholar]
- 25. Adams DJ, Dai M, Pellegrino G, et al. Synthesis, cellular evaluation, and mechanism of action of piperlongumine analogs. Proc Natl Acad Sci U S A. 2012;109(38):15115–15120. [DOI] [PMC free article] [PubMed] [Google Scholar]
Associated Data
This section collects any data citations, data availability statements, or supplementary materials included in this article.