Abstract
Purpose
Implantation of intraocular devices may become critical as they decrease in size in the future. Therefore, it is desirable to evaluate the relationship between radial location and Schwalbe’s line (smooth zone) by examining its width with scanning electron microscopy (SEM) and to correlate this with observations by optical coherence tomography (OCT).
Methods
Full corneoscleral rings were obtained from twenty-six formalin-fixed human phakic donor eyes. SEM of each eye yielded a complete montage of the smooth zone, from which the area was measured, and width was determined in each quadrant. In three different eyes, time domain anterior segment OCT (Visante, Carl Zeiss Meditec Inc., Dublin, CA, USA) and spectral domain OCT (Cirrus 4.0, Carl Zeiss Meditec Inc., Dublin, CA, USA) were used to further characterize Schwalbe’s line.
Results
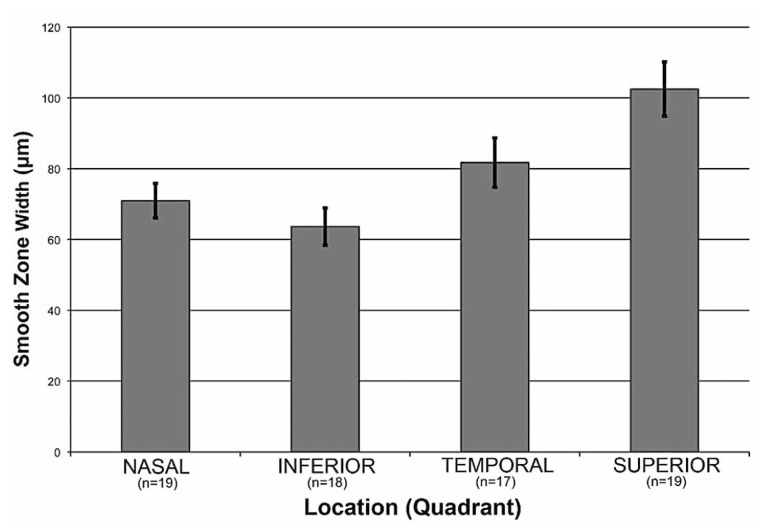
The overall smooth zone width was 79±22 µm, (n=15) ranging from 43 to 115 µm. The superior quadrant (103±8 µm, n=19), demonstrated significantly wider smooth zone than both the nasal (71±5 µm, n=19, P<0.001), and inferior (64±5 µm, n=18, P<0.0001) quadrants but not the temporal quadrant (81±7 µm, n=17, P>0.05). SEM findings of the smooth zone were correlated with visualization of Schwalbe’s line by Cirrus and Visante OCT imaging.
Conclusion
The smooth zone appears widest superiorly and thinnest inferonasally, suggesting that as glaucoma surgical devices become smaller, their placement could be argeted clinically by using OCT with preference to the superior quadrant, to minimize damage to the corneal endothelium.
Keywords: Scanning Electron Microscopy, Schwalbe’s Line, Optical Coherence Tomography, Corneal Endothelial Cells, Anatomy
INTRODUCTION
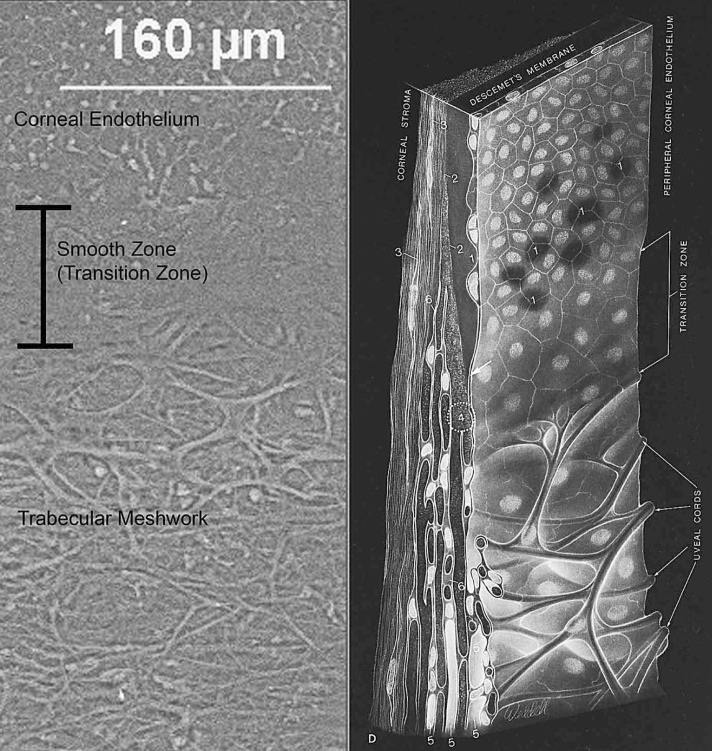
Schwalbe’s line (SL) is often defined as the posterior limbal zone bordering the cornea where Descemet’s membrane (DM) terminates; this feature is visible as a smooth zone when examined by scanning electron microscopy (SEM).1 Herein, we investigate and discuss the width of SL as it may relate to the surrounding anatomy for surgical intervention and implantation as devices become smaller.
In the literature, SL is reported to contain stem cells with regenerative capacity to replace trabecular endothelial cells and possibly corneal endothelial cells.2 SL is part of the posterior limbal zone, an important surgical landmark since tube shunts and aqueous bypass shunts are placed in this region and small differences in device placement can lead to either iris and/ or corneal endothelial cell contact causing complications.
Surgical techniques for implantation of glaucoma devices most often call for entrance through the superotemporal quadrant for ease of implantation rather than anatomical considerations.3 Given its potential variation, one goal of this study was to establish whether the superotemporal recommendation for interventions in glaucoma treatment is confirmed by the anatomical width of the smooth zone (Schwalbe’s line).
Placement of trabecular shunts provides an effective means for treating glaucoma, but often at the expense of adjacent corneal endothelial integrity.4 Given its location between the cornea and the trabecular meshwork, characterizing SL anatomically is essential for understanding such surgical consequences. Knowledge of normal variations in width may provide important clues for surgeons in determining the most suitable location for injection and device placement with least complications. Ideally, the smooth zone should be as wide as possible to maximally accommodate the implant with minimal interference with the surrounding tissues and the delicate corneal endothelium.
We hypothesize that SL width differs throughout its circumferential profile in the eye, given the elliptical qualities of the globe, cornea, and other gross anatomical relationships.5 Examination by SEM and histopathology may reveal differences in width based on quadrants of the corneoscleral ring.
The density of corneal endothelial cells, measured clinically by specular microscopy, is known to decrease significantly with age, starting at age sixty.6 Decreased endothelial cell density may be associated with a change in SL width. The recent discovery of stem cells in the limbal corneal endothelium2 suggests a potentially dynamic border between SL and the cornea which diminishes with age.
Since clinical evaluation of this area is frequently performed using optical coherence tomography (OCT), it is important to correlate the anatomy of SL by SEM with histopathology and OCT. Considering demonstration of SL by spectral domain OCT (SD-OCT) in previous studies8-12, we include the results of our pilot study comparing visualization of SL by SEM with two different OCT imaging devices.
METHODS
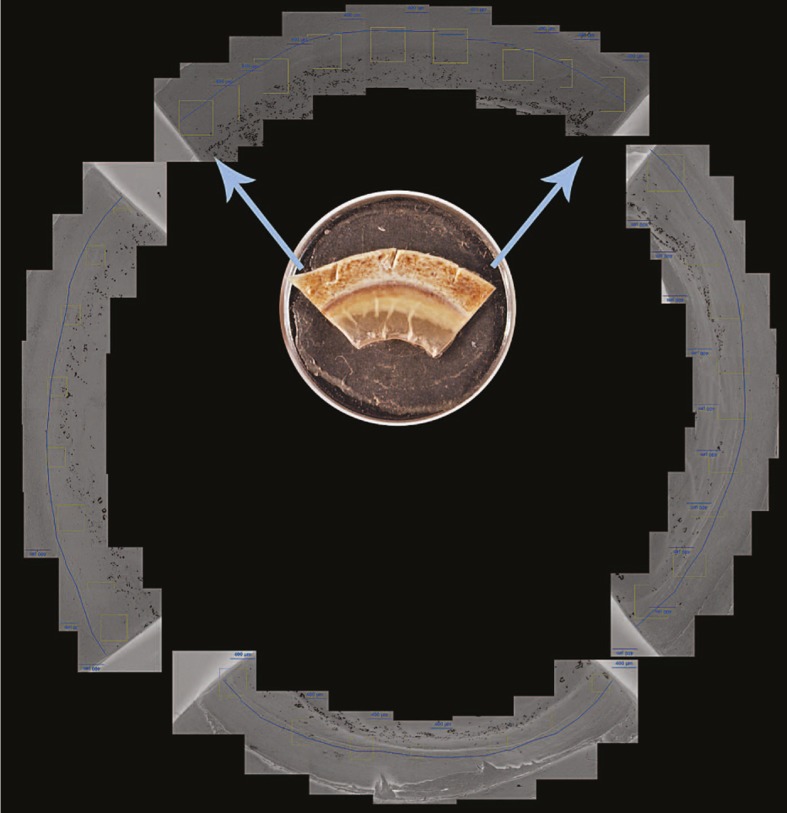
Twenty-six phakic human donor eyes from thirteen patients were obtained pre-fixed in formalin solution from the Central New York Eye Bank and stored at ambient temperature. Eyes from 54 to 88 year-old donors were assessed. Younger eyes were not available. All eyes were negative for posterior embryotoxon when examined under a dissecting microscope at high power. Full corneoscleral rings were removed, cut into quadrants, and processed with a standard alcohol gradient, followed by drying from acetone. The donor rings were then mounted onto aluminum stubs using double sticky adhesive (Fig. 1). Imaging was performed with an Aspex Personal Scanning Electron Microscope (FEI Corporation, Delmont, PA, USA) using the variable pressure mode to allow imaging of non-conductive samples (Fig. 2).
Figure 1.
Example of full montage used in profiling the smooth zone for each eye, with a representative quadrant specimen (inset) on a 0.5-inch stub.
Figure 2.
Scanning electron micrograph (left image) of Schwalbe’s line (smooth zone) bordered by the corneal endothelium anteriorly and trabecular meshwork posteriorly. Sketch (right image) demonstrates cardinal features of the area, referred to as a “transition zone” in 1971. Illustration reproduced with permission from Elsevier5.
Each corneoscleral ring was marked with a notch as a reference point at the most superior, i.e. 12 o’clock position, and documented as left or right. Approximately seven to twelve images at 50x magnification were taken per cut quadrant, depending on specimen size, and overlaid to create each quadrant’s montage. Adobe Photoshop CS5 Extended software (Adobe, San Jose, CA, USA) was used to combine scanning electron micrographs into full circumferential profiles of SL, followed by measuring the areas with ImageJ software (US National Institute of Health, Bethesda, MD, USA). The area measured as smooth zone was defined anteriorly at the border of polygonal-shaped corneal endothelium, and posteriorly by the insertion of uveal bands into the trabecular meshwork.1 Data collection involved highlighting and measuring the area of the smooth zone in each montage every 400 µm of its entire circumference. Likewise, average smooth zone width for each 400 µm segment was then calculated by dividing the measured area by 400 µm. Measurements were conducted by a single examiner (MPB). Quantitative and statistical analysis was performed using Microsoft Excel 2008 (Microsoft Corp., Redmond, WA, USA), as well as both Systat Software SigmaStat 3.10: 2004 and SigmaPlot 9.0: 2004 (San Jose, CA, USA). Intraobserver measurement reproducibility was assessed in a subset of three eyes (12 quadrants).
Out of the original twenty-six specimens, some were not suitable for analysis due to preparation artifacts, resulting in fifteen complete circumferential montages, as well as from 0 to 3 usable quadrants from the other eleven eyes. Quadrants were excluded if the smooth zone was found to be immeasurable or compromised at any point along the quadrant’s span. Measurements from all uncompromised quadrants were used in the comparison of smooth zone width based on quadrants. To test whether inclusion of incompletely circumferential samples altered the results of the analyses, we compared average quadrantic smooth zone width including all measurable quadrant samples (n=1714) with only those from quadrants from completely circumferential samples (n=15). Histopathology with immunohistochemistry for pancytokeratin, CD34, CD68, and ki67 of rehydrated quadrants or adjacent tissue was also studied in five eyes.
Cirrus OCT in two different eye bank eyes and Visante OCT in another eye bank eye were used to show the presumed location of SL, and then correlated with SEM. A cadaver eye was placed on a mount and the angle was visualized with these OCT instruments. A 6-0 polymer suture fitting within the shaft of a 27G needle was passed through the cornea to the anterior chamber angle at the inflection point (change in curvature believed to be SL). The marking suture was imaged after the needle was removed from the eye. The cadaver eyes were then processed as above with standard alcohol gradient, followed by drying from acetone. Imaging was then performed using SEM to visualize the location of the suture.
RESULTS
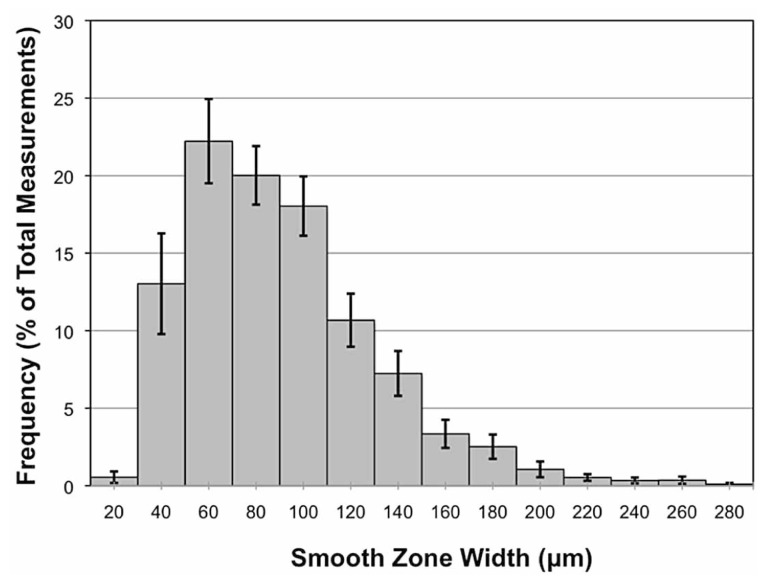
Smooth zone width in eyes with fully measurable 360-degree profiles (n=15) was 79±22 µm. The distribution of individual measurements was highly variable and demonstrated a rightward skew (Fig. 3).
Figure 3.
Overall frequency distribution shows a rightward skew, when plotted as a percentage of total measurements, versus smooth zone width in microns, among all eyes with complete circumferential profiles (n=15). Each value corresponds to mean ± standard error.
Comparison of smooth zone widths from equal-sized quadrants are analyzed and plotted in Figure 4. There were significant differences in smooth zone width among the four quadrants (one-way ANOVA, P<0.001). Specifically, pair-wise multiple comparisons using the Holm-Sidak method revealed larger smooth zones in the superior quadrants 103±8 µm (n=19) than nasal (71±5 µm, n=19, P=0.001) and inferior (64±5 µm, n=18, P=0.0001) quadrants, but not the temporal quadrant (81±7 µm, n=17, P>0.05). These comparisons were also significant when only quadrants from eyes with complete circumferential profiles were included (n=15).
Figure 4.
The smooth zone is wider superiorly than both nasally (p<0.001) and inferiorly (p <0.0001). Smooth zone width in microns is shown as a function of four quadrants: nasal (n=19), inferior (n=18), temporal (n=17), and superior (n=19). Each value represents mean ± standard error.
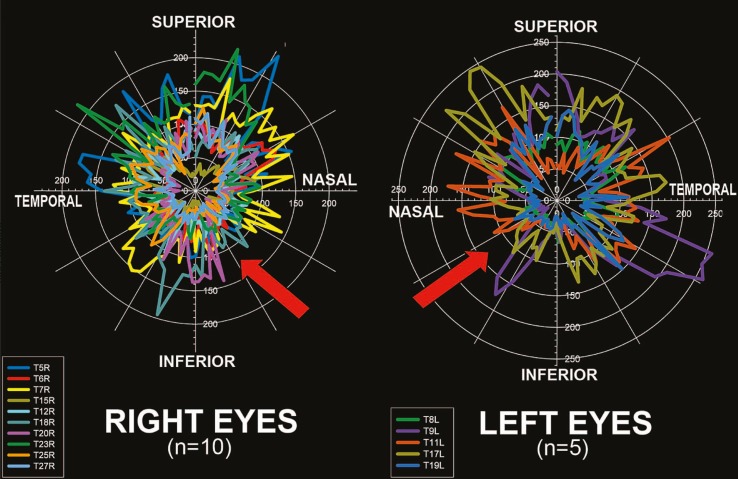
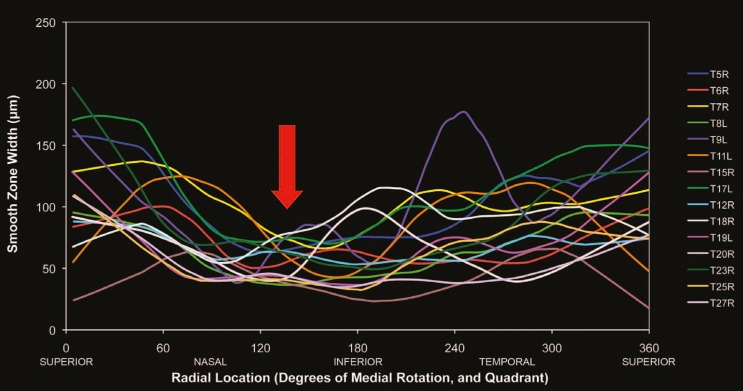
Circumferential profiling of the smooth zone revealed that its width varies along its circumference (Fig. 5). Consistent with the quadrant data shown previously, the thinnest smooth zone was found in the inferonasal region in both right and left eyes. A linear locally weighted scatter-plot smoothing (LOESS) transformation of data further demonstrated that the inferonasal area had the thinnest smooth zone (Fig. 6). The widest smooth zone was present superiorly.
Figure 5.
The inferonasal region has the thinnest smooth zone (red arrows) both in right (n=10) and left (n=5) eyes. Smooth zone width in microns is plotted against radial location in both degrees and by quadrant.
Figure 6.
The smooth zone is thinnest inferonasally (red arrow) in both right and left eyes (n=15) as shown by this locally weighted scatter-plot smoothing (LOESS).
In five eyes chosen for further study, there was no identifiable SL by histopathology or immunohistochemistry.
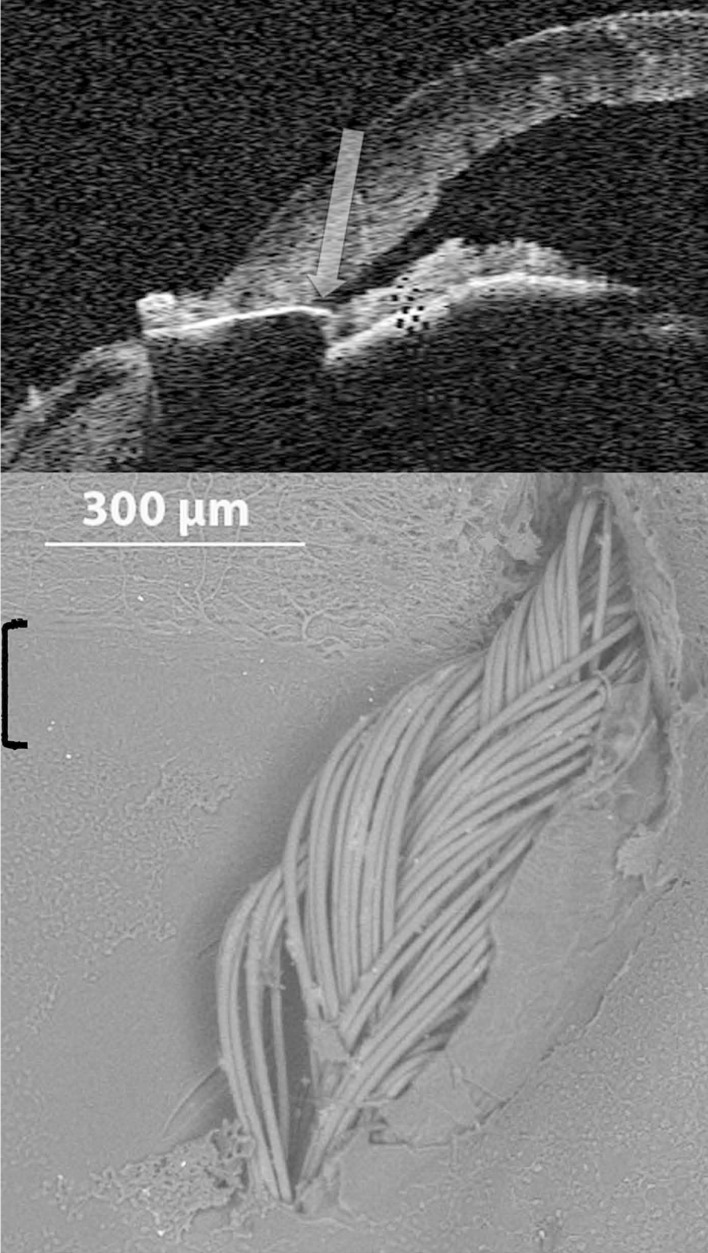
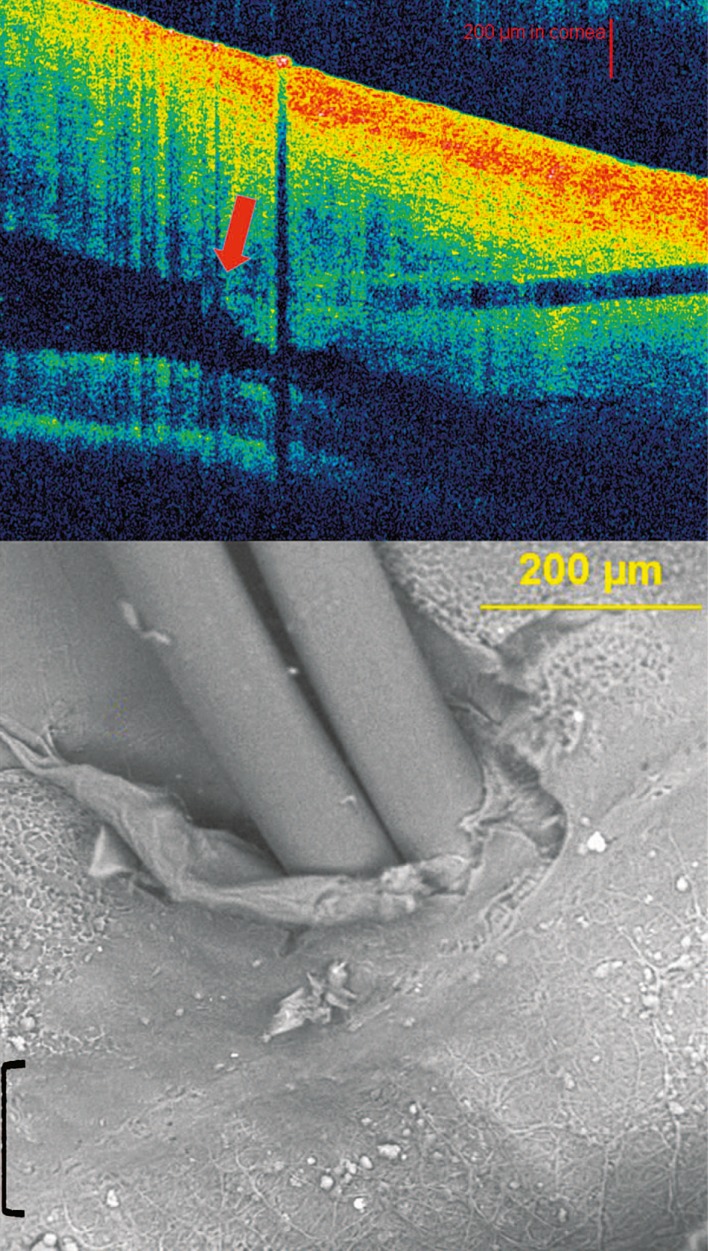
Clinical correlations using human ex vivo eyes, to our knowledge, have not been previously reported. SL identified by Visante OCT correlates closely with SEM imaging (Fig. 7). The suture entrance and exit sites proximally flank the anterior and posterior aspects of the underlying smooth zone, respectively. Cirrus OCT correlation of SL with SEM also demonstrates suture placement in the smooth zone (Fig. 8). Entire angle structures were easier to visualize with the Visante OCT. However, SL anteriorly had greater visibility by Cirrus OCT, despite poor resolution of posterior angle structures. Therefore, SL (inflection point), found with both the Visante and Cirrus anterior segment OCT instruments, corresponds precisely with the smooth zone as detected by SEM.
Figure 7.
Correlation between Schwalbe’s line by Visante optical coherence tomography (OCT) and scanning electron microscopy (SEM). Top: Identification of SL with OCT shows needle penetration and suture placement at the inflection point (arrow). Bottom: SEM image of smooth zone (bracket) corresponds precisely to SL as identified above. [SL, Schwalbe’s line]
Figure 8.
Correlation between Schwalbe’s line by Cirrus optical coherence tomography (OCT) and scanning electron microscopy (SEM). Top: Identification of SL by Cirrus OCT at the inflection point (red arrow). The horizontal dark area corresponds to path of needle penetration and suture insertion. The vertical dark area represents shadowing from external suture knot. Bottom: Suture located in smooth zone (bracket) by SEM. [SL, Schwalbe’s line]
DISCUSSION
We report that the smooth zone varies widely in thickness. A previous study has shown that the width varies from 50 to 150 microns.1 While our results agree in that most individual measurements fall within this range, approximately one third do not. Also referred to as the “transition zone” or “flat zone”, boundaries of the smooth zone are characterized only by subtle, and even gradual, anatomical changes in the bordering corneal endothelium and trabecular meshwork.5
Despite the inherently high individual variability across measurements, profound changes still occur from the superior to the most inferonasal aspect of the eye. These changes appear to correlate with different distances between the rectus muscle insertions and cornea through a curved pattern known as the “Spiral of Tillaux”.7 Specifically, the inferior and medial rectus muscles insert closer than the superior rectus to the cornea.5 Since SL and the anterior sclera are both wider superiorly than inferonasally, the development of these two structures may be more tightly linked than previously thought.
One limitation to our study is possible foreshortening of the images because our quadrant samples were not inherently flat. Recordings of the “working distance” (focal length) at anterior and posterior edges of the smooth zone reveal no more than 100 microns of difference between anterior-posterior focal lengths. Trigonometry reveals that given a roughly 100-micron wide smooth zone and 100 micron deviation in focus, a tilt of up to 45º existed in these samples. Correcting for this maximal foreshortening by the inverse cosine of 45º (1.414), our methods may underestimate actual smooth zone width by up to 40%. However, this artifact would not change the outcome, as the difference between the superior and inferonasal regions would be proportionately the same.
The surgical recommendation for entering the eye in the superotemporal quadrant is supported by these results. Even though glaucoma valves are currently much larger, as devices for glaucoma (and potentially other) treatments become smaller, surgery may take advantage of the significantly wider SL in the superior quadrant than the inferonasal region. More favorable outcomes may result from implanting such devices in the superior anterior chamber angle because of a wider SL, even if only by tens of micrometers.
Although recent studies have shown the existence of corneal endothelial stem cells2, as well as a decreased corneal endothelial cell density in the elderly6, the limited age range of eyes available for our study precluded evaluation of age-related changes. Future studies should include eyes from younger subjects to better Figure 8. Correlation between Schwalbe’s line by Cirrus optical coherence tomography (OCT) and scanning electron microscopy (SEM). Top: Identification of SL by Cirrus OCT at the inflection point (red arrow). The horizontal dark area corresponds to path of needle penetration and suture insertion. The vertical dark area represents shadowing from external suture knot. Bottom: Suture located in smooth zone (bracket) by SEM. [SL, Schwalbe’s line] assess age-related differences.
Clinical detection of SL is now possible with the advent of high-definition OCT.8,9,11 Additionally, after higher magnification and resolution with 60-diopter lens modification, the termination of Descemet’s membrane is visible.10 Our results, although based only on a few eyes, indicate a correlation between SL (inflection point) by OCT and the smooth zone by SEM. Although no published studies have shown visibility of SL with Visante OCT, those studies have been limited by in vivo motion limitations.12 Our ability to visualize SL with Visante OCT may be a consequence of using stationary ex vivo human eye bank eyes. We believe that OCT may be of considerable value in bridging the conceptual gaps between clinical observation and basic research in our investigation of SL.
Acknowledgments
We appreciate statistical assistance by Eduardo Solessio, PhD at the Department of Ophthalmology, SUNY Upstate Medical University.
Footnotes
Conflicts of Interest
None.
REFERENCES
- 1.Spencer WH, Alvarado J, Hayes TL. Scanning electron microscopy of human ocular tissues: trabecular meshwork. Invest Ophthalmol. 1968;7:651–662. [PubMed] [Google Scholar]
- 2.Whikehart DR, Parikh CH, Vaughn AV, Mishler K, Edelhauser HF. Evidence suggesting the existence of stem cells for human corneal endothelium. Mol Vis. 2005;11:816–824. [PubMed] [Google Scholar]
- 3.Rachmiel R, Trope GE, Buys YM, Flanagan JG, Chipman ML. Intermediate-term outcome and success of superior versus inferior Ahmed Glaucoma Valve implantation. J Glaucoma. 2008;17:584–590. doi: 10.1097/IJG.0b013e31816299bc. [DOI] [PubMed] [Google Scholar]
- 4.Bersudsky V, Trevino A, Rumelt S. Management of endothelial decompensation because of glaucoma shunt tube touch by Descemet membrane endothelial keratoplasty and tube revision. Cornea. 2011;30:709–711. doi: 10.1097/ICO.0b013e3181fb8378. [DOI] [PubMed] [Google Scholar]
- 5.Hogan MJ, Alvarado JA, Weddell JE. Histology of the Human Eye: An Atlas and Textbook. Philadelphia, PA: WB Saunders; 1971. [Google Scholar]
- 6.Benetz BA, Yee R, Bidros M, Lass J. Examining and Imaging the Cornea and External Eye; Imaging Techniques of the Cornea: Specular Microscopy. In: Krachmer JH, Mannis MJ, Holland EJ, editors. Cornea: Fundamentals, Diagnosis and Management. New York: Elsevier; 2011. p. 189. [Google Scholar]
- 7.de Gottrau P, Gajisin S. Anatomic, histologic, and morphometric studies of the ocular rectus muscles and their relation to the eye globe and Tenon’s capsule. Klin Monbl Augenheilkd. 1992;200:515–516. doi: 10.1055/s-2008-1045811. [DOI] [PubMed] [Google Scholar]
- 8.Leung CK, Weinreb RN. Anterior chamber angle imaging with optical coherence tomography. Eye (Lond) 2011;25:261–267. doi: 10.1038/eye.2010.201. [DOI] [PMC free article] [PubMed] [Google Scholar]
- 9.Tian J, Marziliano P, Baskaran M, Wong TH, Aung T. Automatic anterior chamber angle assessment for HD-OCT images. IEEE Tran Biomed Eng. 2011;58:3242–3249. doi: 10.1109/TBME.2011.2166397. [DOI] [PubMed] [Google Scholar]
- 10.Wong HT, Lim MC, Sakata LM, Aung HT, Amerasinghe N, Friedman DS, et al. High definition optical coherence tomography imaging of the iridocorneal angle of the eye. Arch Ophthalmol. 2009;127:256–260. doi: 10.1001/archophthalmol.2009.22. [DOI] [PubMed] [Google Scholar]
- 11.Qin B, Francis BA, Li Y, Tang M, Zhang X, Jiang C, et al. Anterior chamber angle measurements using Schwalbe’s line with high-resolution Fourier- domain optical coherence tomography. J Glaucoma. 2012 doi: 10.1097/IJG.0b013e318264b921. [DOI] [PMC free article] [PubMed] [Google Scholar]
- 12.Bald M, Li Y, Huang D. Anterior chamber angle evaluation with Fourier-domain optical coherence tomography. J Ophthalmol. 2012;2012:103704. doi: 10.1155/2012/103704. [DOI] [PMC free article] [PubMed] [Google Scholar]


