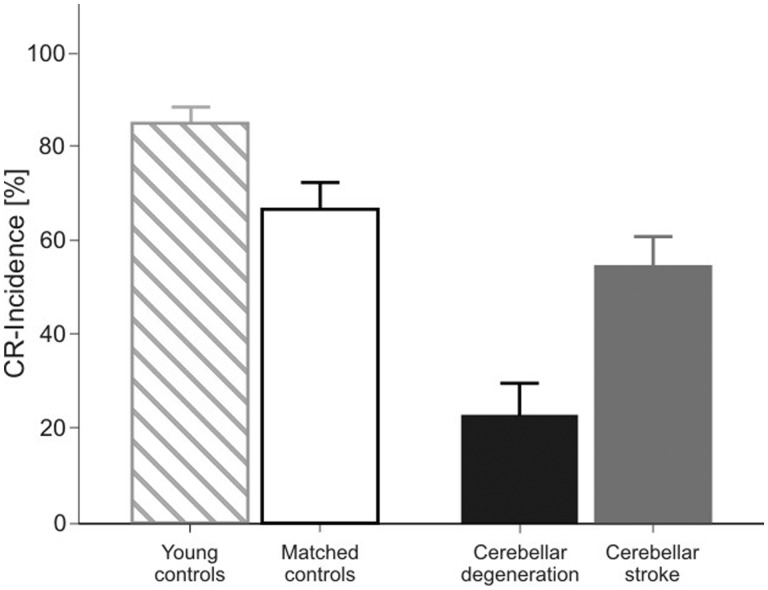
Figure 2.
Mean conditioned eye-blink response (CR) incidence (plus standard error) of the visual threat eye-blink response for younger-aged controls (hatched columns), age-matched controls (open column), patients with cerebellar degeneration (black column) and patients with focal lesions due to stroke (grey column). Conditioned eye-blink response incidence represents the mean of both eyes.

